Summary

Evanescent Field Gebaseerd Fotoakoestiek: Optical Property Evaluatie aan oppervlakken

Published: July 26, 2016
doi:

Summary

Hier presenteren we een protocol om materiaal te schatten en oppervlakte optische eigenschappen met behulp van de fotoakoestische effect gecombineerd met een totale interne reflectie. Deze techniek vervallende veld-gebaseerde Fotoakoestiek kan worden gebruikt om een ​​fotoakoestische meetsysteem materialen 'dikten, bulk en dunne film brekingsindices schatting maken en staand hun optische eigenschappen.

Abstract

Here, we present a protocol to estimate material and surface optical properties using the photoacoustic effect combined with total internal reflection. Optical property evaluation of thin films and the surfaces of bulk materials is an important step in understanding new optical material systems and their applications. The method presented can estimate thickness, refractive index, and use absorptive properties of materials for detection. This metrology system uses evanescent field-based photoacoustics (EFPA), a field of research based upon the interaction of an evanescent field with the photoacoustic effect. This interaction and its resulting family of techniques allow the technique to probe optical properties within a few hundred nanometers of the sample surface. This optical near field allows for the highly accurate estimation of material properties on the same scale as the field itself such as refractive index and film thickness. With the use of EFPA and its sub techniques such as total internal reflection photoacoustic spectroscopy (TIRPAS) and optical tunneling photoacoustic spectroscopy (OTPAS), it is possible to evaluate a material at the nanoscale in a consolidated instrument without the need for many instruments and experiments that may be cost prohibitive.

Introduction

Vooruitgang in het begrijpen van optische materialen 1,3,4,6,7,10,13-16 nieuwe inzichten verschaft in de creatie van dunne filmmaterialen voor tal van optische inrichtingen, inclusief antireflectiedeklagen over lenzen, optische hoge extinctieverhouding filters, en zeer absorberende plaat golfgeleiders 17. Deze ontwikkelingen zouden niet mogelijk zijn zonder het gebruik van veel karakterisatietechnieken, zoals ellipsometrie 4,6,18, Contacthoekmeting, atomic force microscopie 7,11,19 en scanning / transmissie elektronenmicroscopie, die helpen bij de iteratieve verbetering van deze technologieën door directe maatregelen of indirecte schattingen van de fundamentele optische eigenschappen van het materiaal. Genoemde eigenschappen, zoals de brekingsindex, bepalen hoe de stoffen interageren met invallende fotonen, die de functie en het gebruik in optische toepassingen direct beïnvloedt. Echter, elk van deze technieken heeft beperkingen betreffende resolutiestie, monstervoorbereiding, kosten en complexiteit, en elk genereert alleen een subset van de data nodig voor het volledig karakteriseren van het materiaal. Dat gezegd zijnde, een nieuwe reeks technieken, bekend als evanescent veld-gebaseerde Fotoakoestiek (EFPA) 5,6,15,18,20-49 zoals getoond in figuur 1, heeft het potentieel om materiaaleigenschappen te schatten op nanoschaal in een geconsolideerde aantal experimenten. EFPA omvat de sub-technieken van de totale interne reflectie fotoakoestische spectroscopie (TIRPAS) 23,25,26,33-35,43-45, fotoakoestische spectroscopie / totale interne reflectie fotoakoestische spectroscopie refractometer (PAS / TIRPAS refractiemethode) 18, en optische tunneling fotoakoestische spectroscopie (OTPAS) 6, en is gebruikt om bulk en dunne film brekingsindex laagdiktes schatten, evenals absorberende materialen op een prisma / sample of substraat / monsterscheidingsvlak detecteren.

Om het mechanisme EFPA begrijpen,moet eerst begrijpen het begrip fotoakoestische spectroscopie (PAS), dat betrekking heeft op de generatie van ultrasone drukgolven door de snelle thermo-elastische uitzetting van een chromofoor na de absorptie van een ultrakorte (<psec) lichtpuls (figuur 1). Theoretische en wiskundige kader voor de fotoakoestische effect besproken in dit document kan hier 50-59 worden verkregen. De resulterende drukverandering kan worden gedetecteerd door een ultrasone transducer of microfoon. De fotoakoestische effect, oorspronkelijk ontdekt in 1880 met de uitvinding van photophone Alexander Graham Bell, werd 'herontdekt' in de vroege jaren 1970 als gevolg van ontwikkelingen in de laser en microfoon technologie, en uiteindelijk in praktisch gebruik te maken aan niche-toepassingen van biomedische beeldvorming naar dunne film te vullen analyse om niet-destructief testen van materialen. 1,53-57,59-82 Dit effect kan mathematisch worden beschreven met één-dimensionale golfvergelijkingen, waarbij the golf is een eenvoudige akoestische bron waarvan de druk (p) varieert in beide posities (x) en tijd (t):

Equation1

oplossingen voor eenvoudige akoestische bronnen van de vorm 64

Equation2

waarbij p druk Γ = av s 2 / Cp waarbij α = het volume thermische uitzettingscoëfficiënt, v s de geluidssnelheid in het medium, en Cp de warmtecapaciteit bij constante druk, H 0 is de bestralingsdosis van de laserbundel, c de geluidssnelheid in het medium opgewonden, x lengte, en t de tijd. De grootte van de resulterende akoestische golf steunt direct op de optische absorptiecoëfficiënt van het materiaal, een p, which is de inverse van de optische indringdiepte δ, die op zijn beurt een maat voor de afstand die het licht reist totdat weggestorven 1 / e van de oorspronkelijke optische intensiteit. Terwijl Vergelijking (1) een algemene vergelijking voor een eendimensionale vlakke golf bron, zal typisch een absorberende bolvormige akoestische golven in drie dimensies uitstoten. Voorbij de mathematische beschrijving, toepassingen van de fotoakoestische effect 54 omvat een groot beeldvormingsmodaliteiten zoals microscopie, tomografie, en zelfs moleculaire beeldvorming vanwege de fotoakoestische effect met een hoge gevoeligheid door het grote optische absorptie als gevolg van nature aanwezige chromofoor hemoglobine. Andere toepassingen van de fotoakoestische effect hebben zelfs de schatting van verschillende dunne film eigenschappen 15,16,20,21,24,26-32,36-39,41,42,56,83,84. Echter, PAS heeft bepaalde beperkingen: (1) een omvangrijke optische indringdiepte elimineert de mogelijkheid near-field optische eigenschappen sonde aan oppervlakken (2) iss doelmatigheid van het vangen van de uitgezonden akoestische energie is laag door richtingscoëfficiënt van de meerderheid van de energie vanaf de detector (3) monsters chromoforen bij een golflengte regime beschouwde omvatten.

In combinatie met oneindig kleine veld-gebaseerde technieken zijn echter veel van deze beperkingen kunnen worden verbeterd. Het verdwijnende veld wanneer een lichtstraal ondergaat totale interne reflectie (TIR), zoals beschreven door Snell's Law, welk effect ook mogelijk vezeloptische golfgeleiders licht grote afstand (km) voor berekening en telecommunicatietoepassingen begeleiden. In praktische toepassingen, is het verdwijnende veld gebruikt in een verscheidenheid van karakterisatie en beeldvorming technieken, waaronder verzwakte totale reflectie spectroscopie (ATR). Beeldvorming wordt bereikt met hoog contrast als gevolg van de opsluiting van het licht binnen de eerste paar honderd nanometer in het monster van belang. De verdwijnende veld heeft de vorm van een exponentially decaying gebied dat zich uitstrekt in de externe medium een ​​optische penetratiediepte die typisch in de orde van de golflengte wordt gebruikt (meestal ~ 500 nm of minder) zoals getoond in de vergelijkingen 3 en 4.

Equation3

waarbij I de lichtintensiteit% op een locatie z van het prisma / monsterscheidingsvlak, I 0 is de oorspronkelijke intensiteit licht in% aan het grensvlak, z afstand nanometer en δ p de optische indringdiepte Volgens vergelijking 4. met een dergelijke kleine optische indringdiepte het verdwijnende veld kan samenwerken met de omgeving zeer dicht bij het grensvlak van de twee materialen, en duidelijk onder de optische en akoestische diffractie grenzen. De optische eigenschappen van materialen of deeltjes in dit bereik kan het veld verstoren of wijziging in de generatie, die interactie met een verscheidenheid aan werkwijzen 3 kan worden gedetecteerd,5,6,10,15,17,18,21,23,25-27,29-47,84-95.

Wanneer verdwijnende technieken worden gecombineerd met PAS, kunnen de foto-akoestische golfvormen geproduceerd worden gebruikt om materialen of deeltjes interactie met het verdwijnende veld te karakteriseren, waardoor het oneindig kleine veld-gebaseerde Fotoakoestiek (EFPA) groep technieken, zoals weergegeven in figuur 1. Deze familie omvat, maar niet beperkt tot, totale interne reflectie fotoakoestische spectroscopie (TIRPAS), optische tunnel fotoakoestische spectroscopie (OTPAS) en oppervlakte plasmon resonantie fotoakoestische spectroscopie (SPRPAS). De geïnteresseerde lezer moet verwijzen naar de volgende referenties voor afleidingen van de vergelijkingen gebruikt voor TIRPAS 5,6,18,23,25,26,33-35,43-47, PAS / TIRPAS refractometrie 18 en OTPAS 6. In elk geval wordt het effect fotoakoestische gegenereerd door een ander aandrijfmechanisme dan eenvoudige doorlating door een prisma; bijvoorbeeld in TIRPAS, het licht is evanescentlygekoppeld door een prisma / substraat / sample interface in de chromoforen (die de sample materiaal zelf, of gast moleculen in het monster kunnen zijn), terwijl in SPRPAS, de primaire wijze van excitatie is in plaats daarvan door de absorptie van een surface plasmon, dat is een secundaire EM golf gemaakt wanneer de energie van het verdwijnende veld wordt overgebracht in de elektronenwolk van een metaallaag afgezet op het prisma oppervlak. Deze familie van technieken werd oorspronkelijk uitgevonden in de vroege jaren 1980 door Hinoue et al., En op door T. Inagaki et al verbeterd. Met de uitvinding van SPRPAS, maar zag heel weinig ontwikkeling als gevolg van technische beperkingen van de lichtbronnen en de beschikbare detectie-apparatuur . Recenter hebben eerdere onderzoeken aangetoond dat verhoogde gevoeligheid en utility mogelijk moderne polyvinylideenfluoride (PVDF) ultrasone detectors en Q-geschakelde neodymium gedoopte yttrium-aluminium-granaat (Nd: YAG) lasers. Specifiek nanoseconde gepulseerde Nd: YAGlasers resulteren in een 10 6-voudige verhoging van het piekvermogen dat EFPA technieken toelaat om nuttige instrumenten geworden voor het evalueren van de optische eigenschappen van verschillende materialen en interfaces 5,6,15,18,21-29,31-47,84 , 96. Daarnaast is eerder werk verder getoond het vermogen van dergelijke technieken om structurele informatie over materialen tot een interface, die worden bereikt met traditionele fotoakoestische spectroscopie (PAS) technologieën voorheen nooit bepalen vanwege de relatief grote indringdiepte 53,55,57,59, 61,62,69,73,75,80,81.

Deze mogelijkheid wordt in de protocollen die volgen onder OTPAS techniek; echter op een fundamenteel niveau de drie technieken elk steunen op een andere definitieve vergelijking, die de mogelijkheden van de techniek bepaalt. Bijvoorbeeld, in TIRPAS de optische penetratiediepte van het verdwijnende veld, δ 'p, vooral drijft de resulterende akoestischesignaalintensiteit een absorberende monster, en wordt beschreven door:

Equation4

waarbij λ 1 is de golflengte van licht dat door het prisma medium en wordt gedefinieerd met de vergelijking λ λ = 1 / n 1 waarin n 1 is de brekingsindex van het prisma materiaal. Bovendien, θ verwijst naar de hoek van excitatie en n 21 verwijst naar de verhouding van de brekingsindices van elk medium en wordt gedefinieerd door n = 21 n 2 / n 1, waarbij n2 de brekingsindex van het monstermateriaal. Hoe groter de optische penetratiediepte, hoe meer materiaal wordt bestraald. Voor de fotoakoestische effect, hoe groter de optische indringdiepte, hoe meer materiaal wordt geëxciteerd dat akoestische golven leiden tot een grotere akoestische signaal kan produceren.

<pclass = "jove_content"> In tegenstelling tot TIRPAS echter in PAS / TIRPAS Refractometrie de primaire vergelijking is de wet van Snell:

Equation5

waarbij n 1 is de brekingsindex van het prisma, θ 1 is de invalshoek op het prisma / monsterscheidingsvlak, n2 de brekingsindex van het monster en θ 2 is de hoek van het licht dat is gebroken door de tweede medium. De gevoeligheid van het schatten van de brekingsindex van een materiaal wordt voornamelijk gedreven door de nauwkeurigheid van de schatting van θ 1. totale interne reflectie die wordt bereikt wanneer θ 1 is boven de kritische hoek die een verdwijnende veld genereert, sin θ 2 = 1 en daarom vergelijking 5 reduceert tot n 2 = n 1 sinθ 1. (Let op: θ 1kritische) kennen van de hoek waaronder de numerieke afgeleide (dP / dθ waarbij P het piek tot piek spanning van de fotoakoestische signaal en θ is de invalshoek van het licht met het monster) van het fotoakoestische signaal een lokale minima toelaat voor de schatting van θ 1 waarmee de gebruiker die opgelost n 2 en daarmee schat de grootste brekingsindex van een monster zoals weergegeven in figuur 1.

Ten slotte OTPAS, de volgende vergelijking betrekking optische transmissie% tot fotoakoestische piek-piek spanning van:

Equation6

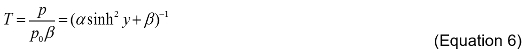
waarbij T het percentage optische transmissie, p is de piek-tot-piek spanning die door het hoekspectrum van een substraat met een film erop, p 0 is de piek-tot-piek spanning die door het hoekspectrum ofa substraat β is de koppelingsconstante basis van de brekingsindex van prisma en de immersie olie, α is de dempingsfactor, en is een factor die dikte en de brekingsindex van het filmmonster in het verdwijnende veld omvat. De gevoeligheid van deze techniek op dikte en brekingsindex wordt bepaald door de nauwkeurigheid van schatten van de piek akoestische signaal intensiteiten, p en p 0 pieken op elke hoek van inval in het hoekspectrum. Het is aangetoond dat β rechtstreeks worden berekend op basis van de brekingsindex van het prisma en immersie olie; derhalve is een eenvoudige taak om de optische transmissie bij elk invalshoek berekenen en pak vervolgens een schatting van de brekingsindex en dikte van de film door middel van statistische analyse curve fitting. De geïnteresseerde lezer moet verwijzen naar Goldschmidt et al. Voor meer informatie. 5,6

THij EFPA systeem is een systeem fotoakoestische kan het schatten van de dikte, dunne film brekingsindex bulk brekingsindex, en het genereren van akoestische signalen door optische absorptie voor detectie. Het systeem omvat een laser, een optische trein naar de lichtgeleider om de prisma / monster en de laserenergie meting zijde. De laser energiemeting zijde wordt gebruikt om de fotoakoestische signaal naar de invallende laserenergie normaliseren zie figuur 2. Het EFPA wordt aangedreven door een stappenmotor bestuurder de prisma roteren / monster voor de hoekige spectra PAS / TIRPAS refractometrie en OTPAS . Het systeem verkrijgt gegevens via een digitale acquisitie kaart en biedt een gebruiksvriendelijke interface en geautomatiseerde stadium controle door middel van een in-house programma.

Protocol

1. Het opzetten van het systeem Gebruik cyanoacrylaat epoxyhars een 9 mm diameter, 1 mm dikke rode latex rubberen cilinder zich aan het voorvlak van een 10 MHz ultrasone transducer en gebruiken cyanoacrylaat epoxyhars een 9 mm diameter, 1 mm dikke rode latex rubber cilinder een dikke 6 mm hechten acrylblok die vervolgens op dezelfde wijze wordt Epoxied de verwijzing ultrasone transducer op te treden als een akoestische afstandhouder. Het opzetten van een optische trein die een bundel expander heeft geraakt wordt door de laser eerste. Plaats dan een met de hand instelbare diafragma tweede. Uiteindelijk gebruik een polariserende bundelsplitser kubus als derde element en plaats de ultrasone transducer in de EFPA prismahouder en de transducer in de EFPA prismahouder aan elke uitgang van de niet-polariserende bundelsplitser. Opmerking: De polariserende bundelsplitser kubus wordt gebruikt om een ​​zuivere, enkele polarisatie excitatie waarborgen is kritisch voor de juiste werking van EFPA technieken. Vouw de uitgaafing laserstraal gebruikt lenzen een bundelexpander van ten minste 3x de Q-switched Nd maken: YAG laser. Opmerking: De balk is opzettelijk oversized ten opzichte van de latex absorber op het monster transducer om een ​​goede sensor-functie ondanks laserlicht te garanderen lopen uit als gevolg van breking door het prisma op verschillende invalshoeken. Lijn de optische trein en EFPA prisma houder zodanig dat de platte kant van de berg het dichtst bij het prisma wordt ingesteld op een 0 ° hoek met behulp van een digitaal niveau. Dit zorgt voor een juiste uitgangspunt voor de hoekige spectrum gegevens die worden verzameld tijdens de experimenten. Sluit en macht op externe apparaten zoals de oscilloscoop, stappenmotor driver op de computer, de ultrasone omvormers en XY fase motoren. Fysiek sluit de transducer niet in het EFPA prisma monteren aan CH0 en fysiek sluit de transducer in de EFPA prisma monteren op kanaal 1 via 50 ohm BNC-kabels. De software is voorgeprogrammeerd om te herkennencoustic signalen van deze specifieke kanalen. 2. EFPA Systeeminitialisatie en optische uitlijning Stel handmatig instelbaar diafragma op de balk tot een diameter van 1 mm te blokkeren. Start de programmeersoftware (bijvoorbeeld LabVIEW), zet de hoek tot 70 ° door op de "move" groene knop om de berg te verplaatsen naar de hoek die nodig is voor 70 ° excitatie bij het ​​prisma / sample interface. Gebruik van geschikte laserveiligheidsbril (OD 7+ bij 532 nm), onderzoeken de prisma vanaf de zijkant loodrecht op de laserstraal handmatig het podium bewegen in de X- en Y-assen met de handwielen tot 1 mm laserspot fluorescentie zichtbaar het rubberlatex. Zorgen dat de bundel midden op de latex. Vouw de manueel verstelbare opening op de maximale opening en kijk naar de lopende voorpaneel van het programma om zowel de laserenergie meting fotoakoestische signaal van de EFPA prisma mount te waarborgen (rode lin) en de fotoakoestische signaal van de laserenergie meting zijde (witte lijn) toegankelijk zijn en ongeveer dezelfde amplitude. Stop het programma door te drukken op de "STOP" knop. Let op: Als de knop niet ingedrukt wordt het prisma moet handmatig worden gereset voordat de voortzetting van de testen. Zodra de initialisatie protocol is voltooid, kan TIRPAS, PAS / TIRPAS refractometer of OTPAS worden uitgevoerd. 3. TIRPAS Techniek Plaats het prisma in de kunststof prisma montageadapter zie figuur 3. Plaats vervolgens 2,5 ui immersieolie index aangepast aan het type prisma gebruikt, op het midden van het prisma en sandwich de olie door een substraat bovenop de olielaag. Breng 25 gl van het monster latex aangesloten op de omzetter de EFPA transducersteun zoals getoond in figuur 3 zodat deze bedekt het gehele oppervlak zonder blaasvorming. Het monster kanzijn elk optisch absorberende materiaal zoals een oplossing van kleurstof, een biologische vloeistof, of een analyt gesuspendeerd in een oplossing. Geen voorbereiding van het monster nodig is. Druk de prisma monteren en draai de berg samen met de bevestigingsschroeven om een ​​set koppel van 16,75 g / mm voor elke schroef. Selecteer het tabblad "Instellingen" en selecteer "Setup" op het drop-down menu. Start het programma met de titel OTPAS dunne film analyzer_USB-5133.vi (aanvullend File). Bekijk het akoestische signaal dat door het monster zoals weergegeven in figuur 4. Opmerking: De invalshoek kan worden veranderd om de optische penetratiediepte van het verdwijnende veld besturen dunnere of dikkere optische secties van het monster nemen. 4. PAS / TIRPAS Refractometrie Plaats het prisma in de kunststof prisma montageadapter zie figuur 3. Plaats vervolgens 2,5 ui immersieolie index aangepast aan het type prisma gebruikt, op the midden van het prisma en sandwich de olie door een substraat boven de olielaag. Plaats 25 ul van het monster op de rubber stuk is aangesloten op de transducer in de EFPA transducer monteren zoals weergegeven in figuur 3. Druk de prisma monteren en draai de berg samen met de bevestigingsschroeven om een set koppel van 16,75 g / mm voor elke schroef. Selecteer het tabblad 'Angular Spectrum "en selecteer" Angular Spectrum "op het drop-down menu. Voer daarna de juiste parameters in het programma zoals getoond in tabel 1. Start het programma en wacht tot de hoekige spectrum is afgerond en het programma is afgelopen. Klik met de rechtermuisknop op de hoekige spectrum grafiek en kies "exporteren → Exporteren naar Excel" om de gegevens op te slaan en het CSV-bestand te openen. Open deze gegevens in een grafische opleiding (bijv KaleidaGraph), en het uitvoeren van een numerieke afgeleide erop te klikken op "Macro's" en het selecteren & #34; Derivative ". Voer de betreffende kolommen aan de afgeleide nemen en druk op" Okay "en de numerieke afgeleide zal worden berekend. Grafiek De numerieke afgeleide vs. hoek en selecteer "Curve fit". Selecteer de "Smooth" optie 5,18,98 en selecteer het selectievakje van de gegevens op grond van "Curve fit selecties" aan te passen om ruis te glad uit de gegevens. Selecteert u de pijl down under "View" en selecteer "Copy curve fit om het venster gegevens" om de curve fit gegevens uit te pakken naar een andere kolom. Handmatig te zoeken door middel van de curve fit aan de lokale minimum en de bijbehorende invalshoek dat een overgang van de PAS aan TIRPAS regimes geeft te vinden. Dit minimum komt overeen met de gemeten kritische hoek, zie figuur 5. De vergelijking monster n = n prisma sin θ c Bereken het grootste brekingsindex van het onbekende monster bij de golflengte gebruikt voor laser verhoor. Typische resultaten zijn in tabel 1. 5. OTPAS Plaats 2,5 pl immersieolie (index aangepast aan glassoort gebruikt) in het midden van het prisma. Plaats de film of substraat te beproeven film naar boven (van de prisma) en voorkomen dat bellen worden gevormd tijdens plaatsing. Opmerking: Als er bellen te vormen, te verwijderen filmmonster of substraat en opnieuw te proberen applicatie. Plaats 25 ul van immersie olie op de latex, zodat de immersie olie bedekt het gehele oppervlak zonder blaasvorming. Comprimeer het substraat / filmlagen zoals getoond in figuur 3. Draai de schroeven een ingestelde draaimoment van 16,75 g / mm die identiek zijn voor elke schroef moet zijn. Opmerking: momentsleutel in protocol is in oz.-in., dus 16,75 g / mm ~ 15 oz.-in. Selecteer het tabblad 'Angular Spectrum "en selecteer" Angular Spectrum' op de drop down mannenu. Voer daarna de juiste parameters in het programma zoals getoond in tabel 3. Start het programma en wacht tot de hoekige spectrum is afgerond en het programma is afgelopen. Voer de test door stappen 5,1-5,6 met het substraat of film (wat niet eerder is uitgevoerd) zoals getoond in figuur 6. Selecteer "Curve Fitting" in de drop down box en selecteer het tabblad "Curve fitting". Voer daarna de juiste parameters zoals weergegeven in tabel 5. Selecteer de film scan onder "Voorbeeld". Selecteer het substraat scan onder "substraat". Voer de brekingsindex, polarisatie, en andere opties voor de scans eerder uitgevoerd in stappen 5,1-5,6 zoals in tabel 4. Start het programma door in het drop down box "Curve Fitting" selecteren en het tabblad "Curve Fitting". Let op de brekingsindex en de dikte onder4;. Film RI "en" Dikte van de film "getoond in de rechterbovenhoek van de grafische user interface van het programma Typisch data wordt weergegeven in figuur 7. Gebruik de optie 'Batch fit "voor veel scans te passen in een keer door het invoeren van het aantal scans tot partij pasvorm en een CSV-bestand te selecteren om de output van de gegevens aan en herhaal stap 5.10. Let op: Als het programma wordt uitgevoerd zal het elke set van gegevens en output alle brekingsindex, dikte en restwaarden aanpassen aan het CSV. Om dit te laten werken, moet de scans in een numerieke lijst zoals scan_001.csv, scan 002.csv, etc.

Representative Results

De resultaten zijn getoond TIRPAS, PAS / TIRPAS refractometrie en OTPAS de subtechniques binnen de EFPA platform. Figuur 4 toont een representatief TIRPAS akoestische golf opgewekt door een absorberende monster. De bipolaire aard van de akoestische golf is kenmerkend voor de TIRPAS techniek en geeft aan dat TIRPAS plaatsvindt. Deze bipolaire golfvorm wordt veroorzaakt door de akoestische reflectie op het grensvlak tussen het monster en het glassubstraat vanwege een groot verschil in akoestische impedantie. Voor PAS / TIRPAS refractometrie Figuur 5 en Tabel 1 werd verkregen. Figuur 5 toont het hoekspectrum en numerieke derivaat verkregen voor een monster testen om het grootste brekingsindex schatting ondergaan. Tabel 1 toont de resultaten van het gebruik van PAS / TIRPAS refractometrie het schatten bulk brekingsindex van een water / PEG / Directe rode kleurstof mengsel als Comparood naar de bulk brekingsindex schatting met behulp van een standaard handheld refractometer. Tenslotte worden OTPAS resultaten weergegeven in figuur 7 en tabel 2. Figuur 7 toont twee cijfers van de hoekige scans die worden genomen tijdens OTPAS. Tabel 2 geeft een vergelijking tussen OTPAS en spectroscopische ellipsometrie van dezelfde dunne filmmonsters. Figuur 1. Subtechnologies van EFPA. EFPA aanbevelen uit drie verschillende sub-technologieën. Deze technologieën zijn TIRPAS, PAS / TIRPAS refractometrie en OTPAS. Elke techniek kunnen materialen ontlenen bepalen of andere eigenschappen te evalueren. TIRPAS detecteert materialen op basis van hun optische absorptie voor biosensoren doeleinden, PAS / TIRPAS refractometer evalueert bulk brekingsindex en OTPAS evalueert dunne film brekingsindex eend dikte. In TIRPAS, het licht boven de kritische hoek θ c creëert een verdwijnende veld dat een akoestische golf op de interactie met een optische absorber kan genereren. In PAS / TIRPAS refractometer, worden beide TIRPAS en PAS golfvormen verkregen uit zowel verdwijnende veld fotoakoestische excitatie en traditionele fotoakoestische excitatie. Door het uitzetten van beide regimes op hoekspectrum grafiek, kan de over- hoek worden opgemerkt, dat vervolgens kan worden gebruikt om de brekingsindex te leiden. Ten slotte OTPAS een spectrum van akoestische signalen worden verkregen met laserbestraling dan de kritische hoek θ c zowel een dunne film op een substraat en een kaal metaal. Door het toepassen van een niet-lineaire curve-fitting algoritme om de data, de dunne film dikte en brekingsindex kunnen worden afgeleid. Klik hier om een grotere versie van deze figuur te bekijken. <p class="jove_content" fo: keep-together.within-page = "1"> . Figuur 2. EFPA schematische / Foto links: Voor het instellen van EFPA de laserstraal moet worden uitgebreid naar de sensing gebied waarop het latex te vol. De bundel dient echter aanvankelijk op 45 graden ten opzichte van het prisma zijn. Rechts:. Foto van de installatie die de optische trein Klik hier om een grotere versie van deze figuur te bekijken. Figuur 3. Voorbeeld laden. Monsters worden geladen met het prisma om optisch contact via immersie olie aan het substraat. In TIRPAS of PAS / TIRPAS refractometer, wordt direct contact met vloeistof bereikt met het monster op het substraat voor het testen. In OTPAS, de optische koppeling through extra olieimmersie tussen het substraat en rode latex zorgt voor optische tunnelen optreedt. De mount wordt vervolgens geklemd samen met een momentsleutel en bevestigingsschroeven. Klik hier om een grotere versie van deze figuur te bekijken. Figuur 4. TIRPAS typische data. TIRPAS golfvormen hebben meestal een bipolair akoestisch signaal verschijning die kenmerkend is voor het TIRPAS methode. Klik hier om een grotere versie van deze figuur te bekijken. Figuur 5. PAS / TIRPAS typische data. </Strong> Links: Angular spectrum gegevens die worden verkregen door het bestralen van het monster bij verschillende invalshoeken. Rechts: Numerieke derivaat van linkerfiguur dat een lokale minima waarin de overgang van de PAS TIRPAS regimes, die weer overeenkomt met de positie van de kritische hoek onthult. Overgenomen met toestemming. 18 Klik hier om een grotere versie van deze figuur te bekijken. Figuur 6. Programma stroomschema. Het programma wordt uitgevoerd in een aantal iteratieve stappen. Het prisma mount is ingesteld op nul graden en daarna parameters worden geselecteerd voor het uitvoeren van het programma. Dan het programma wordt uitgevoerd op een hoekspectrum van zowel een substraat en een film te verkrijgen. Tenslotte is een curve fit aan de gegevens de film brekingsindex en dikte schatten. Overgenomen met toestemming. 6 Klik hier om een grotere versie van deze figuur te bekijken. . Figuur 7. OTPAS typische gegevens Links: Deze figuur toont de hoekige spectrum scans van een MgF2 film en een N-BK7 substraat respectievelijk. Rechts: Door het verdelen van de MgF2 film hoekspectrum scan door de N-BK7 substraat scannen en te vermenigvuldigen met een constante factor beta, mate van optische tunneling (%) vs. invalshoek kan worden verkregen, waardoor de schatting van de refractieve index en de dikte van de dunne film. klik hier om een grotere versie van deze figuur te bekijken. PAS / TIRPAS monster 1 monster 2 monster 3 monster 4 monster 5 Atago R-5000 Direct rood / PEG 125 ug / ml 1.395 1.395 1.395 1.395 1.395 1,395-1,397 Direct rood / PEG 250 ug / ml 1.39 1.39 1.39 1.39 1.39 1,390-1,396 Direct rood / PEG 500 ug / ml 1.388 1.389 1.389 1.389 1.389 1,381-1,395 Direct rood / PEG 750 ug / ml 1.382 1.382 1.387 1.387 1.387 1,372-1,395 </td> myoglobin 460 ug / ml 1.33 1.329 1.331 1.33 1.331 1.335 Tabel 1. PAS / TIRPAS resultaten. De volgende tabel laat de typische resultaten voor Directe rode kleurstof met 50% PEG gemengd in de brekingsindex te verhogen. Overgenomen met toestemming. 18 typekeuring Techniek filmtype Brekingsindex Dikte (nm) Intrasample OTPAS MgF2 200 nm 1,384 ± 0,004 203 ± 6 Intrasample Ellipsometry MgF2 200 nm 1.393 ± 0.001 192,4 ± 1,1 Intersample OTPAS MgF2 200 nm 1,395 ± 0,011 220 ± 19 Intersample ellipsometrie MgF2 200 nm 1,392 ± 0,002 195,2 ± 1,8 Tabel 2. OTPAS resultaten. De volgende tabel laat de typische resultaten voor 200 nm MgF2 dunne films in OTPAS vs. spectroscopische ellipsometrie. Intrasample verwijst naar het testen van een enkele film tien keer, terwijl intersample verwijst naar het testen van tien films onafhankelijk van elkaar. Overgenomen met toestemming. 6 # Gemiddelden </strong> 1 Begin hoek 60 Warmup (min) 0 Brekingsindex (prisma) 1.519 # scans 1 Stapgrootte 0.1 Opslaan in "Yourfilename" .csv Microstep # 10 Set Q-switch 275 Stop hoek 80 laser selecteert Surelite Snelheid (rpm) 500 Fouttolerantie (%) 5 laser startup op Low pass filter (progRAM) 1.00 x 10 7 Acceleration (RPS) 200 Tabel 3. Angular spectrum instellingen voor PAS / TIRPAS refractometriemethode. De volgende tabel geeft de voorwaarden voor een hoekige spectrum in PAS / TIRPAS refractometer instellingen. # Gemiddelden 64 Begin hoek 70 Warmup (min) 1 Brekingsindex (prisma) 1.519 # scans 1 Stapgrootte 0.1 Opslaan in "Yourfilename &# 8221; .csv Microstep # 10 Set Q-switch 275 Stop hoek 72 laser selecteert Surelite Snelheid (rpm) 500 Fouttolerantie (%) 5 laser startup op Low pass filter (programma) 1.00 x 10 7 Acceleration (RPS) 200 Tabel 4. Angular spectrum instellingen voor OTPAS. De volgende tabel toont de voorwaarden voor een hoekige spectrum in OTPAS instellingen. Lagere brekingsindex 1 </Td> Tolerantie 1.00 x 10 -12 koppeling RI 1.519 substraat data Selecteer yourfilename.csv lagere dikte 0 nm Brekingsindex guess 1.3 Golflengte 532 nm Meerdere bestanden opslaan op Selecteer yourfilename.csv Upper dikte 1000 nm dikte guess 200 nm Polarisatie P gepolariseerd Hoeveel bestanden # Van bestanden die u wilt passen Max iteratie 5000 SubstraatRI 1.519 film data Selecteer yourfilename.csv Type fit Single fit / Batch fit Tabel 5. Curve fitting parameters. De volgende tabel toont de curve fitting parameters nodig voor een juiste parameterschatting. Aanvullende Code Bestand:. OTPAS dunne film analyzer_USB-5133.vi Klik hier om dit bestand te downloaden.

Discussion

The use of devices for the characterization of materials at the nanoscale will undoubtedly continue far into the future in order to produce new materials and combinations of materials to solve difficult and costly societal problems. Many methods such as ellipsometry, atomic force microscopy (AFM), and traditional photoacoustics are currently used to evaluate material properties at the nanoscale despite their inherent limitations due to few alternatives. EFPA shows promise as a consolidated set of techniques that can push beyond the typical limitations of the photoacoustic effect to provide a single instrument to characterize materials at the nanoscale.

The protocol described herein and its associated sub-techniques have the capability to estimate both bulk and thin film refractive indices of a material, film thickness, and have detection capabilities for a variety of biosensing applications. OTPAS specifically has the advantage that it can estimate the thickness and refractive index of nanometer scale films despite the fact that the films themselves do not contain inherently absorbing pigmentation. EFPA as a consolidated set of techniques has a few advantages over techniques such as ellipsometry, atomic force microscopy, and the traditional photoacoustic effect. The first advantage is that EFPA is comparatively inexpensive to set up. A typical EFPA setup can estimate refractive index from both the bulk and surface, can estimate thickness, and can probe absorbing materials and will cost around $5,000 to set up. In contrast, AFM setups cost around $50,000 and cannot estimate optical properties. Secondly, EFPA can estimate these properties within a few minutes without complex interaction such as in ellipsometry where input parameter error can cause differences in results. Finally, EFPA, when compared to the traditional photoacoustic effect, has axial resolution 100X smaller as it can estimate thickness of 200 nm films6 whereas the traditional photoacoustic effect is limited to 7,500 nanometers when using similar lasers and setup82. Conveniently, almost every material has independent and differing surface and bulk refractive index properties as well as absorptive properties, which collectively make for functional differences in their use in optical research systems.

Critical steps within the protocol come down to three primary considerations. First, optical coupling of the sample, whether that be a liquid or a film, is crucial to obtain reliable and repeatable results. Air bubbles within the immersion oil or sample will lead to inaccurate characterization of the thickness, refractive index, and in some cases a complete lack of sensitivity of the transducer to the excited sample owing to the inability of ultrasound to adequately pass through a liquid/air interface due to vastly differing acoustic impedance values. Second, with regard to OTPAS, a sample that is homogeneously thick in the area irradiated by the laser beam in order to provide consistent thickness values during scanning since as of yet EFPA cannot determine thickness differences within the area of excitation. Finally, again with regard to OTPAS, the sample film must be transparent to the wavelength being used. This is a fundamental assumption made in the mathematical equations that describe how OTPAS finds thickness and refractive index values. If absorption is substantial enough that more than 1% of the incident light is absorbed by the film, characterization will not match the real thickness and refractive index values of the film.

Modifications to the EFPA technique can be made with relative ease and other types of components can be substituted in for more effective scans or functionality. The only major issues that have to be addressed when building an EFPA system are the following. First, it is crucial to have a method of automatically rotating a prism mount and acquiring acoustic signals at small (0.05 degree) increments. Second, having a nanosecond pulse width or shorter laser system to excite samples using the photoacoustic effect. Third, having a graphical user interface or program to acquire the data to do mathematical curve fitting and numerical derivatives for estimating thickness and bulk/thin film refractive index.

There are three fundamental limitations to EFPA. The first is that in order to find the bulk refractive index, thin film refractive index, thickness, or detect materials using TIRPAS, the sample must have a refractive index that is less than that of the prism or substrate it is in contact with so that total internal reflection can occur which is the basis of all three of these techniques. The second limitation is that EFPA currently requires physical contact in order to estimate thickness, refractive index, and for detection of properties. The final limitation is that OTPAS, a sub-technique of EFPA, currently requires optically transparent materials to estimate thickness and refractive index of the thin film of interest.

This type of consolidated instrument could find many applications in characterization environments including research cores and industrial environments. Future work regarding EFPA techniques is focused on the improvement of the refractive index accuracy through improvements in instrumentation and translational/rotational stages. Additional advancements will focus around the improvement of signal-to-noise ratio for the detection of smaller quantities of absorbing materials, so as to characterize weakly absorbing materials, as are found most commonly in biological systems.

Disclosures

The authors have nothing to disclose.

Acknowledgements

Dit project werd gefinancierd door de National Science Foundation BRIGE Award (1.221.019).

Materials


100 mm plano convex lens Thorlabs LA1509 Plano convex lens for beam expander
-30 mm plano concave lens Thorlabs LC2679 Plano concave lens for beam expander
10 MHz Ultrasonic transducers Harisonic I31006T Ultrasonic sensors used for photoacoustic detection, both for laser energy measurement and for OTPAS mount
Immersion oil Type A Cargille 16482 Index of 1.519 to match that of NBK-7 substrates
Natural latex rubber sheet (red) McMastercarr 86085K11 Index ~1.519 to match that of Type A immersion liquid to act as an optical absorber to measure optical tunneling and laser energy
Laser goggles VERE 53 Used to protect eyes from laser light
Cage mounted non polarizing beam splitter cube Thorlabs CM1-BS013 Split laser light so that one half can be measured and one half can be used for excitation
Cage mounted polarizing beam splitter cube Thorlabs CM1-PBS251 Ensure light is polarized before being used for optical tunneling experiments
Graduated ring activated iris diaphragm Thorlabs SM1D12C Cut beam down to a smaller size for alignment
Data acquisition card National Instruments USB-5133 USB oscilloscope to acquire data
Stepper motor driver National Instruments MID-7604 Stepper motor driver to drive stepper motors for angular spectra
Sherline XY stage (14”) Sherline 5600-CNC/5610-CNC Sherline XY stage
4-jaw self centering chuck Sherline 1076/1034 Sherline rotational attachment
Right angle attachment Sherline 3701 Right angle attachment to attach rotational mount
CNC rotary table Sherline 8730 Rotary table for holding OTPAS prism/sample
Surelite I-20 laser system Continuum I-20 Q-switched Nd:YAG laser for exciting samples
NBK-7 prism Thorlabs PS911 Right angle prism for EFPA
Adjustable torque wrench Tohnichi RTD40Z Adjustable torque wrench to equally tighten down the EFPA mount for each technique to 16.75 g/mm
Digital level Micromark 84519 Digital level to ensure EFPA prism holder starts at 0 degrees.

References

  1. Byrappa, K., Kumar, B. V. S. Characterization of zeolites by infrared spectroscopy. Asian J Chem. 19 (6), 4933-4935 (2007).
  2. Coquil, T., Richman, E. K., Hutchinson, N. J., Tolbert, S. H., Pilon, L. Thermal conductivity of cubic and hexagonal mesoporous silica thin films. J Appl Phys. 106 (3), 034910 (2009).
  3. Courjon, D. . Near-Field Microscopy and Near-Field Optics. , (2003).
  4. Dultsev, F. N. Investigation of the microporous structure of porous layers using ellipsometric adsorption porometry. Thin Solid Films. 458 (1-2), 137-142 (2004).
  5. Goldschmidt, B. S. . Photoacoustic Evaluation of Surfaces via Pulsed Evanescent Field Interaction. , (2014).
  6. Goldschmidt, B. S., et al. Characterization of MgF2 thin films using optical tunneling photoacoustic spectroscopy. Opt Laser Technol. 73, 146-155 (2015).
  7. Junno, T., Anand, S., Deppert, K., Montelius, L., Samuelson, L. Contact mode atomic force microscopy imaging of nanometer-sized particles. Appl Phys Lett. 66 (24), 3295 (1995).
  8. Kang, T., Oh, S., Hong, S., Moon, J., Yi, J. Mesoporous silica thin films as a spatially extended probe of interfacial electric fields for amplified signal transduction in surface plasmon resonance spectroscopy. Chem Commun. (28), 2998-3000 (2006).
  9. Kresge, C. T., Leonowicz, M. E., Roth, W. J., Vartuli, J. C., Beck, J. S. Ordered mesoporous molecular sieves synthesized by a liquid-crystal template mechanism. Nature. 359 (6397), 710-712 (1992).
  10. Lew, C. M., Cai, R., Yan, Y. Zeolite Thin Films: From Computer Chips to Space Stations. Acc Chem Res. 43 (2), 210-219 (2010).
  11. Marchand, D. J., Hsiao, E., Kim, S. H. Non-contact AFM imaging in water using electrically driven cantilever vibration. Langmuir. 29 (22), 6762-6769 (2013).
  12. Yamada, T., et al. Surface Photovoltage NO Gas Sensor with Properties Dependent on the Structure of the Self-Ordered Mesoporous Silicate Film. Adv Mater. 14 (11), 812-815 (2002).
  13. Harrick, N. J. Internal Reflection Spectroscopy. Harrick Scientific Corporation. , (1987).
  14. Splinter, R., Hooper, B. A. . An Introduction to Biomedical Optics (Optics and Optoelectronics). , (2006).
  15. Sathiyamoorthy, K., Joseph, J., Hon, C. J., Matham, M. V. . Proceedings of SPIE – The International Society for Optical Engineering. 8001, (2011).
  16. Hernandez, C. M., Murray, T. W., Krishnaswamy, S. Photoacoustic characterization of the mechanical properties of thin films. Appl Phys Lett. 80 (4), 691 (2002).
  17. Veldhuis, G. J., Parriaux, O., Hoekstra, H. J. W. M., Lambeck, P. V. Sensitivity enhancement in evanescent optical waveguide sensors. J Lightwave Technol. 18 (5), 677-682 (2000).
  18. Goldschmidt, B. S., et al. Photoacoustic measurement of refractive index of dye solutions and myoglobin for biosensing applications. Biomed Opt Express. 4 (11), 2463-2476 (2013).
  19. Hansma, P. K., et al. Tapping mode atomic force microscopy in liquids. Appl Phys Lett. 64 (13), 1738 (1994).
  20. Shen, Y. C., Zhang, S. Y., Jiang, Y. S., Zhu, R., Wei, Y. Angular resonance absorption spectra of Langmuir-Blodgett films studied by the photoacoustic technique. Thin Solid Films. 248 (1), 36-40 (1994).
  21. Inagaki, T., Motosuga, M., Arakawa, E. T., Goudonnet, J. P. Coupled surface plasmons in periodically corrugated thin silver films. Phys Rev B Condens Matter. 32 (10), 6238-6245 (1985).
  22. Negm, S., Talaat, H. Effect of intrinsic surface roughness and other decay processes on surface plasmon polariton resonance halfwidth. Ultrasonics Symposium. 1, 509-514 (1992).
  23. Hinoue, T., Murata, H., Kawabe, M., Yokoyama, Y. Effects of thermal diffusion and solvent materials on photoacoustic signals in total internal reflection technique. Anal Sci. 2 (5), 407-410 (1986).
  24. Xu, M., Zhang, S., Inagaki, T. Investigation of optical resonance absorption on bigratings by photoacoustic angular spectroscopy. Shengxue Xuebao/Acta Acustica. 25 (5), 440-444 (2000).
  25. Hinoue, T., Kawabe, M., Yokoyama, Y. Measurement of concentration profile of dye at glass-solution interface by photoacoustic spectrometry coupled with total internal reflection technique. Bull Chem Soc Jpn. 60 (10), 3811-3813 (1987).
  26. Iwasaki, T., Sawada, T., Kamada, H., Fujishima, A., Honda, K. Observation of semiconductor electrode-dye solution interface by means of fluorescence and laser-induced photoacoustic spectroscopy. J Phys Chem. 83 (16), 2142-2145 (1979).
  27. Rothenhausler, B., Rabe, J., Korpiun, P., Knoll, W. On the decay of plasmon surface polaritons at smooth and rough Ag-air interfaces: A reflectance and photo-acoustic study. Surf Sci. 137 (1), 373-383 (1984).
  28. Jiang, Y., Zhang, S., Shao, H., Yuan, C. Optical properties of Langmuir-Blodgett films investigated by a photoacoustic technique. Appl Opt. 34 (1), 169-173 (1995).
  29. Inagaki, T., Goudonnet, J. P., Royer, P., Arakawa, E. T. Optical properties of silver island films in the attenuated-total-reflection geometry. Appl Opt. 25 (20), 3635-3639 (1986).
  30. Talaat, H., Bucaro, J. A., Huang, W., Macdiarmid, A. G. Photoacoustic detection of plasmon surface polaritons in heavily doped polyacetylene films. Synth Met. 10 (4), 245-253 (1985).
  31. Jung, C. S., Park, G., Kim, Y. D. Photoacoustic determination of field enhancement at a silver surface arising from resonant surface plasmon excitation. Appl Phys Lett. 47 (11), 1165-1167 (1985).
  32. Inagaki, T., Nakagawa, Y., Arakawa, E. T., Aas, D. J. Photoacoustic determination of radiative quantum efficiency of surface plasmons in silver films. Phys Rev B. 26 (12), 6421-6430 (1982).
  33. Hinoue, T., Shimahara, Y., Yokoyama, Y. Photoacoustic observation of solid-liquid interface by means of total internal reflection technique. Chem Lett. 12 (2), 225-228 (1983).
  34. Hinoue, T., Shimahara, Y., Murata, H., Yokoyama, Y. Photoacoustic spectrometry by total internal reflection technique: Dependence of photoacoustic signal intensity on concentration and optical path. Bunseki kagaku. 33 (11), E459-E466 (1984).
  35. Hinoue, T., Murata, H., Yokoyama, Y. Photoacoustic spectrometry coupled with total internal reflection technique : Theory and experiment. Anal Sci. 2 (5), 401-406 (1986).
  36. Inagaki, T., Kagami, K., Arakawa, E. T. Photoacoustic study of surface plasmons in metals. Appl Opt. 21 (5), 949-954 (1982).
  37. Negm, S., Talaat, H., Pelzl, J. . Proceedings of the IEEE Ultrasonics Symposium. 2, 1259-1261 (1993).
  38. Talaat, H., Dardy, H. D. . Ultrasonics Symposium Proceedings. 2, 700-703 (1983).
  39. Royer, P., Goudonnet, J. P., Inagaki, T., Chabrier, G., Arakawa, E. T. Photoacoustic study of the optical absorption of oblate silver spheroids in attenuated-total-reflection geometry. Physica Status Solidi (a). 105 (2), 617-625 (1988).
  40. Abdallah, T., Negm, S., Talaat, H. Photoacoustic surface plasmon for the detection of nicotine. Egypt J Solids. 25 (2), 181-189 (2002).
  41. Negm, S., Talaat, H. Radiative and non-radiative decay of surface plasmons in thin metal films. Solid State Commun. 84 (1-2), 133-137 (1992).
  42. Negm, S., Talaat, H. Surface plasmon resonance halfwidths as measured using attenuated total reflection, forward scattering and photoacoustics. J Phys: Condens Matter. 1 (50), 10201-10205 (1989).
  43. Muessig, P. R., Diebold, G. J. Total internal reflectance optoacoustic spectroscopy. J Appl Phys. 54 (8), 4251 (1983).
  44. Sudduth, A. S. M., Goldschmidt, B. S., Samson, E. B., Whiteside, P. J. D., Viator, J. A. Total internal reflection photoacoustic detection spectroscopy. Progress in Biomedical Optics and Imaging. 7899, 78993E-78993E-78998 (2011).
  45. Goldschmidt, B. S., et al. Total internal reflection photoacoustic spectroscopy for the detection of beta-hematin. J Biomed Opt. 17 (6), 061212 (2012).
  46. Hinoue, T., Imamura, G., Yokoyama, Y. Study of the Adsorption Layer at the Glass-Dye Solution Interface by Variable Incidence-Angle Internal-Reflection Spectrometry. Bull Chem Soc Jpn. 66 (12), 3680-3685 (1993).
  47. Hinoue, T., Kawabe, M., Doi, S., Yokoyama, Y. Photoacoustic estimation of reflectivities at solid-liquid interfaces by using total internal reflection technique. Hyomen Kagaku. 10 (2), 129-134 (1989).
  48. Hinoue, T., Kawabe, M., Yokoyama, Y. Measurement of concentration profile of dye at glass-solution interface by photoacoustic spectrometry coupled with total internal reflection technique. Chem Soc Japan. 60, 3811-3813 (1987).
  49. Hinoue, T., Murata, H., Yokoyama, Y. Photoacoustic spectrometry coupled with total internal reflection technique: theory and experiment. Anal Sci. 2, 401-406 (1986).
  50. Kinney, J. B., Staley, R. H. Applications of photoacoustic spectroscopy. Annu Rev Mater Sci. 12, 295-321 (1982).
  51. McDonald, F. A., Wetsel, G. C. Generalized theory of the photoacoustic effect. J Appl Phys. 49 (4), 2313-2322 (1978).
  52. Rosencwaig, A. Photo-acoustic spectroscopy of solids. Rev Sci Instrum. 48 (9), 1133-1137 (1977).
  53. Jacques, S. L., Palthauf, G., Viator, J. A. Photoacoustic imaging in biological tissues with pulsed lasers. Ann Biomed Eng. 28 (Suppl. 1), S-39 (2000).
  54. Xu, M., Wang, L. V. Photoacoustic imaging in biomedicine. Rev Sci Instrum. 77 (4), 041101 (2006).
  55. Rosencwaig, A. Photoacoustic spectroscopy. Annu Rev Biophys Bioeng. 9, 31-54 (1980).
  56. Hess, P. . Photoacoustic, Photothermal and Photochemical Processes at Surfaces and in Thin Films. , (1989).
  57. Rosencwaig, A. . Photoacoustics and Photoacoustic Spectroscopy. , (1980).
  58. Rosencwaig, A. Theoretical aspects of photoacoustic spectroscopy. J Appl Phys. 49 (5), 2905-2910 (1978).
  59. Rosencwaig, A., Gersho, A. Theory of the photoacoustic effect with solids. J Appl Phys. 47 (1), 64-69 (1976).
  60. Holan, S. H., Viator, J. A. Automated wavelet denoising of photoacoustic signals for circulating melanoma cell detection and burn image reconstruction. Phys Med Biol. 53 (12), N227-N236 (2008).
  61. Viator, J. A. . Characterization of Photoacoustic Sources in Tissue Using Time Domain Measurements. , (2000).
  62. Viator, J. A., et al. Clinical testing of a photoacoustic probe for port wine stain depth determination. Lasers Surg Med. 30 (2), 141-148 (2002).
  63. Viator, J. A., et al. A comparative study of photoacoustic and reflectance methods for determination of epidermal melanin content. J Invest Dermatol. 122 (6), 1432-1439 (2004).
  64. Viator, J. A., Jacques, S. L., Prahl, S. A. Depth profiling of absorbing soft materials using photoacoustic methods. IEEE Journal of Selected Topics in Quantum Electronics. 5 (4), 989-996 (1999).
  65. Weight, R. M., Viator, J. A. Detection of circulating tumor cells by photoacoustic flowmetry. Methods Mol Biol. 1102, 655-663 (2014).
  66. Gutierrez-Juarez, G., et al. Detection of melanoma cells in vitro using an optical detector of photoacoustic waves. Lasers Surg Med. 42 (3), 274-281 (2010).
  67. McCormack, D., Bhattacharyya, K., Kannan, R., Katti, K., Viator, J. A. . Progress in Biomedical Optics and Imaging – Proceedings of SPIE. 7564, (2010).
  68. McCormack, D., Bhattacharyya, K., Kannan, R., Katti, K., Viator, J. A. Enhanced photoacoustic detection of melanoma cells using gold nanoparticles. Lasers Surg Med. 43 (4), 333-338 (2011).
  69. Hu, S., Maslov, K., Tsytsarev, V., Wang, L. V. Functional transcranial brain imaging by optical-resolution photoacoustic microscopy. J Biomed Opt. 14 (4), 040503-040503-040503 (2009).
  70. Viator, J. A., et al. Gold nanoparticle mediated detection of prostate cancer cells using photoacoustic flowmetry with optical reflectance. J Biomed Nanotechnol. 6 (2), 187-191 (2010).
  71. Bhattacharyya, K., et al. Gold Nanoparticle-Mediated Detection of Circulating Cancer Cells. Clin Lab Med. 32 (1), 89-101 (2012).
  72. Galanzha, E. I., Shashkov, E. V., Tuchin, V. V., Zharov, V. P. In vivo multispectral, multiparameter, photoacoustic lymph flow cytometry with natural cell focusing, label-free detection and multicolor nanoparticle probes. Cytometry Part A. 73A (10), 884-894 (2008).
  73. Viator, J. A., Choi, B., Ambrose, M., Spanier, J., Nelson, J. S. In vivo port-wine stain depth determination with a photoacoustic probe. Appl Opt. 42 (16), 3215-3224 (2003).
  74. Wang, L. V. Multiscale photoacoustic microscopy and computed tomography. Nature Photonics. 3 (9), 503-509 (2009).
  75. Rousseau, G., Gauthier, B., Blouin, A., Monchalin, J. P. Non-contact biomedical photoacoustic and ultrasound imaging. J Biomed Opt. 17 (6), 061217-061211-061217-061217 (2012).
  76. Hochreiner, A., Bauer-Marschallinger, J., Burgholzer, P., Jakoby, B., Berer, T. Non-contact photoacoustic imaging using a fiber based interferometer with optical amplification. Biomed Opt Exp. 4 (11), 2322-2331 (2013).
  77. Wang, Y., Li, C., Wang, R. K. Noncontact photoacoustic imaging achieved by using a low-coherence interferometer as the acoustic detector. Opt Lett. 36 (20), 3975-3977 (2011).
  78. McCormack, D., et al. Photoacoustic detection of melanoma micrometastasis in sentinel lymph nodes. J Biomech Eng. 131 (7), 074519 (2009).
  79. Weight, R. M., Viator, J. A., Dale, P. S., Caldwell, C. W., Lisle, A. E. Photoacoustic detection of metastatic melanoma cells in the human circulatory system. Opt Lett. 31 (20), 2998-3000 (2006).
  80. Swearingen, J. A., Holan, S. H., Feldman, M. M., Viator, J. A. Photoacoustic discrimination of vascular and pigmented lesions using classical and Bayesian methods. J Biomed Opt. 15 (1), (2010).
  81. Talbert, R. J., Holan, S. H., Viator, J. A. Photoacoustic discrimination of viable and thermally coagulated blood using a two-wavelength method for burn injury monitoring. Phys Med Biol. 52 (7), 1815-1829 (2007).
  82. Samson, E. B., et al. Photoacoustic spectroscopy of beta-hematin. Journal of Optics. 14 (6), 065302 (2012).
  83. Goudonnet, J. P., Inagaki, T., Arakawa, E. T., Ferrell, T. L. Angular and polarization dependence of surface-enhanced Raman scattering in attenuated-total-reflection geometry. Phys Rev B. 36 (2), 917-921 (1987).
  84. Inagaki, T., Kagami, K., Arakawa, E. T. Photoacoustic observation of nonradiative decay of surface plasmons in silver. Phys Rev B. 24 (6), 3644-3646 (1981).
  85. Ruddy, V., MacCraith, B. D., Murphy, J. A. Evanescent wave absorption spectroscopy using multimode fibers. J Appl Phys. 67 (10), 6070-6074 (1990).
  86. Gupta, B. D., Singh, C. D. Fiber-optic evanescent field absorption sensor: A theoretical evaluation. iber Integr Opt. 13 (4), 433-443 (1994).
  87. Court, I. N., von Willisen, F. K. Frustrated Total Internal Reflection and Application of Its Principle to Laser Cavity Design. Appl Opt. 3 (6), 719-726 (1964).
  88. Suter, J. D., Sun, Y., Howard, D. J., Viator, J. A., Fan, X. . Proceedings of SPIE – The International Society for Optical Engineering. 7056, (2008).
  89. DeGrandpre, M. D., Burgess, L. W. Long path fiber-optic sensor for evanescent field absorbance measurements. Anal Chem. 60 (23), 2582-2586 (1988).
  90. Sun, Y., et al. Optofluidic ring resonator sensors for rapid DNT vapor detection. Analyst. 134 (7), 1386-1391 (2009).
  91. Mukundan, H., et al. Waveguide-Based Biosensors for Pathogen Detection. Sensors. 9 (7), 5783-5809 (2009).
  92. Gohring, J. T., Dale, P. S., Fan, X. Detection of HER2 breast cancer biomarker using the opto-fluidic ring resonator biosensor. Sensors and Actuators B: Chemical. 146 (1), 226-230 (2010).
  93. Sai, V. V. R., et al. Label-free fiber optic biosensor based on evanescent wave absorbance at 280nm. Sensors Actuators B: Chem. 143 (2), 724-730 (2010).
  94. Wang, F., Anderson, M., Bernards, M. T., Hunt, H. K. PEG Functionalization of Whispering Gallery Mode Optical Microresonator Biosensors to Minimize Non-Specific Adsorption during Targeted, Label-Free Sensing. Sensors (Basel). 15 (8), 18040-18060 (2015).
  95. Leung, A., Shankar, P. M., Mutharasan, R. A review of fiber-optic biosensors. Sensors Actuators B: Chem. 125 (2), 688-703 (2007).
  96. Saavedra, S. S., Reichert, W. M. Integrated optical attenuated total reflection spectrometry of aqueous superstrates using prism-coupled polymer waveguides. Anal Chem. 62 (20), 2251-2256 (1990).
  97. Cargille Labs. . Cargille Microscope Immersion Oils. , (2015).
  98. Stineman, R. W. A Consistently Well-Behaved Method of Interpolation. Creat. Comp. , 54-57 (1980).
check_url/kr/54192?article_type=t

Play Video

Cite This Article
Goldschmidt, B. S., Rudy, A. M., Nowak, C. A., Tsay, Y., Whiteside, P. J. D., Hunt, H. K. Evanescent Field Based Photoacoustics: Optical Property Evaluation at Surfaces. J. Vis. Exp. (113), e54192, doi:10.3791/54192 (2016).

View Video