Nuclear magnetic resonance, or NMR, spectroscopy is an important method for determining the molecular structure and purity of samples in organic chemistry.
In NMR spectroscopy samples are exposed to a strong magnetic field. Upon exposure certain nuclei transition, or resonate, between discreet energy levels. The energy gap between these levels can be measured and visualized as spectra. This data can be used to elucidate the chemical structure of the sample.
Not all nuclei have the required properties to be NMR-active. Common isotopes studied are 1H, 2H, 13C, 19F, and 31P.
This video will introduce the principles behind NMR, step through example preparations of NMR samples from different stages of a chemical reaction, and discuss several applications.
In the NMR instrument, liquid nitrogen and helium are used to cool a super-conducting magnet. The magnet applies a constant magnetic field to a sample. Within the sample, atomic nuclei with an odd number of protons and/or neutrons will align either with the field, adopting a low-energy state, or against it, adopting a high-energy state.
The energy difference between the two levels is the resonant frequency, which depends on the strength of the applied field and the type of nucleus. For the magnets used in NMR, the value is in the radio frequency, or RF, range.
An RF coil excites the sample with a radio frequency pulse, moving the low energy nuclei to the higher state, before reverting back. The coil detects these changes in magnetization, which are displayed as peaks.
The strength of NMR lies in its ability to distinguish nuclei, in this case hydrogen, by their chemical environment. Electrons on neighboring atoms will block, or “shield”, the nuclei from some of the magnetic field. This effective field changes the resonant frequency for the particular nuclei, called a chemical shift. In ethanol the methylene, hydroxyl, and methyl protons all have unique resonance frequencies. Determining the area under each peak elucidates the number of each type of proton.
Since instruments with different magnetic strengths will shift the resonant frequencies, they are referenced to a standard molecule added to the sample, often tetramethylsilane, or TMS. The chemical shift of the frequencies is very small, often reported in parts per million, or ppm.
When using a strong magnet with high resolution, peaks will sometimes split into subpeaks. This is caused by the neighboring nuclei, some of which are aligned with the magnetic field, some against; further changing the effective field applied to the nuclei. In ethanol, the 2 methylene protons split the methyl peak twice into a triplet, and the 3 methyl protons split the methylene peak thrice into a quartet. The distance of the splitting, or J-coupling, is related to the distance of the nuclei, aiding in qualitative discovery.
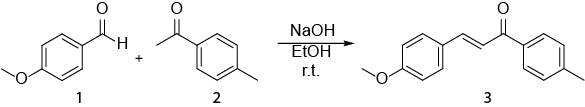
Now that you understand the basic principles behind NMR, let’s review an example procedure that uses proton NMR to monitor the synthesis of chalcone from an aldehyde and ketone.
Begin by using a Pasteur pipette to add a tiny amount of the starting material to a beaker. Move into the fume hood, and dilute the starting material with 0.7 mL of deuterated solvent. Deuterated solvents are used, as deuterium’s resonant frequency is outside the range for protons.
Use a Pasteur pipette to add 0.7 mL of the diluted starting material into a clean 5 mm NMR tube, filling the bottom 4.5–5 cm. Cap the NMR tube and label it. Gently shake the tube, taking care to avoid contact between the sample and the cap. Then, insert the tube into the spinner.
Clean the outside of tube and spinner using 2-propanol and lab tissues. Then place the sample assembly into the depth gauge and calibrate the insertion depth.
After calibration, load the sample assembly into the NMR spectrometer either manually or using an auto-sampler. Finally, use a computer workstation to acquire the NMR spectrum.
Generate NMR spectra using this procedure for each of the reaction’s starting materials. For the synthesis of chalcone, spectra should be generated for both methoxybenzaldehyde and methylacetophenone.
Next, perform the sample synthesis by combining the starting materials and reagents in a flask to begin the reaction.
At 30 min intervals, remove a small aliquot of the reaction mixture using a Pasteur pipette and add 3 drops to a clean NMR tube.
Dilute this crude reaction product with deuterated solvent, and prepare for NMR using the previously described procedure.
As the reaction progresses, a yellow precipitate will form. When the reaction is complete, wash and filter the precipitate and generate NMR spectra for the purified reaction product.
Now that we’ve generated NMR spectra at each stage of the chemical reaction, let’s analyze them.
The peaks of the NMR spectra for each of the starting materials are assigned to different proton groups within the molecule according to their chemical shifts and the number of protons contributing to each peak. Here, we assign the 4 major proton groups for methylacetophenone and methoxybenzaldehyde, noting the aldehyde peak between 9.5 and 10.5 ppm. By comparing the NMR spectra of the crude reaction products at different time-points, the evolution of the chemical reaction that synthesizes chalcone is elucidated. For example, the aldehyde peak from the starting material methoxybenzaldehyde is still present after 30 min of reaction, but is completely gone after 3 h, signifying the completion of the reaction.
By examining the spectrum of the purified product we can assign each peak to a proton group in chalcone’s structure. For example, examining peaks 3 and 4 we see their integrals are both one, corresponding to groups containing just one proton.
Peaks 3 and 4 are so called doublets indicating one neighboring proton. Both have J-coupling constants of 16 Hz, suggesting that the protons are situated across an E-double bond. By assigning all of the NMR peaks of the purified reaction product, we confirm the synthesis of a pure chalcone.
NMR spectroscopy has a wide range of applications and is used in many scientific and medical fields.
In this application, proton NMR is used to verify the synthesis and structure of both diamidocarbene and mononoamidocarbine, whose NMR spectra have different peak-splitting patterns. These carbenes also generated seemingly different reaction products when combined with white phosphorus; DAC1 generated a bright red reaction product, whereas MAAC2 produced a bright orange product. These differences in reaction products were confirmed using a second application of NMR, 31P NMR, which generates spectra based on differences in the resonant frequency of phosphorus nuclei.
Here, nuclear magnetic resonance imaging, or MRI, was used to generate an anatomical map of the brain and to select the brain regions of interest. Then NMR spectroscopy was used to generate spectra of key metabolites. Finally, using MRI changes in brain metabolism in different experimental conditions were evaluated.
In this application, NMR was used to analyze the binding properties and propose a 3D structure of a copper-binding peptide. First, NMR spectra were compared for the peptide’s unbound and copper-bound states. Then, using more advanced 2-dimensional NMR techniques, different potential conformations of the peptide’s structure were evaluated. Finally, these NMR-derived structural constraints were used to develop a proposed 3-Dimensional structure for the unbound peptide.
You’ve just watched JoVE’s introduction to NMR Analysis. You should now understand the underlying principles behind NMR spectra generation and analysis, as well as a procedure for NMR sample preparation.
Thanks for watching!