Quantification of Optic Nerve Cross Sectional Area on MRI: A Novel Protocol using Fiji Software
Summary
We provided a detailed protocol for a standardized method of optic nerve assessment and quantification using MRI, utilizing a widely available imaging sequence, and open access software for image analysis. Following this standardized protocol would provide meaningful data for comparison between different patients and different studies.
Abstract
Optic nerve assessment is an important aspect of glaucoma diagnosis and follow-up. This project describes a protocol for a unified methodology of optic nerve cross-sectional assessment and quantification using 3 T MRI for image acquisition and ImageJ’s Fiji software for image processing quantification. Image acquisition was performed using 3 T MRI, with proper instructions for the patient to ensure straight fixation during imaging. A T2-weighted fat suppressed sequence was used. A coronal cut taken 3 mm behind the globe and perpendicular to the optic nerve axis should be uploaded to the software. Using the threshold function, the white matter area of the optic nerve is selected and quantified, thus, eliminating inter-individual measurement bias. We also described the normal limits for the optic nerve cross-sectional area according to age, based on previously published literature. We used the described protocol to assess optic nerve of a suspected glaucoma patient. The optic nerve cross-sectional area was found to be within the normal limits, a finding further confirmed via optical coherence tomography of the optic nerve.
Introduction
Glaucoma is an optic neuropathy that is considered to be the most common cause of irreversible blindness1. Despite that, it is still poorly understood in terms of its pathophysiology and diagnosis, with no single standard reference for establishing the diagnosis2. According to the National Institute for Health and Care Excellence (NICE) the diagnosis of primary open-angle glaucoma (POAG) requires the assessment of multiple domains, including optic disc assessment on fundus exam or optical coherence tomography (OCT) imaging, visual field assessment, and intraocular pressure measurement 3. The idea behind diagnosing glaucoma is establishing the presence of progressing optic neuropathy, which can be done quantitively on OCT4. In this regard, MRI can also be used for optic nerve assessment and quantification of its white matter area5, but for this to be clinically meaningful, the protocol used in optic nerve white matter quantification needs to be standardized. Moreover, a protocol should also accommodate inter-individual variation, a factor that might affect accuracy in different diseases6.
Optic nerve assessment in glaucoma is optimally assessed via ophthalmic imaging, including OCT, where the most anterior part of optic nerve (e.g., optic disc) is assessed. On the other hand, the use of MRI for optic nerve assessment usually assesses the retrobulbar part of optic nerve at various distances from globe. Several studies found a strong correlation between optic disc assessment using OCT and MRI7,8. However, there is still no unified protocol for optic nerve assessment and quantification on MRI. Outlining the optic nerve border on MRI has been used to quantify its cross-sectional area5. However, this method has considerable inter-rater variability, as it needs to be done by an experienced rater and requires considerable time for outlining. The aim of the current project was to provide a protocol for a unified methodology for optic nerve cross sectional assessment and quantification using 3 T MRI for image acquisition and ImageJ's Fiji software for image processing and quantification.
Protocol
The following study was approved by the research committee and institutional review board of the University of Jordan Hospital. The following protocol will describe the imaging technique used to acquire MRI images, followed by image processing and optic nerve quantification using Fiji software.
1. MRI image acquisition
NOTE: MR image acquisition was done using a 3 Tesla (3 T) MRI to perform multiplanar T2-weighted fat suppression sequence (Table of Materials).
- Fully explain the examination to the patient. The following include instructions and explanations that need to be mentioned to the patient.
- Explain to the patient that they will need to change clothes and wear a special gown for imaging.
- Have patients remove any worn eyeliner as it can produce artifacts (especially at 3 T) due to electrical conductivity of the titanium oxide pigment.
- Ensure that the patient does not have any contraindications to perform MRI imaging9:
- Ask the patient about any metallic materials, which might include face masks, piercings, artificial limbs, magnetic dental implants, cerebral artery aneurysm clips.
- Ask the patient about metallic intraocular foreign bodies. For this, ask the patient if they have welded without proper protective gear.
- Ask the patient about any implantable devices might be incompatible with MRI, including pacemakers and insulin pumps, analgesic drugs, or chemotherapy pumps. In addition to this, cochlear implants/ear implant, Implantable neurostimulation systems, Implantable neurostimulation systems, Catheters with metallic components, are all contraindicated.
- Ask the patient about metallic foreign body left inside their body. This includes bullets, shotgun pellets, and metal shrapnel
- Ask the patient about any surgical clips or wire sutures, joint replacement or prosthesis, inferior vena cava (IVC) filter, ocular prosthesis, stents, or intrauterine device.
- Ask the patient if they have gotten a tattoo in the last 6 weeks.
- Ask the patient if they have undergone a colonoscopy procedure in the last eight weeks.
- Due to the confined space of the MRI machine, ask the patient if they have claustrophobia.
NOTE: Difficulty might be found with patients having high body mass index (BMI).
- Explain to the patient that the exam is expected to take 15 minutes, where the patient needs to stay still.
- After completing the instructions and making sure the patient fully comprehends the exam, obtain a signed consent.
- During MRI image acquisition, lay the patient supine in the MRI machine, and fixate on a straight target during imaging without any head movement. For patients with poor visual acuity, use a sound stimulus to optimize fixation. More comprehensive methods for fixation involve shutting one eye, use of a fixation target centrally in the form of an LCD screen that changes colors, and use of ocular lubricants.
- Ensure that the patient is aware that there is a squeeze button that can be pressed if they need anything while in the MRI machine. While a head coil can be used, an eye coil and an orbital coil may be more suited for ophthalmic imaging.
- Input the following parameters for image acquisition: A T2-weighted fat suppression sequence (TR = 3000 milliseconds; TE = 90 milliseconds; TE = 100; field of view = 16 cm×16 cm; matrix = 296*384; slice thickness = 3 mm; slice gap = 0.3 mm). The final image analyzed was an oblique coronal image 3 mm behind the globe. It is important to note that while T2-weighted fat suppression sequence is generally used for optic nerve imaging, other sequences can be used, including T2 fast spin echo imaging.
- Take a coronal cut of the optic nerve orthogonal (i.e., perpendicular) to the nerve 3 mm posterior to the globe. Use scout images in the transversal and oblique sagittal planes to ensure optimal optic nerve direction and optic nerve-globe junction positioning.
- Assess the quality of gaze fixation by CSF distribution around the optic nerve, where it should be uniformly distributed around the optic nerve with almost equal thickness at all sides.
- Repeat the process to image the optic nerve for the other side.
2. Image analysis
- Download Fiji image processing package from (https://imagej.net/Fiji).
- Upload the coronal image of optic nerve to ImageJ Fiji software for analysis by clicking File from the menu bar, followed by Open button. Choose the coronal image to be processed. Transfer the images to Fiji software without losing image quality during transfer, as image quality loss will lead to unreliable image analysis results.
- Standardize the scale by specifying the number of pixels per a unit of length by drawing a straight line on the map scale. Then choose Set Scale from the Analyze menu bar. Specify the length of the line as appears on the map scale with the proper unite of length (i.e., mostly mm).
- Convert the image into a grayscale using the image menu, and then choosing Type and 8-bit.
- Quantify the range of intensity of white matter pixels.
- Using the Lasso selection tool (Plugin | Segmentation | Lasso tool), select a sufficient area of white matter, making sure not to include gray matter area during selection. We found that a total selected white matter area of around 1000 pixels is enough. Use Analyze and Measure tool to quantify the selected area.
- Show the Histogram tool from Analyze menu, which shows the distribution of pixels intensity in the white matter area selected. Click on the Live box to make sure the histogram assesses the selected area. The graph on the histogram should show a normal distribution of intensity.
- Calculate white matter intensity range as follows:
Lower limit = mean intensity – (3* standard deviation)
Upper limit = mean intensity + (3* standard deviation) - Open the Threshold tool from Image menu, followed by the Adjust function. Specify the range calculated from the previous step. Tick only dark background function and specify black and white annotation B&W from drop list, then click apply. The mask for white matter present within the optic disc will appear.
- Using the Lasso selection tool (Plugin | Segmentation | Lasso tool), select the black area representing the optic disc.
- Use the Measure function from the Analyze menu bar, which will calculate the area marked by the threshold function in mm.
Representative Results
The cup to disc ratio for a 30-year-old male patient presenting for a checkup ophthalmology exam was 0.8 (Figure 1A), which is suspicious and might be suggestive of glaucoma. Upon performing an optical coherence tomography for nerve fiber layer thickness, we found that the nerve thickness was within the normal limits for age (Figure 1B). The patient was scheduled for an orbit MRI, where a coronal cut for optic nerve assessment was ordered and performed as per the abovementioned protocol.
We obtained a coronal MRI cut, 3 mm behind the optic disc. The white matter mean intensity was 94.372 (SD 7.085), which resulted in white matter intensity range of:
Lower limit = 94.372 – 21.255 = 73.117
Upper limit = 94.372 + 21.255 = 115.627
Figure 2 shows the coronal image (Figure 2A), the coronal image after applying the white matter threshold using the calculated upper and lower limits (Figure 2B), and the optic nerve white matter for quantification (Figure 2C). The cross-sectional area for the white matter of the left optic nerve was 6.9 mm2 (0.069 cm2), which is within the normal limits for his age, as shown in Table 1.
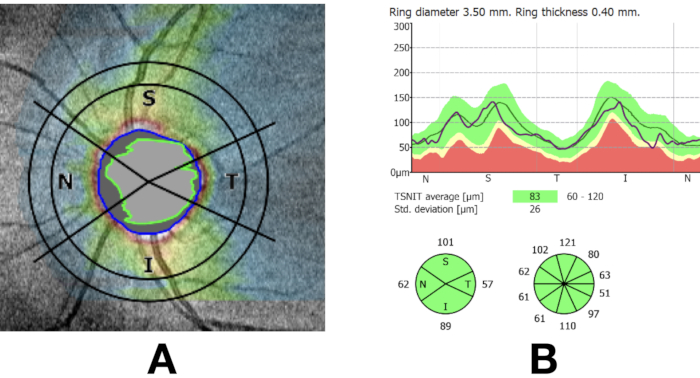
Figure 1: Fundus image showing high cup to disc ratio, which might be suggestive of glaucoma (A). An optical coherence tomography for the nerve fiber layer (NFL) showing a within normal limits NFL (B). Please click here to view a larger version of this figure.
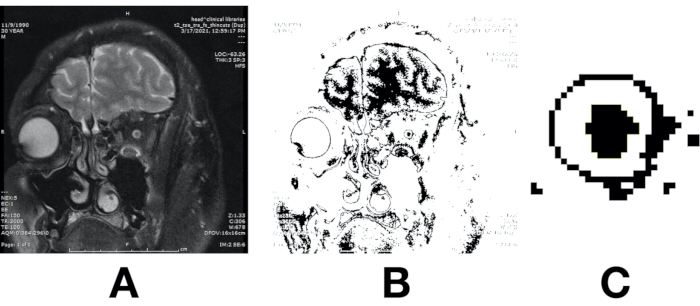
Figure 2: Coronal T2 -weighted fat suppressed MRI image obtained perpendicular to the optic nerve 3 mm behind the optic disc (A). The same coronal cut after applying a pre-calculated threshold range (B). Optic nerve white matter (C). Please click here to view a larger version of this figure.
| Study | Sample size | Age (Years) | Mean cross sectional area (mm2) | Imaging sequence |
| Bäuerle, 2013. 10 | 15 | Mean (SD) 24.5 ± 0.8 | 5.69 ± 0.77 | T2-weighted turbo spin echo (TSE) sequence |
| Wang 2012. 11 | 21 | Mean (SD) 51.6±12.0 | 5.03 ± 0.35 | T2-weighted fast recovery fast spin echo (FRFSE) sequence |
| Weigel, 2006. 12 | 32 | Mean (range) 25 (22–39) | 5.7 ± 0.6 | T2-weighted turbo spin echo (TSE) sequence |
| Yiannakas, 2013. 13 | 8 | Mean (range) 31 (29–33) | 6.2 (1.3) | T2-fat-suppressed |
| Al-Haddad, 2018. 14 | 211 | Median (interquartile) 8.6 (3.9–13.3) | 4.0 ± 0.20 * | T1-weighted inversion recovery sequence |
| *Calculated using the provided optic nerve diameter. | ||||
Table 1 shows the normal range of optic nerve cross sectional diameter using MRI 3mm from globe, as found by previous studies.
Discussion
We described a protocol to assess and quantify optic nerve white matter that might be used for glaucoma patient assessment. The protocol uses widely available imaging sequences for image acquisition, and it uses the open-source Fiji software for image analysis. We standardized the image parameters that were previously found to be most accurate and highly reproducible in optic nerve image acquisition, including asking the patient to fixate straight ahead, using T2 with fat suppression sequence, and capturing the cross-sectional area 3 mm behind the globe. In addition, we described a detailed image analysis method that eliminates manual segmentation and corrects for signal variability between patients. The importance of this protocol is that it eliminates the variation in region of interest (ROI) segmentation by the radiologist, which is usually the main source of error in optic nerve assessment on MRI12. While we tried to provide normative data for optic nerve cross sectional area with Table 1, further data using the standard protocol described is needed for the use and comparison in clinical settings. Such data need to accommodate different age groups due to the age variation in optic nerve size, as shown in Table 1. Such variation is not evident between genders15, but was recently suggested to be present for refractive error16.
Previous studies applied different methodologies for optic nerve white matter quantification, and they mostly used the software present in their workstation for image analysis. Initial studies on optic nerve assessment adopted a quantification approach based on cross sectional area, using manual segmentation by technicians or radiologists12,17. Wang et al. also used manual segmentation of optic nerve cross-sectional area at different distances from the globe for correlation with OCT 11. Omodaka et al. used the average cross-sectional area on the coronal cut and the length of the optic nerve from the disc to the optic chiasm on the axial cut through manual annotation to extract indicators of the optic nerve for correlation with OCT8. Despite being correlated with OCT, reproducibility of this method might not yield the required accuracy for longitudinal assessment of optic nerve. Ramli et al. quantified the volume of the optic nerve through manual segmentation of the isointense signal at all axial sections 5, an approach that might miss the optic nerve matter not captured by the axial sections themselves, human error during image manual segmentation, or even in the determination of the optic nerve length to be included in the quantification assessment.
While different studies used the assessment of the cross-sectional area of the optic nerve, they differed in the distance of measurements from globe. Wang et al. assessed 3 mm, 9 mm, and 15 mm behind the globe, and found that the 3 mm cross-sectional assessment had the highest correlation with intraocular pressure11. Bäuerle et al. analyzed the reproducibility of assessment of the optic nerve on MRI at 3 mm and 5 mm behind the globe, and they found a good assessment for both cases10. Lagrèze et al. measured the cross-sectional area 5 mm, 10 mm, and 15 mm behind the globe and found that the cross-sectional assessment was most accurate in the 5 mm cross sectional area compared to measurements further from the globe17. In this protocol, we used a 3 T MRI for images acquisition, where its use in optic nerve assessment was previously found to be superior to 1.5 T MRI18,19. The increasingly utilized 7 T MRI might also provide superior results but will also require its normative values. Regarding MRI sequence used, we used T2 fat suppression sequence, mainly due to its wide availability and its inherent ability to delineate the optic nerve surrounding CSF after eliminating the surrounding intraconal fat. Previous studies used other sequences with reliable results, including the half-Fourier single-shot turbo spin-echo (HASTE) sequence and Diffusion Tensor Imaging (DTI) sequence7,12, which might not be widely available.
An important aspect to consider during image acquisition is making sure that the patient is fixating on a straight target, as fixating on a non-straight target during imaging will yield a non-accurate optic nerve quantification12. Fixation in OCT is monocular on a close target, requiring the patient to have good visual acuity in the eye to be assessed to see the near target with one eye, whereas for MRI the target is further away, the fixation is binocular, and requires fewer visual demands. However, fixation might still be an issue for patients who have high refractive error or poor vision. While the use of MRI to assess and follow patients with glaucoma might not be feasible in the presence of low cost, simpler imaging techniques, including the OCT, MRI can be useful in special situations where OCT do not provide conclusive data, or OCT itself cannot be obtained, such as in the presence of significant ocular medial opacity. Furthermore, the described protocol can be used when MRI imaging is warranted in cases of unexplained optic neuropathy to exclude secondary causes20,21.
One of the main limitations of this protocol is the inability to assess patients who cannot properly fixate, including patients with poor visual acuity in both eyes. In this regard, the use of sound stimulus will improve the quality of fixation during image acquisition22. Moreover, as a new methodology, future studies are needed to depict normal values for MRI-based cross-sectional areas for optic nerve white matter. The importance of establishing normal values is further stressed by the fact that optic nerve is also composed of significant amount of connective tissue23, a tissue that does not have similar functional abilities as nerve fibers. While quantification of optic nerve fiber layer thickness in OCT might provide a false impression of remanent nerve tissue due to the inclusion of connective tissue in the quantification process24, such a false impression is not present in this MRI-based quantification method. Motion artifacts might also lead to blur in images, especially upon eye movement during exam. While it should be avoided during imaging, establishing white matter range will reduce the impact of such artifacts on the accuracy of optic nerve white matter quantification, as the changes caused by the motion artifact on cerebral white matter is almost like the optic nerve's white matter.
The main strength of the current protocol is the elimination of inter-individual differences during optic nerve quantification, even when performed by non-specialized medical doctors or technicians. In addition, it used a widely available open-source software for image analysis. While it is not feasible to do a dedicated MRI imaging for optic nerve quantification, especially in the presence of the OCT, it is recommended to perform this protocol during MRI imaging done for other purposes, including the exclusion of secondary causes of optic neuropathy and glaucoma.
Disclosures
The authors have nothing to disclose.
Acknowledgements
We would like to thank Faris Haddad and Hasan El-Isa for their important contribution in video filming and development.
Materials
| Magnetic resonance imaging (MRI) machine | Siemens Magnetom Verio | N/A | 3T MRI scanner |
References
- Quigley, H. A., Broman, A. T. The number of people with glaucoma worldwide in 2010 and 2020. The British Journal of Ophthalmology. 90 (3), 262-267 (2006).
- Weinreb, R. N., Aung, T., Medeiros, F. A. The pathophysiology and treatment of glaucoma: a review. JAMA. 311 (18), 1901-1911 (2014).
- . Overview | Glaucoma: diagnosis and management | Guidance | NICE Available from: https://www.nice.org.uk/guidance/ng81 (2021)
- Michelessi, M., et al. Optic nerve head and fibre layer imaging for diagnosing glaucoma. The Cochrane Database of Systematic Reviews. (11), 008803 (2015).
- Ramli, N. M., et al. Novel use of 3T MRI in assessment of optic nerve volume in glaucoma. Graefe’s Archive for Clinical and Experimental Ophthalmology. 252 (6), 995-1000 (2014).
- AlRyalat, S. A., Muhtaseb, R., Alshammari, T. Simulating a colour-blind ophthalmologist for diagnosing and staging diabetic retinopathy. Eye. , 1-4 (2020).
- Chang, S. T., et al. Optic Nerve Diffusion Tensor Imaging Parameters and Their Correlation With Optic Disc Topography and Disease Severity in Adult Glaucoma Patients and Controls. Journal of Glaucoma. 23 (8), 513-520 (2014).
- Omodaka, K., et al. Correlation of magnetic resonance imaging optic nerve parameters to optical coherence tomography and the visual field in glaucoma. Clinical & Experimental Ophthalmology. 42 (4), 360-368 (2014).
- Ghadimi, M., Sapra, A. Magnetic Resonance Imaging Contraindications. StatPearls. , (2021).
- Bäuerle, J., Schuchardt, F., Schroeder, L., Egger, K., Weigel, M., Harloff, A. Reproducibility and accuracy of optic nerve sheath diameter assessment using ultrasound compared to magnetic resonance imaging. BMC Neurology. 13 (1), 187 (2013).
- Wang, N., et al. Orbital Cerebrospinal Fluid Space in Glaucoma: The Beijing Intracranial and Intraocular Pressure (iCOP) Study. Ophthalmology. 119 (10), 2065-2073 (2012).
- Weigel, M., Lagrèze, W. A., Lazzaro, A., Hennig, J., Bley, T. A. Fast and Quantitative High-Resolution Magnetic Resonance Imaging of the Optic Nerve at 3.0 Tesla. Investigative Radiology. 41 (2), 83-86 (2006).
- Yiannakas, M. C., Toosy, A. T., Raftopoulos, R. E., Kapoor, R., Miller, D. H., Wheeler-Kingshott, C. A. M. MRI Acquisition and Analysis Protocol for In Vivo Intraorbital Optic Nerve Segmentation at 3T. Investigative Ophthalmology & Visual Science. 54 (6), 4235-4240 (2013).
- Al-Haddad, C. E., et al. Optic Nerve Measurement on MRI in the Pediatric Population: Normative Values and Correlations. American Journal of Neuroradiology. 39 (2), 369-374 (2018).
- Mncube, S. S., Goodier, M. Normal measurements of the optic nerve, optic nerve sheath and optic chiasm in the adult population. South African Journal of Radiology. 23 (1), 7 (2019).
- Nguyen, B. N., et al. Ultra-High Field Magnetic Resonance Imaging of the Retrobulbar Optic Nerve, Subarachnoid Space, and Optic Nerve Sheath in Emmetropic and Myopic Eyes. Translational Vision Science & Technology. 10 (2), (2021).
- Lagrèze, W. A., et al. Retrobulbar Optic Nerve Diameter Measured by High-Speed Magnetic Resonance Imaging as a Biomarker for Axonal Loss in Glaucomatous Optic Atrophy. Investigative Ophthalmology & Visual Science. 50 (9), 4223-4228 (2009).
- Nielsen, K., et al. Magnetic Resonance Imaging at 3.0 Tesla Detects More Lesions in Acute Optic Neuritis Than at 1.5 Tesla. Investigative Radiology. 41 (2), 76-82 (2006).
- Mafee, M. F., Rapoport, M., Karimi, A., Ansari, S. A., Shah, J. Orbital and ocular imaging using 3- and 1.5-T MR imaging systems. Neuroimaging Clinics of North America. 15 (1), 1-21 (2005).
- Gala, F. Magnetic resonance imaging of optic nerve. The Indian Journal of Radiology & Imaging. 25 (4), 421-438 (2015).
- Gao, K., et al. Optic Nerve Cross-Sectional Area Measurement with High-Resolution, Isotropic MRI in Optic Neuritis (P6.159). Neurology. 84 (14), (2015).
- Zou, H., Müller, H. J., Shi, Z. Non-spatial sounds regulate eye movements and enhance visual search. Journal of Vision. 12 (5), 2 (2012).
- Yang, H., et al. The Connective Tissue Components of Optic Nerve Head Cupping in Monkey Experimental Glaucoma Part 1: Global Change. Investigative Ophthalmology & Visual Science. 56 (13), 7661-7678 (2015).
- Mwanza, J. -. C., et al. Retinal nerve fibre layer thickness floor and corresponding functional loss in glaucoma. The British Journal of Ophthalmology. 99 (6), 732-737 (2015).
