We present a protocol to directly visualize metabolic activities in cells regulated by amino acids using deuterium-oxide (heavy water D2O) probed stimulated Raman scattering (DO-SRS) microscopy, which is integrated with two-photon excitation fluorescence microscopy (2PEF).
Essential aromatic amino acids (AAAs) are building blocks for synthesizing new biomasses in cells and sustaining normal biological functions. For example, an abundant supply of AAAs is important for cancer cells to maintain their rapid growth and division. With this, there is a rising demand for a highly specific, noninvasive imaging approach with minimal sample preparation to directly visualize how cells harness AAAs for their metabolism in situ. Here, we develop an optical imaging platform that combines deuterium oxide (D2O) probing with stimulated Raman scattering (DO-SRS) and integrates DO-SRS with two-photon excitation fluorescence (2PEF) into a single microscope to directly visualize the metabolic activities of HeLa cells under AAA regulation. Collectively, the DO-SRS platform provides high spatial resolution and specificity of newly synthesized proteins and lipids in single HeLa cell units. In addition, the 2PEF modality can detect autofluorescence signals of nicotinamide adenine dinucleotide (NADH) and Flavin in a label-free manner. The imaging system described here is compatible with both in vitro and in vivo models, which is flexible for various experiments. The general workflow of this protocol includes cell culture, culture media preparation, cell synchronization, cell fixation, and sample imaging with DO-SRS and 2PEF modalities.
Being essential aromatic amino acids (AAAs), phenylalanine (Phe) and tryptophan (Tryp) can be absorbed by the human body to synthesize new molecules for sustaining normal biological functions1. Phe is needed for the synthesis of proteins, melanin, and tyrosine, while Tryp is required for the synthesis of melatonin, serotonin, and niacin2,3. However, excess consumption of these AAAs can upregulate the mammalian target of the rapamycin (mTOR) pathway, inhibit AMP-activated protein kinase, and interfere with the mitochondrial metabolism, collectively altering macromolecule biosynthesis and leading to the production of malignant precursors, such as reactive oxygen species (ROS) in healthy cells4,5,6. Direct visualization of altered metabolic dynamics under excess AAA regulation is essential to understand AAAs' roles in promoting cancer development and the growth of healthy cells7,8,9.
Traditional AAA studies rely on gas chromatography (GC)10. Other methods, such as magnetic resonance imaging (MRI), have limited spatial resolutions, making it hard to perform cellular and sub-cellular analysis of biological samples11. Recently, matrix-assisted laser desorption/ionization (MALDI) has been developed to elucidate the role of AAAs in lipid and protein syntheses in cancer proliferation with noninvasive biomarkers12,13,14. However, this technique still suffers from shallow imaging depths, poor spatial resolution, and extensive sample preparation. At the cellular level, nontoxic stable isotopes, such as nitrogen-15 and carbon-13, can be traced with multi-isotope imaging and nanoscale secondary ion mass spectrometry to understand their incorporation into macromolecules. However, these methods are destructive to living biological samples15,16. Atomic force microscopy (AFM) is another powerful technique that can visualize metabolic dynamics17. The slow rate of scanning during AFM imaging, on the other hand, may cause image distortion of the result from thermal drift.
We developed a noninvasive biorthogonal imaging modality by coupling deuterium-oxide (D2O) probed stimulated Raman scattering (DO-SRS) microscopy and label-free two-photon excitation fluorescence microscopy (2PEF). This modality achieves a high spatial resolution and chemical specificity when imaging biological samples18,19,20,21,22,23,24. This protocol introduces the applications of DO-SRS and 2PEF to examine the metabolic dynamics of lipids, protein, and redox ratio changes during cancer progressions. With D2O being a stable isotope form of water, cellular biomolecules can be labeled with deuterium (D) due to its quick compensation with total body water in cells, forming carbon-deuterium (C-D) bonds through enzymatic exchange21. The C-D bonds in newly synthesized macromolecules, including lipids, proteins, DNA/RNA, and carbohydrates, can be detected in the cell silent region of the Raman spectrum20,21,22,25,26,27. With two synchronized laser pulses, C-D bonds of newly synthesized lipids and proteins can be displayed on single cells via hyperspectral imaging (HSI) without extracting or labeling them with cytotoxic agents. In addition, SRS microscopy has the capability to construct three-dimensional (3D) models of selected regions of interest in biological samples by capturing and combining a set of cross-sectional images22,26. With hyperspectral and 3D volumetric imaging, DO-SRS can obtain spatial distributions of newly synthesized macromolecules in single cells, along with the type of organelles that facilitate the process of promoting cancer growth under AAA regulation22. Furthermore, using 2PEF, we can obtain autofluorescence signals of Flavin and nicotinamide adenine dinucleotide (NADH) with high resolution, deep penetration depth, and low-level damage in biological samples21,23,24. Flavin and NADH autofluorescence signals have been used to characterize redox homeostasis and lipid peroxidation in cancer cells22,26. As such, not only does the coupling of DO-SRS and 2PEF provide subcellular analysis of AAA-regulated metabolic dynamics in cancer cells with high spatial distribution, chemical specificity information, and minimal sample preparation, but the method also reduces the need to extract or label endogenous molecules with toxic reagents. In this protocol, we first present the procedures of D2O and amino acid preparation, as well as cancer cell culture. Then, we show the protocols of DO-SRS imaging and 2PEF imaging. Finally, we present the representative results of SRS and 2PEF imaging, which demonstrate AAA-regulated metabolic changes of lipids and protein, and redox ratio changes in cancer cells. A detailed illustration of the process is highlighted in Figure 1.
1. Media preparation
2. Cell sample preparation
3. Spontaneous Raman spectroscopy measurement (Figure 2)
4. Imaging experiments with 2PEF and SRS
NOTE: Detailed descriptions of SRS laser alignment can be found in a prior report28. This protocol focuses on the operation of a multimodal SRS and 2PEF imaging system (Figure 2C, D).
5. Spectra and image analysis
The addition of excess AAAs at 15x concentrations to the 50% D2O-containing cell culture media produced distinct C-D Raman bands of newly synthesized lipids and proteins in HeLa cells (Figure 2B). Previous experiments were performed with different concentration levels, such as 2x and 5x, and although the data is not presented, the 15x concentration produced the most distinct C-D Raman bands of newly synthesized lipids and proteins. Specifically, by investigating lipid droplets (LDs), we noticed that both 15x Phe and 15x Tryp induced newly synthesized lipids and protein signals at 2,143 cm-1 and 2,172 cm-1, respectively. DO-SRS was subsequently used to visualize the spatial distribution of C-D signals on single cells (Figure 3). Using ImageJ, pixel intensities of individual cells were manually segmented and calculated, as indicated by dotted-white borders in Figure 3A. The control cells display moderate C-D lipid and protein bands; however, the 15x Phe and 15x Tryp display stronger C-D lipid and protein bands. Quantitative analysis indicates that excess AAAs may upregulate lipid synthesis by 10%-17% but downregulate protein synthesis by 10% (Figure 3C,D). The results infer the possibility of a lack of autophagy that accumulates newly synthesized lipids, promotes mitochondrial dysfunction, and induces oxidative imbalance under excess AAA regulation7.
Label-free multimodal SRS and 2PEF imaging of unsaturated lipid (~3,011 cm-1), saturated lipid (~2,880 cm-1), and NADH, Flavin were acquired to understand the effects of AAAs on cancer metabolism. Similarly, pixel intensities of individual cells were manually segmented and calculated using ImageJ, as indicated by dotted-white borders in Figure 3B. Ratiometric analysis of AAA-treated cells displays a 10% increase in unsaturated lipid/saturated lipid and a 50% increase in Flavin/Flavin + NADH (Figure 3E,F). In the electron transport chain of mitochondria, ROS can be generated from the transfer of electrons from NADH and FADH2 to molecular oxygen species. The accumulation of ROS in many cancer cells results in an oxidative imbalance that oxidizes unsaturated fatty acids, promotes saturated fatty acid synthesis, and depletes NADH autofluorescence signals. Therefore, the observed increase in Flavin/Flavin + NADH is an indicator of accumulated ROS that reduces NADH autofluorescence signals. In response to oxidative imbalance, HeLa cells may upregulate their unsaturated lipid synthesis to replace the oxidized ones. This response is not observed in other cancer cell lines29, which signifies the metabolic heterogeneity of cancer cells under an excess AAA diet30.
In addition to multimodal imaging, SRS can reconstruct label-free 3D images of LDs in control and AAA-treated HeLa cells. In brief, microscopy generates a set of cross-sectional images throughout a selected region of interest. In this study, the stimulated Raman loss (SRL) was tuned to 2,845 cm-1 and scanned from the top layer to the bottom layer with a step size of 1 µm (Figure 4A). Quantitative analyses of 3D lipid droplets reveal that LDs reduced in size but increased in counts in AAA-treated cells compared to the control (Figure 4B,C). The increased presence of bulky hydrophobic amino acids, such as Tryp and Phe may impair the function of LD-coating proteins. This ultimately reduces lipolysis, which accumulates numerous small LDs. The label-free 3D SRS volumetric imaging results of this study corroborate with previous studies by visualizing that excess AAA-treated cells exhibit numerous smaller LDs31,32.
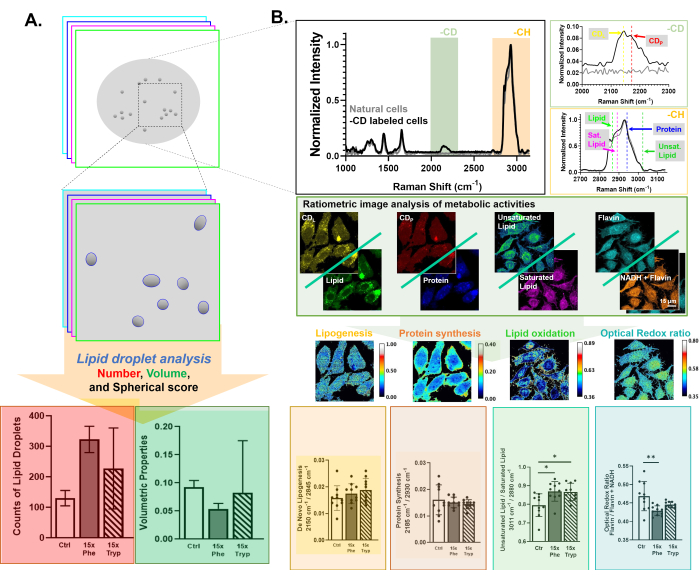
Figure 1: An illustration of the image acquisition and analysis with DO-SRS and 2PEF. (A) A 3D image reconstruction and analysis to acquire lipid droplet number, volume, and spherical score. (B) Hyperspectral imaging and analysis of deuterium-labeled lipid (CDL; 2,145 cm-1), lipid (2,845 cm-1), deuterium-labeled protein (CDP; 2,175 cm-1), protein (2,940 cm-1), unsaturated lipid (3,011cm-1), saturated lipid (2,880 cm-1), NADH, and Flavin. Please click here to view a larger version of this figure.
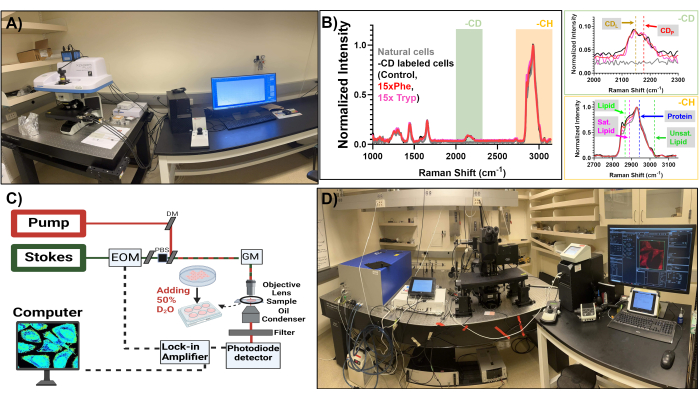
Figure 2: Physical setup of spontaneous Raman spectroscopy and stimulated Raman scattering microscopy. (A) Spontaneous Raman spectroscopy setup used for this study. (B) Sample spontaneous Raman spectra for CD label (red), without CD label (black), control group (blue, solid line), 15x Phe-treated group (red, dotted line), and 15x Tryp-treated group (pink, dotted line). (C) Schematic diagram of the stimulated Raman scattering microscopy setup used for this investigation. (D) Stimulated Raman scattering microscopy setup used as the DO-SRS and 2PEF platform. Please click here to view a larger version of this figure.
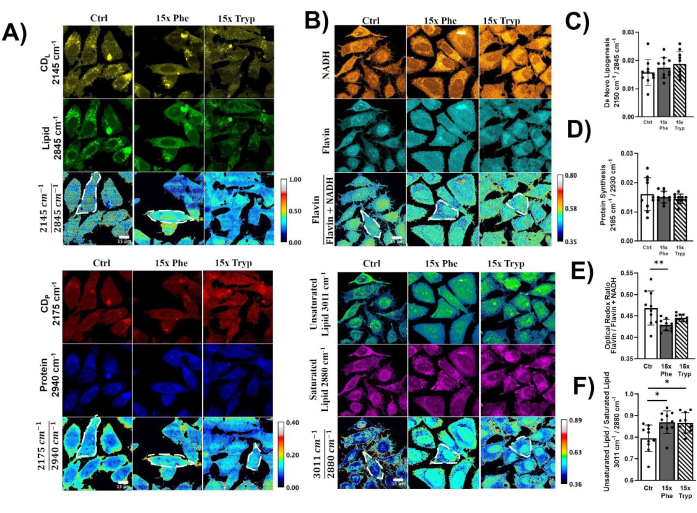
Figure 3: Visualizing metabolic dynamics in HeLa cells using DO-SRS and 2PEF microscopy. (A) Deuterium-labeled lipid (2,145 cm-1), lipid (2,845 cm-1), deuterium-labeled protein (2,175 cm-1), protein (2,940 cm-1) visualized in HeLa cells under control (Ctrl), 15x phenylalanine (15x Phe), and 15x tryptophan (15x Tryp) with the DO-SRS platform. Lipid turnover rate and protein turnover rate were calculated as and . Raw images were first subtracted by the PBS signal to remove background intensity and masked to remove intensity outside of the cells using ImageJ. Pixel-wise division was performed for the ratiometric analysis. (B) NADH and Flavin channels visualized with 2PEF microscopy, and unsaturated lipid (3,011 cm-1) and saturated lipid (2,880 cm-1) visualized with label-free SRS microscopy. Optical redox ratio and saturation ratio were calculated with and . (C–F) Quantification of ratiometric intensities for each HeLa cell under control, 15x Phe, and 15x Tryp conditions. The statistical difference was used to compare excess AAA conditions with the control conditions. ****p < 0.0001, ***p < 0.001, **p < 0.01, *p < 0.05 were calculated from a two-way ANOVA test. Please click here to view a larger version of this figure.
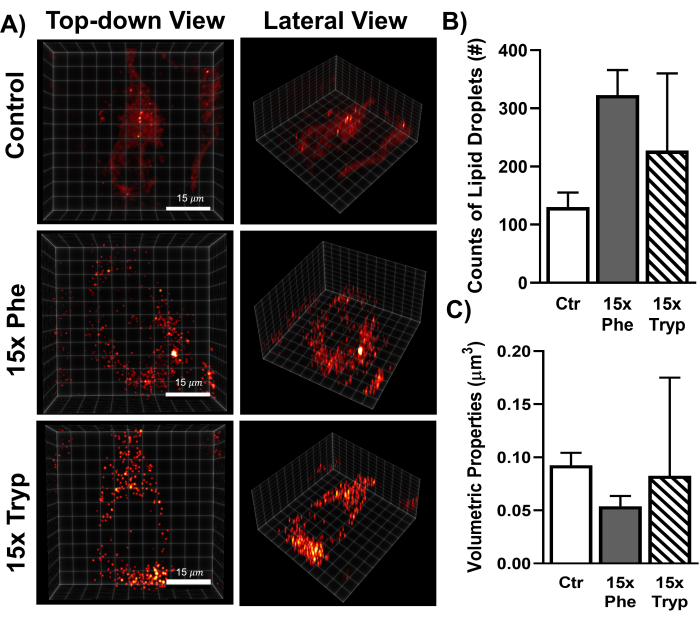
Figure 4: Visualization of 3D lipid droplet distribution of a single HeLa cell using a label-free SRS microscope. (A) SRS 3D lipid droplet volume projection in HeLa cells under control and excess AAA conditions. The threshold was defined prior to the analysis, revealing lipid droplet signal distribution. (B,C) Quantification of lipid droplet volume and counts within individual HeLa cells under control group and excess AAA conditions using the two-way ANOVA test. Please click here to view a larger version of this figure.
DO-SRS and 2PEF imaging have been applied to investigate metabolic dynamics in various ex vivo models, including Drosophila and human tissues21,22,23,24,26,27,33. The imaging modality used in this study integrates DO-SRS and 2PEF microscopy, which can outpace other molecule-specific imaging methods by eliminating the need for molecule extraction or labeling with cytotoxic reagents and requiring minimal sample preparation. Specifically, DO-SRS microscopy enables us to probe de novo lipogenesis and protein synthesis in animals and cells and visualize their metabolic dynamics in situ23,27,34. 2PEF captures the autofluorescence signals of naturally occurring biomolecules, such as Flavin and NADH, in biological samples35,36. The imaging penetration depth of SRS can achieve up to 200-500 µm in less scattering samples37. With tissue-clearing methods such as urea, the penetration depth can increase more than tenfold37. The coupling of SRS with 2PEF enables us to image endogenous fluorophores such as Flavin and NADH in biological samples, which further eliminates the need for exogenous biomarkers for detection. 2PEF can achieve a penetration depth of 500 µm38. Compared to other multiplex imaging modalities, such as multi-color single-photon confocal fluorescence microscopy, both DO-SRS and 2PEF can achieve a significantly larger penetration depth without cytotoxic exogenous biomarkers.
To increase the spatial resolution of DO-SRS and 2PEF, we developed an adaptive moment estimation (Adam)-based pointillism deconvolution (A-PoD) image post-processing tool34. A-PoD can convert diffraction-limited DO-SRS and 2PEF images to super-resolved ones without the need for any hardware improvements. Additionally, the Raman spectrum contains many specific chemical vibration modes that can be harnessed to increase the number of detectable molecules. Taking this advantage, our lab has further generated a penalized reference matching (PRF) method to distinguish multiple lipid species in cell and tissue models36. These two technical developments open new avenues for studying biological processes in more detail at cellular and sub-cellular levels, which have been used to characterize metabolic changes in brain, cancer, and aging processes26,27,35.
One main limitation of this protocol is the concentration and time incubation of cellular samples with D2O to produce distinct, quantifiable C-D Raman bands. More robust, metabolically active cell lines, such as HeLa cells, can incorporate deuterium atoms into newly synthesized macromolecules at a faster rate than non-diseased mammalian cell lines, such as human embryonic kidney (HEK) cells, leading to various C-D intensities observed for the same concentration and time incubation with D2O in two different cell lines21. Furthermore, the administration of D2O at a concentration of 80% or above for 48 h may introduce toxicity to cellular samples. An optimization experiment to identify the optimal D2O concentration and time incubation is necessary to achieve desirable results.
A critical aspect of the protocol is the integration of DO-SRS and 2PEF imaging. Typically, DO-SRS and 2PEF modalities share the same picosecond excitation laser, as its narrow bandwidth can be optimized with SRS and 2PEF signals. Although our technology is homebuilt, this platform is commercially available39. Additional equipment, such as two synchronized laser pulses with a modulator, photodiode detector, a lock-in amplifier, and a scanning microscope's joint efforts are required to detect the Raman signal. D2O can be readily purchased from biotechnology vendors. Therefore, researchers can access this technology very easily.
The authors have nothing to disclose.
We thank Dr. Yajuan Li and Anthony Fung for their technical support, and the Fraley lab for the cell line. We acknowledge the start-up funds from UCSD, NIH U54CA132378, NIH 5R01NS111039, NIH R21NS125395, NIHU54DK134301, NIHU54 HL165443, and Hellman Fellow Award.
10 mL Serological Pipettes | Avantor (by VWR) | 75816-100 | https://us.vwr.com/store/product?keyword=75816-100 |
15 mL Conical Centrifuge Tube | VWR | 89039-664 | https://mms.mckesson.com/product/1001859/VWR-International-89039-664 |
16% Formaldehyde, Methanol-free | ThermoFisher Scientific | 28906 | https://www.thermofisher.com/order/catalog/product/28906 |
24-well plate | Fisherbrand | FB0112929 | https://www.fishersci.com/shop/products/24-well-tc-multidish-100-cs/FB012929#?keyword=FB012929 |
25 mm Syringe Filter, 2 μm PES | Foxx Life Sciences | 381-2216-OEM | https://www.foxxlifesciences.com/collections/pes-syringe-filters/products/381-2216-oem?variant=16274336003 |
460 nm Filter Cube | Olympus | OCT-ET460/50M32 | |
AC Adapters of the Power Supply for LD OBIS 6 Laser Remote | Olympus | Supply power to the laser | |
Band-pass Filter | KR Electronics | KR2724 | 8 MHz |
BNC 50 Ohm Terminator | Mini Circuits | STRM-50 | |
BNC Cable | Thorlabs | 2249-C | Coaxial Cable, BNC Male/Male |
Broadband Dielectric Mirror | Thorlabs | BB1-E03 | 750 – 1100 nm |
Centrifuge | |||
Condenser | Olympus | ||
Cover Glass | Corning | 2850-25 | https://ecatalog.corning.com/life-sciences/b2b/NL/en/Glassware/Cover-Glass/Corning%C2%AE-Square-%231%C2%BD-Cover-Glass/p/2850-25 |
DC power supply | TopWard | 6302D | |
Dichroic Mount | Thorlabs | KM100CL | |
Dimethyl Sulfoxide Cell Culture Reagent | mpbio | 196055 | https://www.mpbio.com/0219605525-dimethyl-sulfoxide-cf |
Dulbecco's Modified Eagle’s Medium without Methionine, Threonine, and Sodium Pyruvate | MilliporeSigma | 38210000 | https://www.usbio.net/media/D9800-22/dulbeccorsquos-mem-dmem-wsodium-bicarbonate-wo-methionine-threonine-sodium-pyruvate-powder With Sodium Bicarbonate and without Methionine, Threonine, and Sodium Pyruvate |
Dulbecco’s Modified Eagle’s Medium | Corning | MT10027CV | https://www.fishersci.com/shop/products/dmem-dulbecco-s-modified-eagle-s-medium-4/MT10027CV#:~:text=Dulbecco's%20Modified%20Eagle's%20Medium%20 |
FIJI ImageJ | ImageJ | Version 1.53t 24 August 2022 | https://imagej.net/software/fiji/downloads |
Heavy Water (Deuterium Oxide) | Cambridge Isotope Laboratories, Inc. | 7732-18-5 | https://shop.isotope.com/productdetails.aspx?itemno=DLM-4-1L |
Hela Cells | ATCC | CCL-2 | https://www.atcc.org/products/ccl-2 |
Hemocymeter | MilliporeSigma | Z359629-1EA | https://www.sigmaaldrich.com/US/en/product/sigma/z359629?gclid=Cj0KCQiA37KbBhDgARIsAI zce15A5FIy0WS7I6ec2KVk QPXVMEqlAnYis_bKB6P6lr SIZ-wAXOyAELIaAhhEEAL w_wcB&gclsrc=aw.ds |
High O.D. Bandpass Filter | Chroma Technology | ET890/220m | Filter the Stokes beam and transmit the pump beam |
HyClone Fetal Bovine Serum (FBS) | Cytiva | SH300880340 | https://www.fishersci.com/shop/products/hyclone-fetal-bovine-serum-u-s-standard-4/SH300880340 |
HyClone Trypsin 0.25% (1x) Solution | Cytiva | SH30042.02 | https://www.cytivalifesciences.com/en/us/shop/cell-culture-and-fermentation/reagents-and-supplements/cell-disassociation-reagents/hyclone-trypsin-protease-p-00445 |
Integrated SRS Laser System | Applied Physics & Electronics, Inc. | picoEMERALD | picoEMERALD provides an output pulse at 1031 nm with 6-ps pulse width and 80-MHz repetition rate, which serves as the Stokes beam. The frequency doubled beam at 532 nm is used to synchronously seed a picosecond optical parametric oscillator (OPO) to produce a mode-locked pulse train with five~6 ps pulse width (the idler beam of the OPO is blocked with an,interferometric filter). The output wavelength of the OPO is tunable from 720–950 nm, which serves as the pump beam. The intensity of the 1031 nm Stokes beam is modulated sinusoidally by a built-in EOM at 8 MHz with a modulation depth of more than 90%. The pump beam is spatially overlapped with the Stokes beam by using a dichroic mirror inside picoEMERALD. The temporal overlap between pump and Stokes pulses are achieved with a built-in delay stage and optimized by the SRS signal of pure D2O at the microscope. |
Inverted Laser-scanning Microscope | Olympus | FV1200MPE | |
IX3-CBH Control box | Olympus | Control the laser-scanning microscope | |
Kinematic Mirror Mount | Thorlabs | POLARIS-K1-2AH | 2 Low-Profile Hex Adjusters |
L-Phenalynine | Sigma | P5482-25G | https://www.sigmaaldrich.com/US/en/product/sigma/p5482 |
L-Tryptophan | Sigma | T8941-25G | https://www.sigmaaldrich.com/US/en/product/sigma/t8941 |
LabSpec 6 | Horiba XploRA | N/A | https://www.horiba.com/gbr/scientific/products/detail/action/show/Product/labspec-6-spectroscopy-suite-software-1843/ |
Lock-In Amplifier | Zurich Instruments | N/A | https://www.zhinst.com/americas/en/products/shfli-lock-in-amplifier |
Long-pass Dichroic Beam Splitter | Semrock | Di02-R980-25×36 | 980 nm laser BrightLine single-edge laser-flat dichroic beamsplitter |
MATLAB | MathWorks | Version: R2022b | https://www.mathworks.com/products/new_products/latest_features.html |
Microscope Slides | Fisherbrand | 12-550-003 | https://www.fishersci.com/shop/products/fisherbrand-selectfrost-microscope-slides-9/12550003#?keyword=12-550-003 |
Microscopy Imaging Software | Olympus | FluoView | |
MPLN 100x, Olympus | Olympus | MPLAPON | https://www.olympus-ims.com/en/microscope/mplapon/#!cms[focus]=cmsContent11364 |
MPLN 50x, Olympus | Olympus | MPLAPON | https://www.olympus-ims.com/en/microscope/mplapon/#!cms[focus]=cmsContent11363 |
NA Oil Condenser | Olympus | 6-U130 | https://www.hitechinstruments.com/Product-Details/olympus-achromatic-aplanatic-high-na-condneser |
Nail Polish | Wet n Wild | B01EO2G5O4 | https://www.amazon.com/dp/B01EO2G5O4/ref=cm_sw_r_api_i_E609VVDWW HHQP38FXXDC_0 |
Origin | OriginLab | Origin 2022b (9.95) | https://www.originlab.com/index.aspx?go=PRODUCTS/Origin |
Parafilm | Fisher Scientific | S37440 | https://www.fishersci.com/shop/products/parafilm-m-wrapping-film-3/p-2379782 |
PBS 1x (Dulbecco's Phosphate Buffered Saline) | Thermofischer – Gibco | 14040117 | https://www.thermofisher.com/order/catalog/product/14040117?SID=srch-hj-14040117 |
Penicillin/Streptomycin | Thermofischer – Gibco | 15140122 | https://www.thermofisher.com/order/catalog/product/15140122 |
Periscope Assembly | Thorlabs | RS99 | Includes the top and bottom units, Ø1" post, and clamping fork. |
picoEmerald System | A.P.E | N/A | https://www.ape-berlin.de/en/cars-srs/ |
Shielded Box with BNC Connectors | Pomona Electronics | 2902 | Aluminum Box with Cover, BNC Female/Female |
Si Photodiode Detector | Home Built | N/A | DYI series |
Silicon Wafer | |||
Spacers | Grace Bio-Labs | 654008 | https://gracebio.com/product/secureseal-imaging-spacers-654008/ |
Spontaneous Raman spectroscopy | Horiba XploRA | N/A | https://www.horiba.com/int/products/detail/action/show/Product/xploratm-plus-1528/ |
Stimulated Raman Scattering Microscopy | Home Built | N/A | |
Touch Panel Controller | Olympus | Control the X-Y direction of the laser-scanning microscope | |
Trypan Blue 0.4% (0.85% NaCl) | Lonza | 17-942E | https://bioscience.lonza.com/lonza_bs/US/en/Culture-Media-and-Reagents/p/000000000000181876/Trypan-Blue%2C-0-4%25-Solution" |
Tweezers | Kaverme – Amazon | B07RNVXXV1 | https://www.amazon.com/Precision-Anti-Static-Electronics-Laboratory-Jewelry-Making/dp/B07RNVXXV1" |
Two Photon Excitation Fluorescence Microscopy | Home Built | N/A | |
Weighing Paper | VWR | 12578-165 | https://us.vwr.com/store/product/4597617/vwr-weighing-paper |
Zurich LabOneQ Software | Zurich Instruments | Control the Zurich lock-in amplifier |