1. Sample Preparation
- Coverslip cleaning
NOTE: Work under a fume hood.- Use clean tweezers to place glass coverslips (24 mm diameter) into a coverslip holder that separates individual coverslips.
- Put the holder with coverslips into a beaker, and add chloroform until the coverslips are covered. Cover the beaker with aluminum foil to reduce evaporation and sonicate in a bath sonicator for 1 hr at RT. Take the coverslip holder out of the beaker and let the coverslips dry.
- Repeat step 1.1.2 with 5M NaOH solution instead of chloroform.
- Take the coverslip holder into a new beaker and wash three times with distilled water. Put cleaned coverslips in a glass cell culture plate filled with 100% ethanol.
- Preparation of calibration samples
- Dissolve fluorescent dye in appropriate solvent.
- Prepare a 1:10 serial dilution of the fluorescent dye ranging from 1 pM to 1 nM in filter sterilized (0.22 µm) water.
- Take cleaned coverslips stored in 100% ethanol and wash with filter-sterilized water. Spot 20 µl of each fluorescent dye dilution on a separate cleaned coverslip. Let the coverslips dry under a sterile hood. Protect the coverslips from light and dust until use. Use these samples to estimate the intensity of single fluorescent molecules (see step 3).
- Transfection
- Culture CHO cells in 1:1 Dulbecco's modified Eagle medium/nutrient mixture F-12 (DMEM/F12) supplemented with 10% fetal bovine serum (FBS), 100 U/ml penicillin and 100 µg/ml streptomycin at 37 °C, in 5% CO2. NOTE: Use phenol-red free media throughout the experiment to minimize autofluorescence.
- Take cleaned coverslips from 100% ethanol solution, wash them with sterile phosphate-buffered saline (PBS), and place one coverslip into each well of a 6 well cell culture plate.
- Trypsinize, count and seed CHO cells at a density of 3 x 10⁵ cells/well in the 6-well cell culture plate containing the coverslips. Let the cells grow in an incubator (37 °C, 5% CO2) for 24 hr in order to achieve approx. 80% confluency, which is the optimal cell density for transfection.
- For each well, dilute 2 µg of the desired plasmid DNA (e.g., SNAP-tagged β2-adrenergic receptor) and 6 µl Lipofectamine 2000 in two separate tubes containing 500 µl OptiMem medium. Incubate at RT for 5 min.
- Combine the solutions from step 1.3.4 into one tube and mix to obtain a transfection mixture. Incubate the transfection mixture at RT for 20 min.
- During the incubation (1.3.5), take the CHO cells and wash twice with pre-warmed (37 °C) PBS. Replace PBS with 1 ml/well of phenol red-free DMEM/F12 medium supplemented with 10% FBS but no antibiotics.
- Add the entire transfection mixture (1 ml) from step 1.3.5 dropwise to each well, and gently rock the plate back and forth to ensure complete mixing.
- Incubate for 2 to 4 hr at 37 °C, in 5% CO2 and proceed immediately afterwards to the next step. NOTE: These transfection conditions have been optimized to achieve receptor densities <0.45 particle/µm2, which are suitable for single-molecule imaging. Adjustments might be required when using different cells, constructs or reagents.
- Protein labeling
- Dilute 1 µl of fluorophore-BG stock solution in 1 ml DMEM/F12 medium supplemented with 10% FBS to obtain a final concentration of 1 µM. Take the transfected cells from the incubator and wash twice with prewarmed (37 °C) PBS. Replace PBS with 1 ml of 1 µM fluorophore-BG solution and incubate for 20 min at 37 °C 5% CO2 in an incubator.
- After the incubation, wash the cells three times with DMEM/F12 medium supplemented with 10% FBS, each time followed by 5 min incubation at 37 °C. Take a coverslip (with labeled cells) with tweezers and place it into an imaging chamber.
- Wash twice with 300 µl imaging buffer. Add 300 µl of fresh imaging buffer and proceed immediately to imaging (Part 2).
2. Image Acquisition
NOTE: Use a total internal reflection fluorescence (TIRF) microscope, equipped with an oil-immersion high numerical aperture objective (e.g., 100X magnification/1.46 numerical aperture), suitable lasers (e.g., 405 nm, 488 nm, 561 nm and 645 nm diode lasers), an electron multiplying charge coupled device (EMCCD) camera, an incubator and a temperature control to visualize single fluorescent molecules.
- Set the desired microscope parameters, i.e., laser line, TIRF angle (this parameter controls the penetration depth of the evanescent field), exposure time, frame rate and number of images per movie10. Keep the heater/incubator and temperature control always on to avoid temperature drifts and moisture condensation.
- Put a drop of immersion oil on the 100X objective of the microscope. Place the imaging chamber with the labeled cells onto the specimen holder of the microscope, and bring the cells in focus using brightfield illumination.
- Switch to TIRF illumination. Keep laser power as low as possible to allow searching for the desired cell but at the same time minimizing photobleaching.
- Select the desired cell and fine adjust the focus. Set the laser power to a level that allows visualization of single fluorophores. Acquire image sequence and save raw image sequence file as .tiff.
3. Calibration (Single Fluorophores on Glass and Monomeric/dimeric Receptor Controls)
- Assemble each calibration sample prepared as described in 1.2 in the imaging chamber. Place each sample on the microscope and choose the sample containing well-separated diffraction-limited spots that bleach in a single step. NOTE: These spots represent single molecules of the fluorescent dye.
- Acquire TIRF image sequences as described in step 2. Important: the same imaging parameters must be used for all experiments, including the ones for calibration.
- Perform the detection and tracking analysis as detailed in 4.1 – 4.2. Extract the intensity of each particle as described in 4.2.6. From these data, calculate the mean (µ) and standard deviation (σ) of the intensity of single fluorophores.
- Optional: perform the same analysis on cells transfected with a monomeric cell-surface receptor (e.g., CD86), N-terminally tagged with either one or two copies of SNAP10 and labeled with the fluorophore-BG derivative. Follow the procedure described above for the single fluorophore on glass. Estimate the labeling efficiency as described in Calebiro, D. et al.10
4. Image Analysis
- Image sequence preparation
- Use an image processing software (e.g., ImageJ) to crop the images.
- Save individual frames as separate .tiff images in a new folder, indicating on each image the frame number.
- Measure the cell surface area by drawing a region of interest (ROI) along the contour of a cell and using the measure tool de ImageJ or a similar tool in another software. Use this value to calculate particle density by dividing the total number of particles at the beginning of the movie by the cell surface area.
- Particle detection and tracking
NOTE: Use noncommercial software such as u-track13, working in Matlab environment, to automatically detect and track single receptor particles.
NOTE: The u-track algorithm is based on the multiple-hypothesis tracking approach. This approach links particles between frames by building cost matrices, where the individual probabilities that a given particle in one frame corresponds to a given particle in the next frame, appears, disappears or merges/splits with/from other particles are assigned. The solution that globally minimizes the costs, i.e., the one with the highest probability, is finally selected. This also allows tracking a temporarily disappearing particle, a typical phenomenon caused by fluorophore blinking. The latest version of u-track (2.1.0) has graphic user interfaces that facilitate the execution of these analyses.- From the Matlab command prompt, type “movieSelectorGUI” to open the movie selection interface. Follow the instructions to create a new movie database starting from the previously saved separate images (see 4.1.2).
- Provide the pixel size in nm, time interval in seconds, numerical aperture, camera bit depth and emission wavelength of the fluorophore, required for particle detection and tracking. Save the movie database.
- From the movie selection interface, run the analysis, choosing “single-particles” as type of objects. A new window will appear where the parameters used for particle detection and tracking can be defined. Begin with the default parameters. Later, adjust these parameters if the quality of the detection and/or tracking is not satisfactory (e.g., some particles are not detected or tracks are fragmented). Optional: under the tracking settings, check “Export tracking results to matrix format” to store the coordinates and amplitudes of all particles in a single matrix (field called “trackedFeaturedInfo”). For a detailed description of these parameters, refer to the u-track documentation.
- Run the detection algorithm. This algorithm automatically determine the location and intensity above background of each diffraction-limited spot (i.e., single receptors/receptor complexes) by fitting a two-dimensional Gaussian function with standard deviation equal to the point spread function of the microscope around local intensity maxima. Then, run the tracking algorithm. Store the results of the analyses in a .mat file.
- Use the “movieViewer” routine, contained in the u-track package, or similar custom ones to visualize the tracks and check the quality of the detection and tracking.
- Open the .mat file to see the position and amplitude (i.e., intensity) of the tracked particles at each frame. Data generated in step 4.2.4 are contained in the tracksCoordAmpCG field of the tracksFinal array and/or in trackedFeaturedInfo. From the total number of particles detected calculate the particle density dividing this value by the cell surface area measured at 4.1.3.
- Optional: Use the particle coordinates over time (see 4.2.6) to analyze the motion of the receptor particles. Calculate the mean square displacements (MSD) and diffusion coefficients (D) using Matlab or similar software. For each particle and every time interval (Δt) considered, calculate the mean square displacement (MSD) using the following formula:

where Δt is the time interval in frames, N is the number of steps analyzed, x and y are the particle’s x and y coordinates at the frame indicated by the index. Use the MSD over time plots to evaluate the type of motion of a given particle: Linear relationships indicate free diffusion (i.e., Brownian motion), a positive curvature (i.e., the curve looks like a parabola) suggests directed motion, a negative curvature is indicative of confined motion14. In case of freely diffusing particles, calculate the diffusion coefficient (D) of each particle by fitting the obtained MSD data with the following equation:
- Calculation of particle size with Gaussian fitting method
NOTE: Once the intensity distribution of calibration samples (single fluorophores on glass and/or fluorescently labeled monomeric receptors) is known, perform a mixed Gaussian fit on the distribution of particle intensities at the beginning of an image sequence to determine the size of receptor complexes (i.e., the number of receptors per particle)10. Perform these analyses using Matlab or similar software.- Calculate the intensity of each particle by averaging the intensity of the particle from the first frame to the frame before the first change in intensity occurred (in most cases a decrease due to photobleaching).
- Perform a mixed Gaussian fitting according the following equation:
where φ(i) is the frequency of particles having intensity i, n is the component number, αn is a parameter that contributes to the height of component n, μ and σ are the mean and standard deviation of the intensity of reference single fluorophores (calculated as described in step 3). NOTE: Determine the maximal number of components (nmax) for each image sequence by progressively increasing nmax until the addition of a component does no longer produce a statistically better fitting, as judged by an F-test. - Optional: Perform a mixed Gaussian fit on the intensity distribution obtained on the last frames of the movie (e.g., the last 60 frames of a 400 frame sequence). Replace μ and σ with the values obtained after this fitting, which provide refined estimates for those parameters, and repeat step 4.3.2.
- Calculate the area under the curve (AUC) of each component of the mixed Gaussian fit. Calculate the relative abundance of receptor particles of different size (i.e., monomer, dimer, trimer, etc.) by dividing the AUC value of each component by the AUC of the entire distribution.
- Optional: Use data from different cells and the corresponding particle densities (calculated as described in 4.2.6) to generate plots where the distribution of particles with different size is correlated with particle density10.
- Calculation of particle size with step fitting method
NOTE: Use a step-fitting analysis as an alternative method to determine the size of receptor complexes10. The basis for this analysis is that the light-induced destruction (photobleaching) of a single fluorophore results in its instantaneous disappearance – thus particles containing n fluorophores are expected to progressively bleach producing an intensity profile with n steps.- Extract intensity profiles of each particle from the .mat file generated by u-track or similar detection/tracking software (see 4.2.6).
- Use a step-fitting algorithm, such as the one presented in ref. 10, to count the number of bleaching steps for each particle.
- Optional: use the results to generate distributions showing the relative abundance of receptor particles of different size and correlate them with particle density as previously described for the results of the mixed Gaussian fitting (see 4.3).
The described protocol can be applied to a variety of different membrane proteins. As an example, representative results obtained with β2-adrenergic and GABAB receptors are reported10. Since fluorescent signals from single molecules are weak, minimization of background fluorescence is the first key step to successful results. Thus, it is important to use extensively cleaned coverslips (Figure 2A) as well as to minimize sample autofluorescence (e.g., by using phenol-red free media). The next step is to determine the fluorescence intensity of single fluorophore molecules. This can be done by imaging single fluorophores spotted on a clean coverslip (Figure 2B). Typically, a serial dilution of the fluorophore is used to select the best conditions for the analysis, i.e., the concentration that produces well-separated and uniformly distributed single fluorophores. Additional controls can be performed by imaging monomeric control proteins, e.g., NAP-tagged CD86 receptors labeled with a fluorophore-BG derivative. Once these preliminary controls and calibration have been performed, the real experiments can begin. Figure 3A shows the first frame of a typical TIRF image sequence of a cell transfected with SNAP-tagged β2-adrenergic receptors and labeled with a fluorophore-BG derivative. The spots represent single receptors or receptor complexes. This image also demonstrates a suitable particle density for automated detection and tracking – according to our experience, densities above 0.45 particles/µm2 result in poor tracking quality and should be avoided10. Figure 3B shows the results of the detection algorithm applied to the same image sequence. Each blue circle indicates a detected particle. The results of the tracking algorithm are reported in Figure 3C, where the blue splines represent the trajectories of the individual particles. The trajectories of each particle can then be used to calculate their diffusion coefficients. This method also allows capturing dynamic events as shown in Figure 3D, where two particles apparently undergo a transient interaction. Figure 4 shows the distribution of diffusion coefficients measured for two different GPCRs, i.e., β2-adrenergic and GABAB receptors. This type of analysis allowed us to show that a large fraction of GABAB receptors is immobile or has a very low mobility10. The mixed Gaussian fitting and step-fitting analyses provide a precise quantification of the size of receptor complexes on the surface of living cells (Figure 5). This analysis can also reveal complex distributions, e.g., the coexistence of monomers and dimers as shown in the example of Figure 5A. Figures 5B and 5C provide two examples of particles bleaching in one or two steps and the corresponding step-fitting analysis that correctly assigned them as monomeric and dimeric receptors, respectively.

Figure 1. Workflow of a typical single-molecule experiment as detailed in this protocol. Please click here to view a larger version of this figure.

Figure 2. Coverslip cleaning and preparation of calibration samples. (A) Comparison of the background fluorescence before and after extensive coverslip cleaning. Coverslips were imaged by TIRF microscopy. (B) TIRF images of increasing concentrations of a fluorophore-BG derivative spotted on cleaned coverslips. Scale bar: 10 µm. Please click here to view a larger version of this figure.

Figure 3. Typical single-molecule images and results of detection/tracking algorithms. (A) CHO cells transfected with SNAP-tagged β2-adrenergic receptors and labeled with a fluorophore-BG derivative were visualized by TIRF microscopy. Shown is the first frame of the acquired image sequence. Scale bar: 5 µm. (B) Detected particles are indicated by blue circles on top of the original image. (C) The trajectories resulting from the application of the tracking algorithm to the same image sequence are shown on a white background. The snapshot corresponds to the situation at frame no. 35. Green segments, merging events. Red segments, splitting events. (D) Representative trajectories obtained from two receptor particles (blue and green, respectively), undergoing an apparent transient interaction (red). The two particles merge, move together for several frames, and split again. Please click here to view a larger version of this figure.
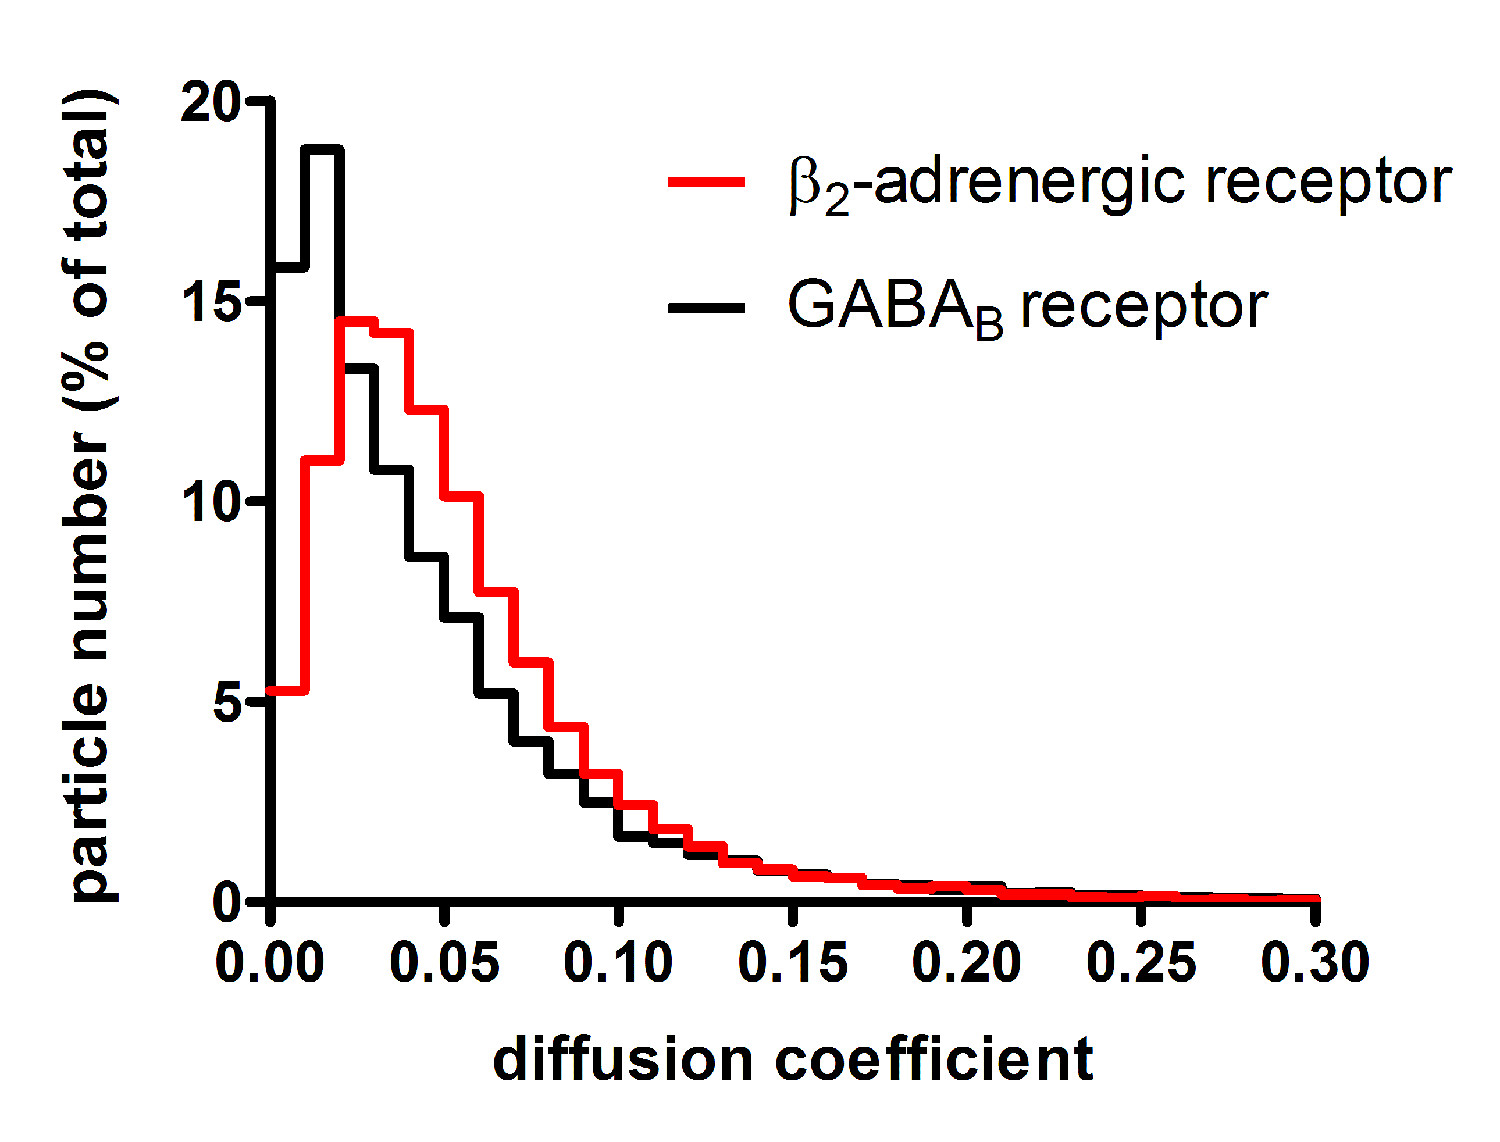
Figure 4. Analysis of receptor mobility. The trajectories of individual particles are used to calculate their diffusion coefficients. In this example, the distributions of diffusion coefficients calculated for two different GPCRs are reported. β2-adrenergic receptors are characterized by fast lateral diffusion on the cell surface, whereas GABAB receptors have limited mobility. Modified from Calebiro, D. et al.10

Figure 5. Analysis of the size of receptor complexes. (A) The size of receptor complexes can be precisely estimated by fitting the distributions of particle intensities with a mixed Gaussian model. The reported example shows the application of this analysis to a cell expressing SNAP-tagged β2-drenergic receptors. The fitting reveals two components: one corresponding to the intensity of single fluorophores (largely superimposable to that of calibration samples as well as to the distribution obtained after partial bleaching of the sample, shown here) and one with approximately double intensity. The two components can be assigned as monomers and dimers, respectively, and the areas under the two components can be used to estimate the relative abundance of monomeric and dimeric receptors. (B) Example of a monomeric receptor particle bleaching in one step. (C) Example of a dimeric receptor particle with the characteristic two-step bleaching. The red lines in (B) and (C) are the result of the step-fitting algorithm. The figure was modified from Calebiro, D. et al.10 Please click here to view a larger version of this figure.
