Here, we present a protocol to study DNA-protein interactions by total internal reflection fluorescence microscopy (TIRFM) using a site-specifically modified λ DNA substrate and a Quantum-dot labeled protein.
The fluorescence microscopy has made great contributions in dissecting the mechanisms of complex biological processes at the single molecule level. In single molecule assays for studying DNA-protein interactions, there are two important factors for consideration: the DNA substrate with enough length for easy observation and labeling a protein with a suitable fluorescent probe. 48.5 kb λ DNA is a good candidate for the DNA substrate. Quantum dots (Qdots), as a class of fluorescent probes, allow long-time observation (minutes to hours) and high-quality image acquisition. In this paper, we present a protocol to study DNA-protein interactions at the single-molecule level, which includes preparing a site-specifically modified λ DNA and labeling a target protein with streptavidin-coated Qdots. For a proof of concept, we choose ORC (origin recognition complex) in budding yeast as a protein of interest and visualize its interaction with an ARS (autonomously replicating sequence) using TIRFM. Compared with other fluorescent probes, Qdots have obvious advantages in single molecule studies due to its high stability against photobleaching, but it should be noted that this property limits its application in quantitative assays.
Interactions between protein and DNA are essential to many complex biological processes, such as DNA replication, DNA repair, and transcription. Although conventional approaches have shed light on the properties of these processes, many key mechanisms are still unclear. Recently, with the rapidly developing single molecule techniques, some of the mechanisms have been addressed1,2,3.
The application of single-molecule fluorescence microscopy on visualizing protein-DNA interactions in real-time mainly depends on the development of fluorescence detection and fluorescent probes. For a single molecule study, it is important to label the protein of interest with a suitable fluorescent probe since fluorescence detection systems are mostly available commercially.
Fluorescent proteins are commonly used in molecular biology. However, the low fluorescent brightness and stability against photobleaching restrict its application in many single molecule assays. Quantum dots (Qdots) are tiny light-emitting nanoparticles4. Due to their unique optical properties, Qdots are 10 – 20 times brighter and several thousand times more stable than the widely used organic dyes5. Moreover, Qdots have a large Stokes shift (the difference between the position of excitation and emission peaks)5. Thus, Qdots can be used for long-time observation (minutes to hours) and acquisition of images with high signal-to-noise ratios, while they cannot be utilized in the quantitative assays.
To date, there are two approaches to label a target protein with Qdots site-specifically: labeling with the aid of Qdot-conjugated primary or secondary antibodies6,7,8; or labeling the target protein with Qdots directly, which is based on the strong interaction between biotin and streptavidin9,10,11,12,13. Streptavidin-coated Qdots are commercially available. In our recent study, site-specifically biotinylated proteins in budding yeast with high efficiency were purified by co-overexpression of BirA and Avi-tagged proteins in vivo10. By following and optimizing the single-molecule assays14,15,16,17, we observed the interactions between Qdot-labeled proteins and DNA at the single molecule level using TIRFM10.
Here, we choose the budding yeast origin recognition complex (ORC), which can specifically recognize and bind to the autonomously replicating sequence (ARS), as our protein of interest. The following protocol presents a step-by-step procedure of visualizing the interaction of Qdot-labeled ORC with ARS using TIRFM. The preparation of the site-specifically modified DNA substrate, the DNA biotinylation, the coverslip cleaning and functionalization, the flow-cell assembly, and the single-molecule imaging are described.
1. Preparation of λ-ARS317 DNA substrate
2. λ-ARS317 DNA Biotinylation
3. Coverslip Cleaning and Functionalization
4. Flow Cell Assembly
5. Single Molecule Visualization
6. Data Analysis
To visualize the interaction between Qdot-labeled ORC and the ARS, we first constructed the λ-ARS317 DNA substrate. A DNA fragment containing ARS317 was integrated into XhoI site (33.5 kb) of native λ DNA by homologous recombination (Figure 1A). The recombination product was packaged using extracts and the packaged phage particles were cultured on LB plates (Figure 1B). The positive phage plaque was screened by PCR and confirmed by sequencing (Figure 1C). λ-ARS317 DNA was purified from the liquid lysates (Figure 1D).
Single-molecule imaging assays were carried out on the objective-type TIRFM set-up (Figure 2). By labeling the biotinylated ORC with a nearly 1:1 molar ratio streptavidin-coated Qdots rapidly, Qdot-labeled ORC was pumped into the λ-ARS317 tethered flow cell. DNA was stained using SYTOX Orange. The signals of Qdot-labeled ORC and SYTOX-Orange-stained DNA were imaged concurrently using TIRFM (Figure 3A-3C). To determine the distribution of ORC on λ-ARS317, the imaging stack was separated into two stacks: one stack of DNA signal and the other stack of ORC signal as described in step 6.1 (Figure 3B). Based on the formula, Position (kb) = (LORC/LDNA) × 50kb (Figure 3D), 273 binding positions of ORC-Qdot705 molecules on 168 DNA substrates were quantitively analyzed. The data showed that ORC-Qdot705 specially bindson the ARS317 inserted site with an obviously high abundance (Figure 3E). Meanwhile, ORC-Qdot705 also binds on the AT-rich areas located in middle and the free end of λ DNA, which is consistent with the results of the previous study10.
The high-quality image acquisition depends on the molar ratio of protein and Qdots in the labeling assay. Excessive Qdots may be good for the protein labeling efficiency, but they can create background noise. As shown in Figure 4, while labeling the biotinylated ORC with streptavidin-coated Qdots at 1:3 molar ratio, the background noise increased. Thus, it is critical to choose the appropriate molar ratio of biotinylated proteins to streptavidin-coated Qdots.
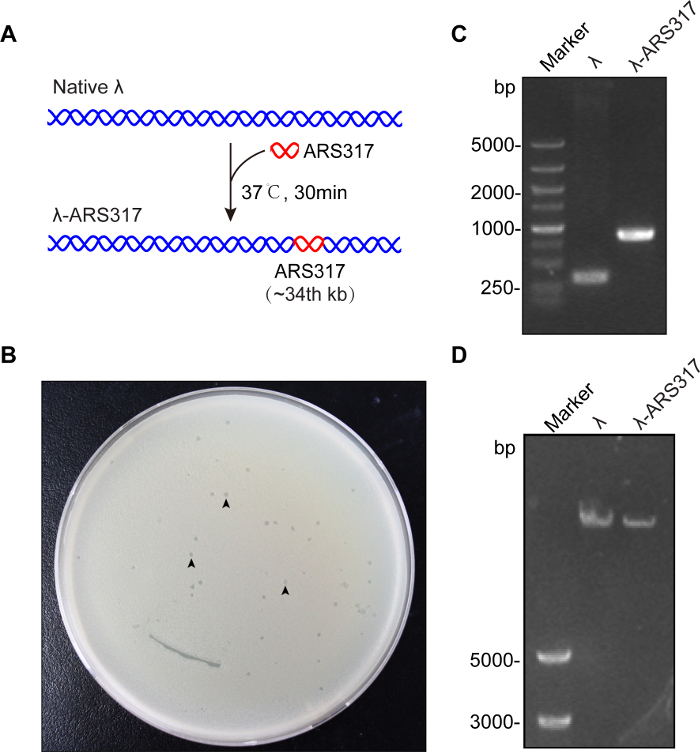
Figure 1: Preparation of λ-ARS317 DNA substrate. (A) Illustration of λ-ARS317 construction. A DNA fragment bearing ARS317 was integrated into λ DNA by homologous recombination. (B) Plaques on LB solid medium. Three of them were marked using black arrows. (C) A λ-ARS317 plaque was identified using PCR. (left) Marker, (middle) native λ DNA, (right) a plaque of λ-ARS317. (D) Purified λ-ARS317 DNA was detected by 0.6% agarose gel electrophoresis. (left) Marker, (middle) native λ DNA (right) purified λ-ARS317. Please click here to view a larger version of this figure.
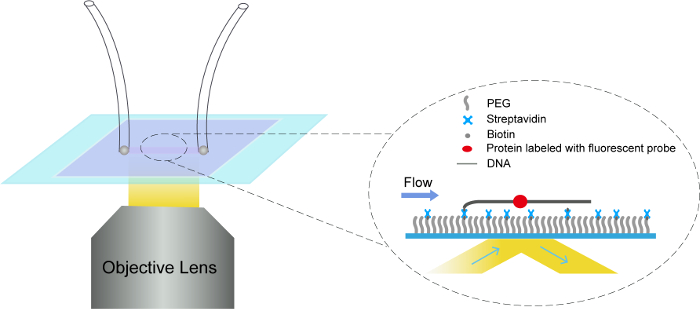
Figure 2: Schematic overview of objective-type TIRF and flow cell. Single molecule imaging assays were carried out based on the TIRFM combining with flow cell system. Our TIRFM was performed on an inverted microscope fitted with a 60X oil objective (numerical aperture = 1.49). DNA (gray line) was tethered on the coverslip in the flow cell through the biotin-streptavidin linkage, and stretched by the flow from left to right. A protein binding on the tethered DNA was indicated by a red-oval dot. Please click here to view a larger version of this figure.
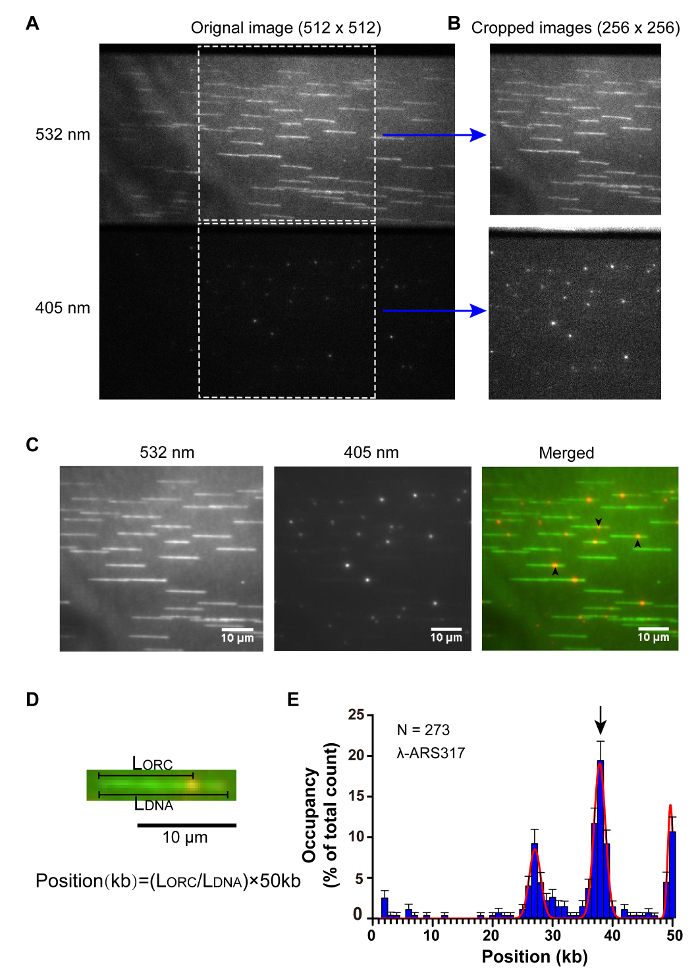
Figure 3: Qdot705-labeled ORC (1:1 molar ratio) binding on λ-ARS317. (A) ORC and λ-ARS317 DNA were observed simultaneously. (top) SYTOX Orange stained DNA was excited using a 532 nm laser and observed using the 550-613 nm transmission band of the quad-band band-pass filter. (bottom) Qdot705-labeled ORC was excited using a 405 nm laser and observed using the 663-743 nm transmission band of the quad-band band-pass filter. (B) Two 256×256 sub-stacks were cropped from the original 512×512 stack. (C) The images acquired using 61 sequential frames in the corresponding stacks. (left) SYTOX Orange stained DNA, (middle) Qdot705-labeled ORC, (right) merged image; three Qdot705-labeled ORC binding at ARS317 site on λ-ARS317 DNA substrates were marked using black arrows. (D) Illustration of the calculation of ORC binding position on DNA. LDNA means the DNA length, LORC means the distance from ORC binding site on DNA to the tethered end of DNA. (E) Histogram of ORC binding distribution on λ-ARS317 DNA. Gaussian fit to the data was indicated using the red solid line. Error bars indicate a 95% confidence interval based on 1000 bootstrap samples. N means the number of ORC molecules. ARS317 inserted site was indicated using a black arrow. Please click here to view a larger version of this figure.
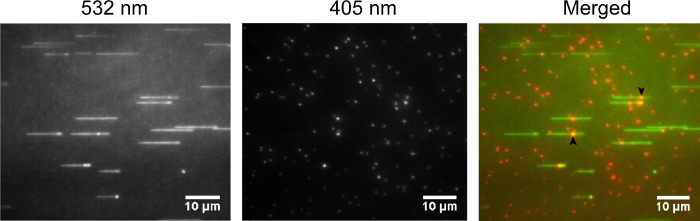
Figure 4: Qdot-labeled ORC binding (3:1 molar ratio) on λ-ARS317. ORC and λ-ARS317 DNA were observed in the same way as in Figure 3A. (left) SYTOX Orange stained DNA was excited using a 532 nm laser. (middle) Qdot-labeled ORC was excited using a 405 nm laser. (right) merged images. Two Qdot-labeled ORC binding at ARS317 site on λ-ARS317 DNA substrates were marked using black arrows. Please click here to view a larger version of this figure.
Here, we present a protocol to observe the interaction between the Qdot-labeled protein and the site-specifically modified λ DNA using the TIRFM in a flow-cell. The necessary steps include site-specific modification of DNA substrate, DNA biotinylation, coverslip cleaning and functionalization, flow-cell preparation, and single-molecule imaging. There are two key points that should be noted. First, all the steps involved with λ DNA should be manipulated gently to decrease any possible damage, e.g., avoiding mixing by pipetting up and down repeatedly. Second, it is very important to ensure that the coverslip is clean enough to minimize its background noise. During the coverslip cleaning and functionalization process, water should reach ultrapure level, and the air should be dust-free. It is better to carry out the coverslip functionalization and flow-cell assembly on a clean bench.
In the single molecule assays for studying protein-DNA interaction, λ DNA is an appropriate substrate with several advantages20. λ DNA is long enough to be easily observed and permit recording protein movement on it in a single molecule experiment. Moreover, the ssDNA overhangs allow many designs for tethering λ DNA on a glass coverslip. In this study, we present a method for inserting an exogenous DNA fragment at a specific site of λ DNA. Thus, various user-definable DNA fragments can be integrated into λ DNA. The modified λ DNA can be conveniently purified from liquid lysates in large quantities for single molecule study.
It is difficult to evaluate the labeling efficiency accurately in the streptavidin-coated Qdot labeling assay because there are approximately 5 – 10 streptavidins per Qdot nanocrystal. Accordingly, the appropriate molar ratio of streptavidin-coated Qdots and biotinylated proteins should be optimized in the experiments. A 1:1 molar ratio can be a reference.
It should be noted that Qdot cannot be used in accurate quantitative assays since its high photo-stability is unsuitable for the photo-bleaching assay. Although the high stability of Qdots limits its application in the quantitative assays, it allows easy observation and long-time tracking5. With increasing applications of single-molecule fluorescence microscopy in biology, the protocol described in this paper will greatly contribute to unraveling the mechanisms of DNA metabolism in future.
The authors have nothing to disclose.
We thank Dr. Hasan Yardimci and Dr.Sevim Yardimci of the Francis Crick Institute for kind help in the single-molecule experiments, Dr. Daniel Duzdevich from Dr. Eric C. Greene's lab of Columbia University, Dr. Yujie Sun of Peking University and Dr. Chunlai Chen of Tsinghua University for useful discussion. This study was supported by the National Natural Science Foundation of China 31371264, 31401059, CAS Interdisciplinary Innovation Team and the Newton Advanced Fellowship (NA140085) from the Royal Society.
Lambda DNA | New England Biolabs | N3011 | Store 25 μL aliquots at -20 ºC. |
XhoI enzyme | Thermo Fisher Scientific | FD0694 | |
Quick-fusion cloning kit | Biotool | B22611 | |
MaxPlax Lambda Packaging Extracts |
Epicentre | MP5110 | Bacterial strain LE392MP is included in this package. |
MgSO4 | Sinopharm Chemical Reagent Co.,Ltd | 10013092 | Any brand is acceptable. |
Tris | Amresco | 0497-5KG | |
NaCl | Beijing Chemical works | N/A | Any brand is acceptable. |
MgCl2 | Sinopharm Chemical Reagent Co.,Ltd | 10012818 | |
Chloroform | Beijing Chemical works | N/A | Any brand is acceptable. |
NZ-amine | Amresco | J853-250G | |
Casamino acids | Sigma-Aldrich | 22090-500G | |
PEG8000 | Beyotime | ST483 | |
Magnetic stirring apparatus | IKA | KMO2 basic | |
15 mL Eppendorf tube | Eppendorf | 30122151 | 15 mL, sterile, bulk, 500pcs |
Rnase | SIGMA | R4875-100MG | |
Dnase | SIGMA | D5319-500UG | |
Proteinase K | Amresco | 0706-100MG | |
Biotinylated primers | Thermo Fisher Scientific | N/A | |
T4 DNA ligase, T4 DNA Ligase, Reaction Buffer (10x) | New England Biolabs | M0202 | |
Coverslip | Thermo Fisher Scientific | 22266882 | |
Ethanol | Sinopharm Chemical Reagent Co.,Ltd | 10009259 | |
Potassium hydroxide (KOH) | Sigma-Aldrich | 306568-100G | |
Acetone | Thermo Fisher Scientific | A949-4 | |
H2SO4 | Sinopharm Chemical Reagent Co.,Ltd | 80120891 | sulfuric acid |
H2O2 | Sinopharm Chemical Reagent Co.,Ltd | 10011218 | 30% Hydrogen peroxide |
Methanol | Sigma-Aldrich | 322415-2L | |
Acetic acid | Sigma-Aldrich | V900798 | |
APTES | Sigma-Aldrich | A3648 | |
mPEG (methoxy-polyethylene glycol) |
Lysan | mPEG-SVA-5000 | |
biotin-PEG (biotin-polyethylene glycol) |
Lysan | Biotin-PEG-SVA-5000 | |
NaHCO3 | Sigma-Aldrich | 31437-500G | |
Vacuum desiccator | Tianjin Branch Billion Lung Experimental Equipment Co., Ltd. | IPC250-1 | |
Vacuum sealer | MAGIC SEAL | WP300 | |
Diamond-tipped glass scribe | ELECTRON MICROSCOPY SCIENCES | 70036 | |
Glass slide | Sail Brand | 7101 | |
Inlet tubing | SCI (Scientific Commodties INC.) | BB31695-PE/2 | inner diameter 0.38 mm; outer diameter 1.09 mm. |
Outlet tubing | SCI (Scientific Commodties INC.) | BB31695-PE/4 | inner diameter 0.76 mm; outer diameter 1.22 mm. |
Double-sided tape | Sigma-Aldrich | GBL620001-1EA | |
Epoxy | LEAFTOP | 9005 | five minutes epoxy |
Streptavidin | Sigma-Aldrich | S4762 | |
Fluorescence Microscope | Olympus | IX71 | |
Infusion/withdrawal programmable pump |
Harvard apparatus | 70-4504 | |
532 nm laser | Coherent | Sapphire-532-50 | |
640 nm laser | Coherent | OBIS-640-100 | |
EMCCD Camera | Andor | DU-897E-CS0-BV | |
W-View Gemini Imaging splitting optics |
Hamamatsu photonics K.K. | A12801-01 | |
TIRF illumination system | Olympus | IX2-RFAEVA2 | |
60×TIRF objective | Olympus | APON60XOTIRF | |
Quad-edge laser dichroic beamsplitter |
Semrock | Di01-R405/488/ 532/635-25×36 |
|
Quad-band bandpass filter | Semrock | FF01-446/510/ 581/703-25 |
|
Dichroic beamsplitter | Semrock | FF649-Di01-25×36 | |
Emission filter | Chroma Technology Corp | ET585/65m | |
Emission filter | Chroma Technology Corp | ET665lp | |
FocalCheck fluorescence, microscope test slide #1 | Thermo Fisher Scientific | F36909 | |
SYTOX Orange | Thermo Fisher Scientific | S11368 | |
Qdot705 Streptavidin Conjugate | Thermo Fisher Scientific | Q10163MP | Store at 4 ºC, do not freeze. |
ATP | Amresco | 0220-25G | Prepare 200 mM ATP solution, using ddH2O, adjust pH to 7.0, and store 10 μL aliquots at -20 ºC. |
DTT | Amresco | M109-5G | Prepare 1 M solution using ddH2O, and store 10 μl aliquots at -20 ºC. |