The feasibility and effectiveness of high-throughput scRNA-seq methods herald a single-cell era in plant research. Presented here is a robust and complete procedure for isolating specific Arabidopsis thaliana root cell types and subsequent transcriptome library construction and analysis.
In multicellular organisms, developmental programming and environmental responses can be highly divergent in different cell types or even within cells, which is known as cellular heterogeneity. In recent years, single-cell and cell-type isolation combined with next-generation sequencing (NGS) techniques have become important tools for studying biological processes at single-cell resolution. However, isolating plant cells is relatively more difficult due to the presence of plant cell walls, which limits the application of single-cell approaches in plants. This protocol describes a robust procedure for fluorescence-activated cell sorting (FACS)-based single-cell and cell-type isolation with plant cells, which is suitable for downstream multi-omics analysis and other studies. Using Arabidopsis root fluorescent marker lines, we demonstrate how particular cell types, such as xylem-pole pericycle cells, lateral root initial cells, lateral root cap cells, cortex cells, and endodermal cells, are isolated. Furthermore, an effective downstream transcriptome analysis method using Smart-seq2 is also provided. The cell isolation method and transcriptome analysis techniques can be adapted to other cell types and plant species and have broad application potential in plant science.
Cells are the fundamental unit of all living organisms and perform structural and physiological functions. Although the cells in multicellular organisms show apparent synchronicity, cells of different types and individual cells present differences in their transcriptomes during development and environmental responses. High-throughput single-cell RNA sequencing (scRNA-seq) provides unprecedented power for understanding cellular heterogeneity. Applying scRNA-seq in plant sciences has contributed to successfully constructing a plant cell atlas1, has been used to identify rare cellular taxa in plant tissues2, has provided insight into the composition of cell types in plant tissues, and has been used to identify cellular identity and important functions employed during plant development and differentiation. In addition, it is possible to infer spatiotemporal developmental trajectories in plant tissues1,2,3 to discover new marker genes4 and study the functions of important transcription factors5 using scRNA-seq in order to reveal the evolutionary conservation of the same cell type in different plants3. Abiotic stresses are among the most important environmental influences on plant growth and development. By exploring the changes in the composition of cell types in plant tissues under different treatment conditions through single-cell transcriptome sequencing, one can also resolve the abiotic stress response mechanism6.
The potential for resolving transcriptional heterogeneity between cell types using scRNA sequencing depends on the cell isolation method and sequencing platform. Fluorescence-activated cell sorting (FACS) is a widely used technique for isolating a subpopulation of cells for scRNA-seq based on light scattering and the fluorescence properties of the cells. The development of fluorescent marker lines by transgenic technology has greatly improved the efficiency of cell isolation by FACS7. Conducting scRNA-seq using Smart-seq28 further enhances the ability to dissect the cellular heterogeneity. The Smart-seq2 method has good sensitivity for gene detection and can detect genes even with a low transcript input9. In addition to bulk cell type collection, modern cell sorters provide a single-cell index sorting format, allowing transcriptome analysis at single-cell resolution using Smart-seq210 or other multiplexed RNA-seq methods, such as CEL-seq211. Single-cell or cell-type sorting can be potentially used for many other downstream applications, such as parallel multi-omics studies12,13. Presented here is a robust and versatile protocol for isolating plant cell types, such as xylem-pole pericycle cells, lateral root cap cells, lateral root initial cells, cortex cells, and endodermal cells from the roots of Arabidopsis thaliana marker cell lines by FACS. The protocol further involves constructing the Smart-seq2 library for downstream transcriptome analysis.
The following protocol has been optimized for A. thaliana wild-type (WT) seeds with no fluorescence and fluorescent marker lines for the following root cell types: xylem-pole pericycle cells (J0121), lateral root initial cells, lateral root cap cells (J3411), endodermis and cortex cells (J0571) (Figure 1A). All the marker lines were obtained from a commercial source (see Table of Materials), except for the lateral root initiation cell marker line, which was generated by introducing a GATA23 promoter-driven GFP construct into a wild-type Arabidopsis plant following a previously published report14.
1. Preparation of the plant material
2. Protoplasting
3. Fluorescence-Activated Cell Sorting (FACS)
4. Smart-seq2 library preparation
5. RNA-seq data analysis
Protoplast isolation
This protocol is effective for the protoplast sorting of fluorescent A. thaliana root marker lines. These markers lines have been developed by the fusion of fluorescent proteins with genes expressed specifically in target cell types, or using enhancer trap lines (Figure 1). Numerous tissues and organs have been dissected into cell types expressing specific fluorescent markers in model plants and crops.
FACS population, sorted cells, and library QC
By using a wild-type plant as a control and setting gates such as forward scatter (FSC) and side scatter (SSC), we determined a major population of cells of interest and a baseline for autofluorescence and successfully sorted the fluorescence-specific marked cells (Figure 2). The quality of the final sequencing libraries (from step 4.15) was determined by the fragment size distribution analysis. The representative results of the RNA-seq library of about 2,000 xylem-pole pericycle cells, lateral root primordia cells, endodermis/cortex cells, and lateral root cap cells are shown in Figure 3A–D.
Analysis of expression patterns
The quality of the sequencing data can be evaluated from multiple analysis procedures, such as sequencing depth, mapping rate, and fastQC reports. The accuracy and sensitivity of the sequencing data can be demonstrated by the presence of a series of cell-type enriched genes, which can be identified from the DEG analysis between isolated cell types and the whole tissue. Genes with significantly higher expression levels in certain cell types can be identified as cell-type enriched genes. Meanwhile, the genome-browser views of each cell type can be compared side by side to show the expression levels of known marker genes and test whether the expression pattern of the marker genes can be reconstructed in the cell-type expression data. As an example, the genes that are enriched in any of the four root cell types were clustered and shown in heatmap, which showed the specificity of gene expression among different cell types (Figure 4). YUCCA3, MYB36, WOX5, and PFA1 were examined, and the expression patterns were as expected according to earlier reports21,22,23,24. Data analysis pipelines and representative raw sequencing data are available in a public repository (github.com/gaolabsjtu/root_cell_types_RNAseq).
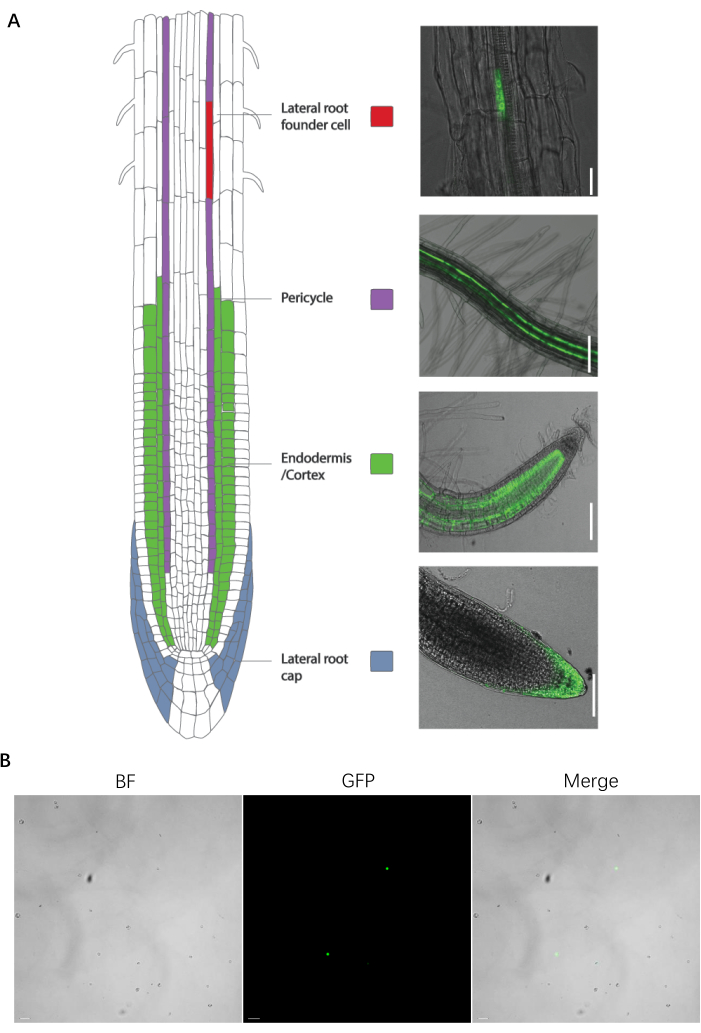
Figure 1: The specific cell type marker line of root and protoplast preparation. (A, left) Enhancer trap line introduction and images. (A, right) The specific cell type marker line of the root. (B) An image of the protoplast preparation before sorting. The scale bars for the lateral root founder cell, pericycle, endodermis/cortex, lateral root cap, and protoplasts represent 25 µm, 100 µm, 100 µm, 75 µm, and 20 µm, respectively. Please click here to view a larger version of this figure.
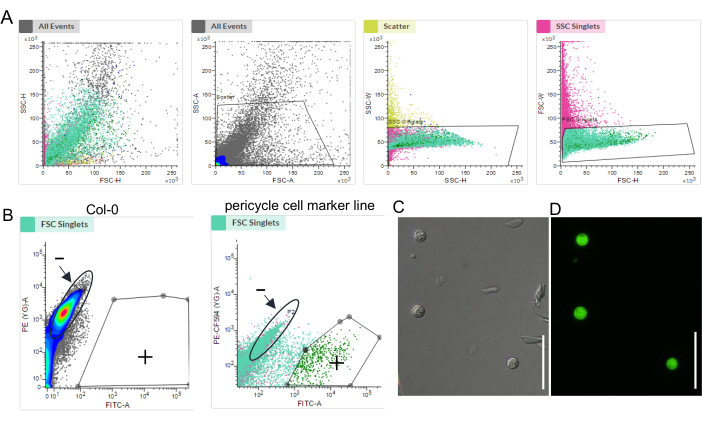
Figure 2: Establishment of FACS for specific root cell types. Example of a FACS experiment: (A) the major population using SSC and FSC; (B) the GFP-positive (+) and GFP-negative (−) gates; (C) the brightfield and (D) fluorescence images of the sorted cells. The scale bar represents 50 µm. Please click here to view a larger version of this figure.
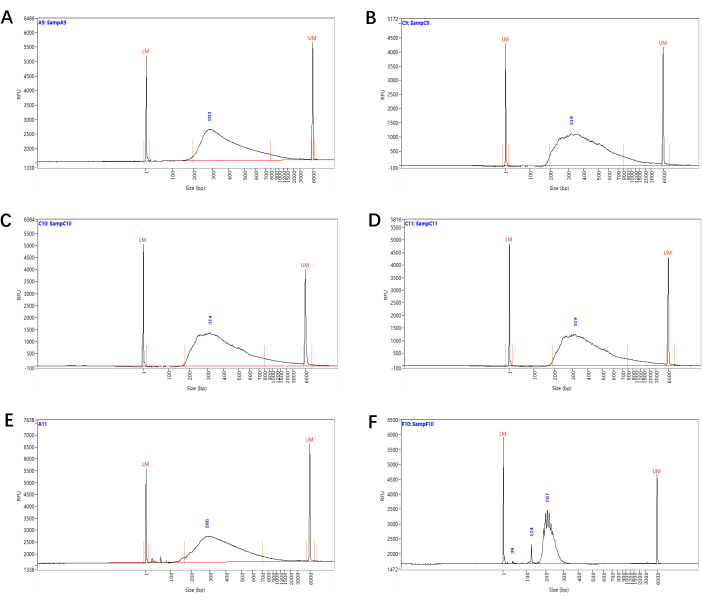
Figure 3: Size distribution of Smart-seq2 sequencing libraries. Representative fragment size distributions of the sequencing libraries (from step 4.15) generated from xylem-pole pericycle cells (A), lateral root primordia cells (B), endodermis/cortex cells (C) and lateral root cap cells (D). (E) A small-size library with primer/adapter dimer peaks, which can still be sequenced after size selection. (F) A library with an abnormal size distribution, which indicated unsuccessful library preparation. Please click here to view a larger version of this figure.
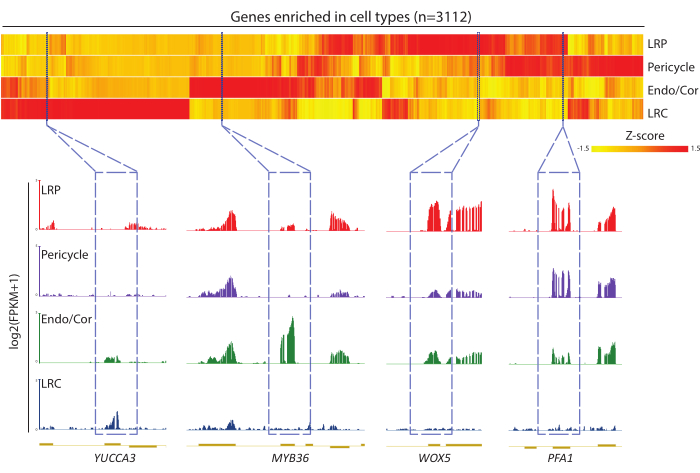
Figure 4: Cell-type-enriched gene analysis. A DEG analysis was carried out between each cell type and the whole root; genes with more than four-fold upregulation in each cell type were identified as cell-type-enriched genes. These genes were combined, clustered, and visualized in the heatmap (upper panel) plot. The cell-type-enriched genes included many known marker genes; typical marker genes such as YUCCA3, MYB36, WOX5, and PFA1 were chosen to show in the genome browser (lower panel). Abbreviations: LRP = lateral root primordia; Endo/Cor = endodermis/cortex; LRC = lateral root cap. Please click here to view a larger version of this figure.
Components | Volume (µL) |
10% Triton X-100 | 0.33 |
RNase inhibitor | 0.55 |
DTT (0.1 M) | 0.22 |
Table 1: Reaction components for the preparation of the cell lysis buffer (mixture A).
Components | Volume (µL) |
Oligo-dT30VN (100 µM) | 0.44 |
dNTPs (10 mM) | 4.4 |
Table 2: Reaction components for the preparation of mixture B.
Components | Volume (µL) |
SuperScript IV buffer (5x) | 8.8 |
Betaine (5 M) | 8.8 |
DTT (0.1 M) | 2.2 |
MgCl2 (1 M) | 0.264 |
TSO (100 µM) | 0.44 |
SuperScript IV reverse transcriptase (200 U/µL) | 2.2 |
RNase inhibitor | 1.1 |
Table 3: Reaction components for the preparation of the reverse transcription PCR mixture (mixture C).
Cycle | Temperature (°C) | Time |
1 | 50 | 90 min |
2-11 | 55 | 2 min |
50 | 2 min | |
12 | 70 | 15 min |
13 | 4 | ∞ |
Table 4: Reverse transcription (RT) PCR settings for synthesizing cDNA from mRNA.
Components | Volume (µL) |
KAPA HiFi HotStart ReadyMix (2x) | 44 |
IS PCR primer (10 µM) | 0.88 |
Table 5: Reaction components for the preparation of the pre-amplification reaction mixture (mixture D).
Cycle | Temperature (°C) | Time |
1 | 98 | 5 min |
2-13 | 98 | 20 s |
67 | 30 s | |
72 | 3 min | |
14 | 72 | 5 min |
15 | 4 | ∞ |
Table 6: PCR program settings for the pre-amplification reaction.
The Smart-seq2-based protocol can generate reliable sequencing libraries from several hundreds of cells8. The quality of the starting material is essential for the accuracy of the transcriptome analysis. FACS is a powerful tool for preparing cells of interest, but this procedure, especially the protoplasting step, must be optimized for plant applications. Laser capture microdissection (LCM) or manual dissected cells can also be used as input25,26, so the protocol provided here can potentially be used in a variety of plant species and cell types with or without known marker genes.
Preparation of the plant material
In plant developmental biology, FACS is usually used to isolate enriched cell populations expressing a fluorescent marker. The plants that express such a marker are protoplasted, and the protoplasts are eventually sorted into pure subpopulations based on the expression of the cell type-specific marker. Therefore, the signal of the fluorescent marker must be strong and specific. Additionally, the researcher should check what markers can be sorted in advance. The number of seeds needed depends on the level of expression, where the marker is expressed, how many cells are needed for downstream applications, and how many replicates are sorted. If the expression is in a single cell type with very few cells per plant, generally a larger number of plants are needed than if the marker is expressed in a higher number of cells. It is best to empirically determine the number of seeds required for individual marker lines. It is especially meaningful to perform preliminary experiments with each marker line to optimize the window for sorting and know how many cells will result from a fixed number of plants. If the experimental material is roots, to prevent the roots from sinking into the agar and to facilitate the cutting of clean roots, a suitably sized and autoclaved mesh can be laid on the medium-containing agar before the seed plating. Low-temperature stratification helps seed germination and development, so we suggest stratifying the seeds at 4 °C for 2 days after sterilizing or plating and then growing the plants vertically.
Protoplasting and FACS
Protoplasting and sorting 5-6 days after stratification work well. Solution A and Solution B must be filtered using a 0.22 µm strainer. Additionally, storing Solution B at −20 °C over longer time periods decreases the efficiency of the enzymes. Before beginning, Solution A and Solution B should be gently thawed on ice, which takes about 20 min. Solution B must not be shaken, as shaking Solution B can disrupt the enzymes and can cause excessive bubble formation. Washing the strainer mesh with Solution A multiple times can increase the number of cells obtained in step 2.5. As described in step 2.6, the entire supernatant should not be aspirated, as the protoplasts are at the bottom near the pellet and cannot be seen. Before sorting, it is best to ensure that the concentration of protoplasts is about 105-106 cells/mL to achieve better sorting efficiency. When setting up a new experiment, the same tissue from the WT plant is required as a control for setting up the sorting gate. In step 3.1, selecting the fluorescence channels (e.g., PE and FITC) first and using a control sample to determine the major population according to SSC and FSC are recommended. Additionally, it is suggested to adjust the position of the gate by changing the voltage of the fluorescence channel to ensure that the control signal is located to the left of the gate (i.e., the negative group is located below 103). The sorting time must be limited to 30 min or less than 60 min to prevent alterations in gene expression, which may occur due to protoplasting or sorting. After sorting, a small number of sorted cells should be collected and checked for fluorescence (step 3.4). As much buffer should be removed as possible from the supernatant to avoid any impact on the downstream library construction (step 3.3).
Construction of the RNA-seq library
For the construction of the RNA-seq library, we recommend using cells immediately after sorting to reduce the degradation of the RNA. It is not advisable to start with too many cells, as this may result in a poor-quality library due to inadequate reactions. The number of PCR cycles in step 4.7 and step 4.14 depends on the input amount of RNA/cDNA. The number of cycles can be increased when there is less input or lowered when there is more input. Therefore, it is recommended to take some of the mixed samples from step 4.7 and step 4.14 to run the real-time PCR with the same amplification procedure and to then determine the final number of cycles based on the results of the qPCR before the formal amplification of the prelibrary/library. In addition, before the purification step 4.8, the Ampure XP beads must be equilibrated at room temperature for at least 10 min and then vortexed well. The volume of beads in the purification step should not be increased above the 0.8:1 ratio. Otherwise, this will increase the carryover of primer dimers. In addition, one should avoid overdrying the beads in step 4.11 to prevent difficult resuspension. A qualified pre-library should have an average size of about 1.5-2 kb and a small amount of short (<500 bp) fragments. Abnormal size distributions or small size primer/adapter dimer peaks in libraries are indicators of poor quality, and these samples should be discarded or undergo further rounds of beads purification (step 4.15) (Figure 3E–F).
Limitations
This protocol can be applied to isolate cells from other plant tissues and other plant species. However, the cell isolation process is highly dependent on the preparation of the protoplasts. Some cell types are difficult to isolate, such as vascular cells and female sex cells, which are located in the interior of the tissue and/or are few in number. For cells for which it is difficult to prepare protoplasts, fluorescence-activated nuclei sorting (FANS)27 is an optional method that can be used. Meanwhile, using this protocol to obtain specific cell types by FACS depends on the availability of fluorescent marker lines. The lack of such marker lines limits the use of these methods in crops and horticulture plants. The application of high-throughput single-cell RNA-seq technology in crops will reveal novel cell-type-specific marker genes, which can be further used to develop cell-type marker lines and broaden the application capability of FACS-based cell-type RNA-seq and multi-omics studies.
The authors have nothing to disclose.
We set up this protocol in the single-cell multi-omics facility of the School of Agriculture and Biology, Shanghai Jiao Tong University, and were supported by the National Natural Science Foundation of China (Grant No. 32070608), the Shanghai Pujiang Program (Grant No. 20PJ1405800), and Shanghai Jiao Tong University (Grant Nos. Agri-X20200202, 2019TPB05).
0.22 µm strainer | Sorfa | 622110 | |
Agar | Yeasen | 70101ES76 | |
Agilent fragment analyzer | Aglient | Aglient 5200 | |
Agilent high-sensitivity DNA kit | Aglient | DNF-474-0500 | |
Ampure XP beads | BECKMAN | A63881 | |
Betaine | yuanye | S18046-100g | |
Bleach | Mr Muscle | FnBn83BK | 20% (v/v) bleach |
BSA | sigma | 9048-46-8 | |
CaCl2 | yuanye | S24109-500g | |
Cellulase R10 | Yakult (Japan) | 9012-54-8 | |
Cellulase RS | Yakult (Japan) | 9012-54-8 | |
Centrifuge tube (1.5 mL) | Eppendolf | 30121589 | |
DNase, RNase, DNA and RNA Away Surface Decontaminants | Beyotime | R0127 | |
dNTPs (10 mM) | NEB | N0447S | |
DTT (0.1 M) | invitrogen |
18090050 | |
Ethanol | Sinopharm Chemical Reagent Co., Ltd | 100092680 | |
FACS | BD FACS Melody | BD-65745 | |
FACS | Sony | SH800S | |
Filter tip (1000 µL) | Thermo Scientific | TF112-1000-Q | |
Filter tip (200 µL) | Thermo Scientific | TF140-200-Q | |
Filter tip (10 µL) | Thermo Scientific | TF104-10-Q | |
Filter tip (100 µL) | Thermo Scientific | TF113-100-Q | |
Fluorescent microscope | Nikon | Eclipse Ni-E | |
Four-Dimensional Rotating Mixer | Kylin -Bell | BE-1100 | |
Hemicellulase | sigma | 9025-56-3 | |
IS PCR primer | 5'-AAGCAGTGGTATCAACGCAGAG T-3' |
||
KAPA HiFi HotStart ReadyMix(2X) | Roche | 7958935001 | |
KCl | Sinopharm Chemical Reagent Co., Ltd | 7447-40-7 | |
Macerozyme R10 | Yakult (Japan) | 9032-75-1 | |
Magnetic separation stand | invitrogen | 12321D | |
Mannitol | aladdin | 69-65-8 | |
MES | aladdin | 145224948 | |
MgCl2 | yuanye | R21455-500ml | |
Microcentrifuges | Eppendorf | Centrifuge 5425 | |
Micro-mini-centrifuge | Titan | Timi-10k | |
MS | Phytotech | M519 | |
Nextera XT DNA Library Preparation Kit | illumina | FC-131-1024 | |
oligo-dT30VN primer | 5'-AAGCAGTGGTATCAACGCAGAG TACTTTTTTTTTTTTTTTTTTTTTTT TTTTTTTTTTVN-3' |
||
PCR instrument | Thermal cycler | A24811 | |
Pectolyase | Yakult (Japan) | 9033-35-6 | |
Plant marker lines | Nottingham Arabidopsis Stock Centre (NASC) | ||
Qubit 1x dsDNA HS Assay Kit | invitrogen | Q33231 | |
Qubit 2.0 fluorometer | invitrogen | Q32866 | |
RNase inhibitor | Thermo Scientific | EO0382 | |
RNase-free water | invitrogen | 10977023 | |
Solution A | 400 mM mannitol, 0.05 % BSA , 20 mM MES (pH5.7), 10 mM CaCl2, 20 mM KCl | ||
Solution B | 1 % (w/v)cellulase R10, 1 % (w/v) cellulase RS, 1 % (w/v)hemicellulase, 0.5 % (w/v)pectolyase and 1 % (w/v) Macerozyme R10 of in a fresh aliquot of solution A | ||
Sterile pestle | BIOTREAT | 453463 | |
Strainer (40 µm ) | Sorfa | 251100 | |
Superscript enzyme (200 U/µL) | invitrogen | 18090050 | |
SuperScript VI buffer (5x) | invitrogen | 18090050 | |
T0est tube (5 mL) | BD Falcon | 352052 | |
Thin-walled PCR tubes with caps (0.5 mL) | AXYGEN | PCR-05-C | |
Triton X-100 | Sangon Biotech | A600198-0500 | |
TSO primer | 5'-AAGCAGTGGTATCAACGCAGAG TACATrGrG+G-3' |
||
Vortex | Titan | VM-T2 |