1. Cell preparation
- Soak 12 mm round coverslips in absolute ethanol, and place them vertically in the wells of a 24-well plate.
- Remove the cover, and expose the multi-well plate to ultraviolet radiation for 15 min.
- Position the coverslips horizontally, and wash them with Dulbecco's Modified Eagle Medium (DMEM).
- Seed a low passage number of pancreatic cells. The amount should be adjusted to obtain 50%-75% confluency on the day of fixation16.
NOTE: It is recommended to seed 2.5 × 10⁴ PANC-1 or 4 × 10⁴ AR42J cells per well to fixate the cells after 3 days. - Culture the cells in DMEM containing 10% fetal bovine serum, 100 U/mL penicillin, and 100 µg/mL streptomycin in an incubator at 37 °C under a humidified atmosphere with 5% carbon dioxide (CO2).
NOTE: For PANC-1 cells, it is recommended to incubate the cells for 2 days between cell seeding and the following steps. After this time, the cells can be transfected, treated, or fixated. This protocol exemplifies the treatment with gemcitabine in non-transfected PANC-1 cells and the differentiation and PP242 treatment for non-transfected AR42J cells.
2. Treating the cells
- Gemcitabine treatment for PANC-1 cells
- Prepare a solution of 1 µg/µL gemcitabine in DMEM 2 days after seeding. Treat each well with 2.6 µL of the 1 µg/µL gemcitabine solution to achieve a final dilution of 20 µM.
- Incubate the cells for 24 h in the incubator.
- AR42J differentiation and PP242 treatment
- Prepare a solution of 4 µg/mL dexamethasone in DMEM.
- Treat each well with 4.9 µL of 4 µg/mL dexamethasone solution to obtain a final dilution of 100 nM.
- Incubate the cells for 48 h in the incubator.
- Remove the medium, and treat each well with 0.5 µL of 1 mM PP242 to obtain a final dilution of 1 µM.
- Incubate the cells for 2 h in the incubator.
3. Fixing and permeabilizing the cells
- Prepare a 24-well plate with cold methanol and a 6-well plate with cold phosphate-buffered saline (PBS; 137 mM NaCl, 2.7 mM KCl, 8 mM Na2HPO4, 2 mM KH2PO4). Maintain them on ice.
- Take each coverslip with tweezers, wash it twice in PBS, and incubate for 6 min in methanol.
4. Blocking the cells
- Wash each coverslip twice in PBS, and incubate for 1 h in 10% fetal bovine serum in PBS (blocking solution).
NOTE: In this step, the protocol might be paused. The coverslips can be stored overnight in the fridge in the blocking solution, and the protocol can be continued the following day.
5. Incubating the coverslips with the primary antibody
- Prepare a 1:1,000 solution of anti-LC3 in the blocking solution, and maintain it on ice.
- Place a piece of laboratory sealing film over the multi-well lid.
- Place one drop (25 µL) per coverslip of anti-LC3 solution over the sealing film.
- Take each coverslip with tweezers, and place it over the primary antibody drop, taking care that the cell side is in contact with the solution.
- Prepare a humid chamber by placing a humid piece of paper into a flat-bottom plastic box.
- Place the multi-well plate into the humidity chamber, cover it with foil, and incubate overnight in the fridge.
6. Incubating the coverslips with the secondary antibody
- Remove the multi-well plate from the humidity chamber, and place the coverslips back in the multi-well plate.
- Perform three washes with PBS.
- Prepare a solution of fluorescently labeled anti-rabbit with a dilution of 1:800 in the blocking solution, and maintain it on ice protected from light.
- Place a sealing film piece over the multi-well lid.
- Place a drop (25 µL) per coverslip of anti-rabbit solution over the sealing film.
- Take each coverslip with tweezers, and place it over the primary antibody drop, taking care that the cell side is in contact with the solution.
- Incubate the multi-well plate in the humidity chamber for 2 h at room temperature (RT) protected from light.
7. Staining the cells with 4′ ,6-diamidino-2-phenylindole (DAPI)
- Remove the multi-well plate from the humidity chamber, and place the coverslips back in the multi-well plate.
- Perform three washes with PBS.
- Prepare a 300 nM solution of DAPI in PBS (protected from light).
- Incubate each coverslip with the DAPI solution for 10 min.
- Perform three washes with PBS. Maintain the multi-well plate protected from light.
8. Montage
- Prepare two beakers with water and a piece of paper.
- Place one drop (10 µL) per coverslip of a polyvinyl alcohol-Bis(trimethylaluminum)-1,4-diazabicyclo[2.2.2]octane adduct (PVA-DABCO) solution on a slide.
NOTE: PVA-DABCO is prepared by combining 0.25 M DABCO, 10% W/V PVA, 20% glycerol, and 50% Tris HCl (1.5 M, pH 8.8) in ultrapure water. - Take each coverslip with tweezers, wash it in each water beaker, dry it off in the paper, and place it over the PVA-DABCO drop (with the cells in contact with the solution).
- Let it dry overnight, protected from light.
9. Confocal microscopy viewing and image capture
- Visualize the coverslips in an inverted confocal microscope using an objective of around 63x17.
- Capture representative images of the labeled cells.
10. Quantifying the LC3 dots
- Drag and drop each image file containing the captured channels, such as ".czi", into the ImageJ (FIJI) screen to open. Click on Ok in the dialog box, and close the Console window.
- From the Image tab, select Color > Split Channels.
- Close the images corresponding to the channels other than the LC3 image.
- From the Image tab, select Adjust > Color Balance
- Move the Maximum slider to the left until the image is saturated to visualize the cell contours.
- Draw the cell outline with the Freehand Selection tool.
- Click on the Reset button to reset the color adjustment.
- From the Edit tab, select Cut to cut the selected item.
- Close the image without saving it.
- From the Edit tab, select Paste.
- In the Analyze menu, choose the tool 3D Objects Counter.
- Set the threshold. In the example provided in this study, the threshold is set at 2,000.
- Set the size filter. In this study, it is set between 50 and 500.
- Be sure that the boxes Objects and Summary are marked.
- Click on Ok. The number of dots will be described as Objects Detected in the Summary.
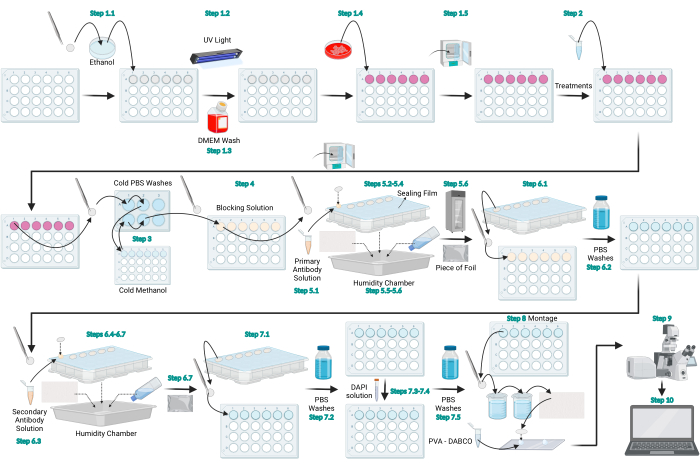
Figure 1: Schematic diagram of the LC3 immunofluorescence protocol. Schematic diagram that represents the general protocol provided for LC3 immunofluorescence. Figure created with BioRender.com. Please click here to view a larger version of this figure.
This protocol performs immunofluorescence of LC3 in pancreatic cell lines to determine the autophagy levels in different conditions. The outcome of this experiment was the obtention of cellular images from the red and blue channels, corresponding to LC3 and DAPI. The LC3 images indicate the cellular distribution of this protein, whereas the DAPI shows the nuclear localization. Figure 2A shows a representative image of the immunofluorescence of LC3 and its merge with DAPI staining in PANC-1 cells under basal or gemcitabine treatment conditions. A set of images of LC3 staining was analyzed using the tool 3D Objects Counter in FIJI. Using this software, the amount of LC3 dots per cell was quantified. The bar graph in Figure 2B shows the results of LC3 dot quantification in PANC-1 cells under basal versus gemcitabine treatment conditions. In this graph, the LC3 dots significantly increased under gemcitabine treatment, with the number of LC3 dots directly indicating the autophagic activity. We also previously demonstrated that gemcitabine triggers autophagy in pancreatic cancer cells12. Overall, the method presented in this article allows the detection of the level of increase in autophagy activation induced by gemcitabine in these cells.
While this protocol focuses on using LC3 immunofluorescence to determine autophagic activity in pancreatic cancer cells, it could potentially be applied to other cell lines, including more physiologically relevant models. To test the method's efficacy in assessing physiological responses, the AR42J cell line was used. Although these cells are derived from a rat exocrine pancreas tumor, they can be differentiated into exocrine cells with glucocorticoid stimulation, thus making them a suitable pancreatic model8,14,18. The AR42J cells were differentiated with 100 nM dexamethasone treatment for 48 h, followed by treatment with the mTOR inhibitor PP242 to induce autophagy15. The obtained results are presented in Figure 3, which shows a significant increase in the number of LC3 dots per cell under the PP242 treatment.
Thus far, we have demonstrated that the presented method is effective for assessing autophagic activity in both cancer cells and a more physiological model. However, it is important to note that minor deviations from the presented protocol could result in uninterpretable results.
Figure 4A shows a representative image from a suboptimal experiment in which too many cells were seeded on the coverslips, and excessive confluence was obtained. This kind of experiment might be uninterpretable for diverse reasons. Firstly, the cellular types mentioned in this work are derived from the exocrine pancreas, where the cells are grouped in acini. Under an excessive confluence, these cells tend to pile up and grow on top of each other (such as cell 1 and cell 2 in Figure 4A, which are above cell 3 and cell 4). This phenomenon makes it practically impossible to know which cell the LC3 dots belong to, thus making it very difficult to estimate the number of dots per cell. On the other hand, cells at high confluency tend to be stressed, which triggers autophagy. As a result, the differences in autophagic levels between the control and treated cells might decrease due to an increase in the background autophagic activity.
In Figure 4B, a representative image from another kind of suboptimal experiment is shown in which the cells were fixed with paraformaldehyde instead of methanol. While this fixation method is generally effective for preserving a variety of proteins, it is not suitable for LC3, as the resulting image does not accurately reflect its true distribution. This technical mistake might make it impossible to find differences between low and high autophagic levels.
Generally, cell lines can be treated, transfected, or fixed 1 day after seeding. Nevertheless, it is crucial to mention that, in the case of PANC-1 cells, it is necessary to wait for 2 days after seeding to ensure the complete adherence of the cells to the glass coverslips before proceeding with the subsequent steps of the experiment. Figure 4C shows a representative image from an experiment in which the cells were treated with gemcitabine just 1 day after seeding. From the figure, it can be observed that the cells in this experiment had a round shape. This morphology decreased the relation between the cytoplasm and nucleus, making it difficult to understand the intracellular distribution of LC3 and to discriminate between low and high autophagic levels. It is important to note that AR42J does not have this problem, and they are ready to be treated or fixed on the day following the seeding.
Another suboptimal outcome could be obtained when the time of methanol fixation is varied. Shorter times of fixation might cause incomplete fixation, as represented in Figure 4D, where the cells were fixed for 3 min. Incomplete fixation can interfere with proper LC3 immunolabeling, leading to unclear images and suboptimal quantification.
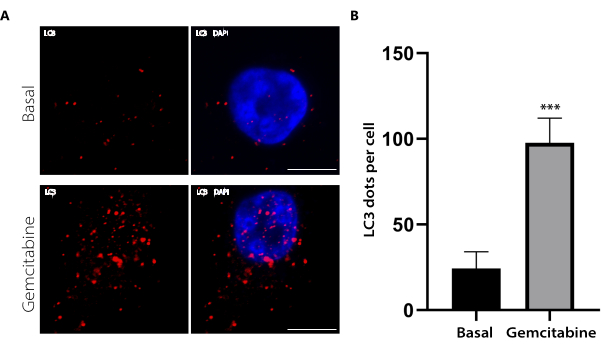
Figure 2: LC3 immunofluorescence in PANC-1 cells under basal or gemcitabine conditions and LC3 dot quantification. The PANC-1 cells were either treated with 20 µM gemcitabine for 24 h or left untreated and then immunolabelled with anti-LC3. (A) Representative images of each condition are shown. Scale bar: 10 µm. (B) The bar graph represents the means and standard errors of the means (SEM) of the LC3 dots per cell for each condition. N = 10 cells per condition from three independent experiments. *** p < 0.001 by a Student's t-test. Please click here to view a larger version of this figure.
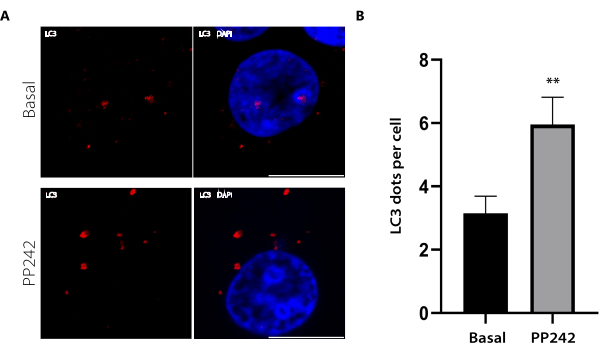
Figure 3: LC3 immunofluorescence in AR42J cells under basal or PP242 conditions and LC3 dot quantification. The AR42J cells were differentiated with 100 nM dexamethasone for 48 h and then either treated with 1 µM PP242 for 2 h or left untreated, followed by immunolabelling with anti-LC3. (A) Representative images of each condition are shown. Scale bar: 10 µm. (B) The bar graph represents the means and standard errors of the means (SEM) of the LC3 dots per cell for each condition. N = 10 cells per condition from three independent experiments. ** p < 0.01 by a Student's t-test. Please click here to view a larger version of this figure.
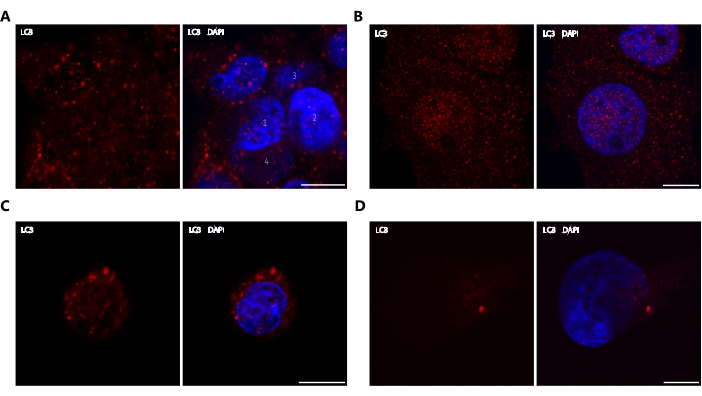
Figure 4: Suboptimal experiments. Representative images of LC3 immunofluorescence in suboptimal experiments are shown. Scale bar: 10 µm. (A) Excess confluence: 7 × 10⁴ PANC-1 cells were seeded, treated with gemcitabine, and immunolabelled with anti-LC3. Four cells are marked to show that cell 1 and cell 2 are above cell 3 and cell 4. (B) PFA fixation: PANC-1 cells were treated with gemcitabine, fixated with PFA, and immunolabelled with anti-LC3. (C) Incomplete stretch: PANC-1 cells were treated with gemcitabine the day after seeding and immunolabelled with anti-LC3. (D) Incomplete fixation: PANC-1 cells were treated with gemcitabine, fixated with methanol for 3 min, and immunolabelled with anti-LC3. Please click here to view a larger version of this figure.
