Provided is a protocol for developing a real-time recombinase polymerase amplification assay to quantify initial concentration of DNA samples using either a thermal cycler or a microscope and stage heater. Also described is the development of an internal positive control. Scripts are provided for processing raw real-time fluorescence data.
It was recently demonstrated that recombinase polymerase amplification (RPA), an isothermal amplification platform for pathogen detection, may be used to quantify DNA sample concentration using a standard curve. In this manuscript, a detailed protocol for developing and implementing a real-time quantitative recombinase polymerase amplification assay (qRPA assay) is provided. Using HIV-1 DNA quantification as an example, the assembly of real-time RPA reactions, the design of an internal positive control (IPC) sequence, and co-amplification of the IPC and target of interest are all described. Instructions and data processing scripts for the construction of a standard curve using data from multiple experiments are provided, which may be used to predict the concentration of unknown samples or assess the performance of the assay. Finally, an alternative method for collecting real-time fluorescence data with a microscope and a stage heater as a step towards developing a point-of-care qRPA assay is described. The protocol and scripts provided may be used for the development of a qRPA assay for any DNA target of interest.
Quantitative nucleic acid amplification is an important technique for detection of environmental, foodborne, and water-borne pathogens as well as for clinical diagnostics. Real-time quantitative polymerase chain reaction (qPCR) is the gold standard method for sensitive, specific, and quantitative detection of nucleic acids, e.g., for HIV-1 viral load testing, detection of bacterial pathogens, and screening for many other organisms1–3. During real-time qPCR, primers amplify pathogen DNA in cycles, and a fluorescent signal is generated that is proportional to the amount of amplified DNA in the sample at each cycle. A sample containing an unknown concentration of pathogen DNA may be quantified using a standard curve that relates the initial DNA concentration of standard samples and the time at which the fluorescent signal reaches a certain threshold (i.e., the cycle threshold, or CT).
Because real-time qPCR requires expensive thermal cycling equipment and several hours to receive results, alternative isothermal amplification techniques, such as recombinase polymerase amplification (RPA), have been developed4. These platforms generally provide results faster and amplify nucleic acids at a lower, single temperature, which may be accomplished with less expensive, simpler equipment. RPA, which is particularly attractive for point-of-care applications, amplifies DNA in minutes, requires a low amplification temperature (37 °C), and remains active in the presence of impurities5,6. RPA assays have been developed for a wide range of applications, including food analysis, pathogen detection, cancer drug screening, and detection of biothreat agents7–12. However, use of RPA for quantification of nucleic acids has been limited13,14.
In previous work, it was shown that real-time quantitative RPA (qRPA) is feasible15. Here, a more detailed protocol is provided for using real-time quantitative RPA to quantify unknown samples using a standard curve, a method that is analogous to quantification using qPCR. This protocol describes how to perform an RPA reaction on a thermal cycler to detect HIV-1 DNA as a proof-of-concept, as well as how to develop an internal positive control (IPC) to ensure the system is functioning properly. Data collection using a thermal cycler or microscope and data analysis for constructing a standard curve using training data is also detailed. Finally, the method for quantifying unknown samples using the standard curve with a custom script is demonstrated. This qRPA technique enables quantification of samples with unknown concentrations and has many advantages over traditional real-time qPCR.
1. Program the Thermal Cycler for Real-time qRPA Reactions
2. Prepare for HIV-1 qRPA Experiments
3. Assemble an HIV-1 qRPA Standard Curve
4. Develop an Internal Positive Control
5. Building a Standard Curve from Multiple Experiments
6. Assay Validation and Quantification of Unknown Samples Using the Standard Curve
7. Preparation for Data Collection Using a Fluorescence Microscope and a Heated Chip
8. Data Collection and Analysis Using a Fluorescence Microscope
Before selecting a sequence to serve as the IPC in qRPA experiments with target (HIV-1) DNA, internal positive control (IPC) candidates are generated and screened for their ability to amplify in qRPA reactions without HIV-1 DNA present. IPC candidates are longer than the target (HIV-1) DNA to prevent IPC formation from out-competing HIV-1 amplicon formation. As shown in Figure 2A, the generation of two C. parvum IPC candidates was verified by the presence of 415 and 435 bp bands using gel electrophoresis. In qRPA reactions, the shorter IPC candidate exhibited little amplification (Figure 2B), while the longer candidate consistently amplified when a total of 104 and 105 copies were present (Figure 2C). Thus, the longer candidate was chosen to be the IPC for HIV-1 qRPA experiments.
Real-time qRPA may be performed using the target of interest alone or using both the target and the IPC. Figure 3 shows an experiment on the thermal cycler using both HIV-1 DNA and the C. parvum IPC. In this experiment, 2.6 x 10⁴ copies of IPC DNA were added to each reaction, a concentration close to the IPC limit of detection, to avoid affecting the limit of detection of HIV-1 target DNA. As demonstrated in Figure 3A, which displays HEX fluorescence data corresponding to real-time HIV-1 DNA generation, the time at which detectable amplification begins is inversely proportional to the initial target concentration. Thus, amplification is apparent earlier for high concentrations of HIV-1 DNA and later for low concentrations of HIV-1 DNA. In contrast, detectable amplification of IPC DNA begins at approximately the same time because the starting IPC concentration is the same in all samples, as shown in Figure 3B, which displays FAM fluorescence data corresponding to IPC DNA generation during the same experiment. The rate of fluorescence generation from the IPC is inversely proportional to the concentration of HIV-1 DNA due to competition during amplification.
With the goal of developing a field-operable fluorescence reader with qRPA reactions, qRPA experiments may be performed on an upright fluorescence microscope with a stage heater and 1-Channel Precision High Stability temperature controller. Figure 4A and 4B display HEX and FAM fluorescence data collected on a microscope. Data collected on the microscope using laser-cut chips demonstrate slight variability in baseline fluorescence and crests and troughs that may be due to photobleaching. However, the script determines the cycle threshold using the rate of change of fluorescence during the initial amplification period, which is unaffected by baseline fluorescence or variability in fluorescence after the initial amplification has occurred. As seen in Figure 4C, the standard curve built from this experiment has an r2 coefficient of 0.990. Notably, the IPC is amplified only for low concentrations of HIV-1 DNA. Although this behavior differs from experiments performed on the thermal cycler, all samples are still classified as valid using this method.
Data from multiple experiments using known target concentrations may be compiled to construct a standard curve, which may then be used to assess assay performance or quantify samples with unknown concentrations. Figure 5 shows the data from five experiments and an exponential standard curve generated using the script “JoVE_qRPA_standard_curve.m”, relating the initial HIV-1 target concentration to the time at which detectable amplification began. Figure 5 used 5 separate experiments, each containing 2 qRPA reactions at each template concentration to build a standard curve. Note that the exponential fit has a high r2 coefficient of 0.959. The standard curve was then used to predict the concentrations of additional samples with known concentrations for assay validation using the script “JoVE_qRPA_validation_and_quantification.m” script. Table 1 shows the quantification results for 5 additional experiments using the standard curve in Figure 5. Note that the algorithm correctly classified all samples containing HIV-1 DNA as positive and 9 out of 10 of the no-target-control samples as negative. In addition, the average predicted concentration was within one order of magnitude of the correct concentration and the standard deviation for predicted concentrations was less than 0.5 log10 (copies per reaction).
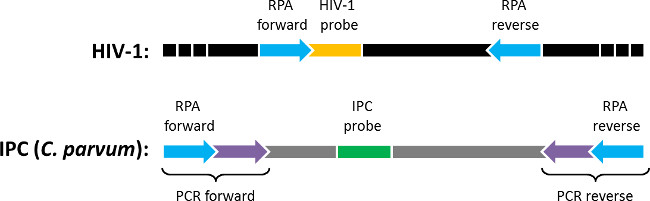
Figure 1: Block diagram of quantitative RPA DNA targets. The qRPA assay amplifies two DNA sequences flanked by identical sequences to which primers bind (“RPA forward” and “RPA reverse”). The amplified sequences are 1) a sequence within the HIV-1 genome (“HIV-1”) that is detected with the “HIV-1 probe” and 2) an internal positive control sequence (“IPC (C. parvum)”) included in each reaction that is detected with the “IPC probe.” The IPC was generated via PCR using the Cryptosporidium parvum genome as a template and primers (“PCR forward” and “PCR reverse”) that contain a region complementary to C. parvum (purple) and a region complementary to HIV-1 (blue). Figure originally published in Analytical Chemistry 2014, reprinted here with permission9.
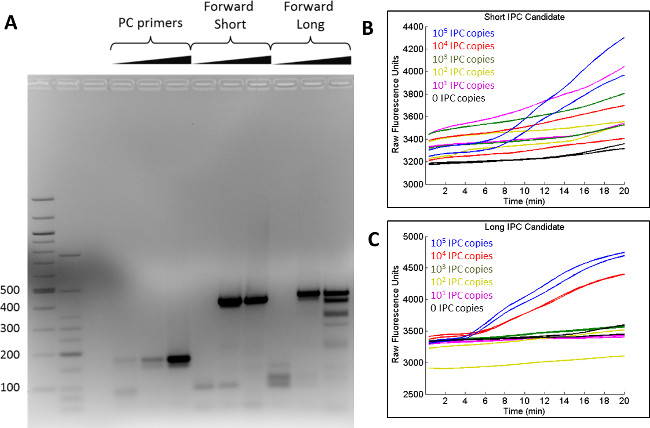
Figure 2: Screening of IPC candidates. (A) Two IPC candidates (‘Forward Short’ and ‘Forward Long’) and a known PCR positive control sequence were generated using PCR and visualized on an agarose gel, where 415 bp and 435 bp bands were visible. (B) The short IPC candidate exhibited little amplification during real-time RPA, while (C) the longer IPC candidate amplified consistently when a total of 104 and 105 copies were present. Figure originally published in Analytical Chemistry 2014, reprinted here with permission9. Please click here to view a larger version of this figure.
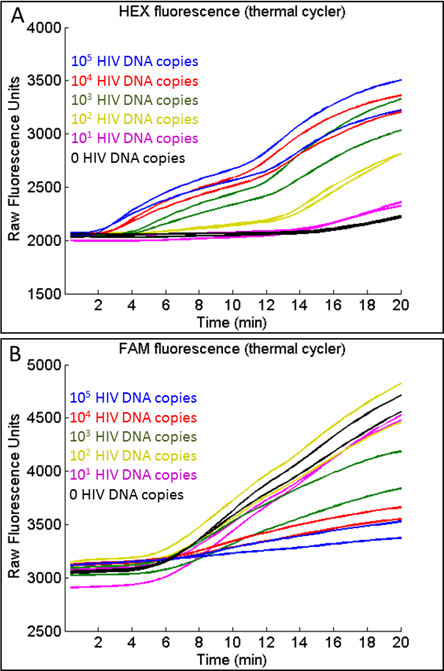
Figure 3: Typical raw fluorescence data generated during co-amplification of HIV-1 DNA and IPC on a thermal cycler. (A) For HIV-1, the onset of detectable amplification, shown by an apparent increase in HEX fluorescence, occurs earlier for high concentrations of HIV-1 DNA. (B) For the IPC, the onset of detectable amplification, shown by an apparent increase in FAM fluorescence, occurs at approximately the same time regardless of the HIV-1 DNA concentration. However, the rate of FAM fluorescence generation is inversely proportional to the amount of HIV-1 DNA present due to competition. Figure originally published in Analytical Chemistry 2014, reprinted here with permission9.
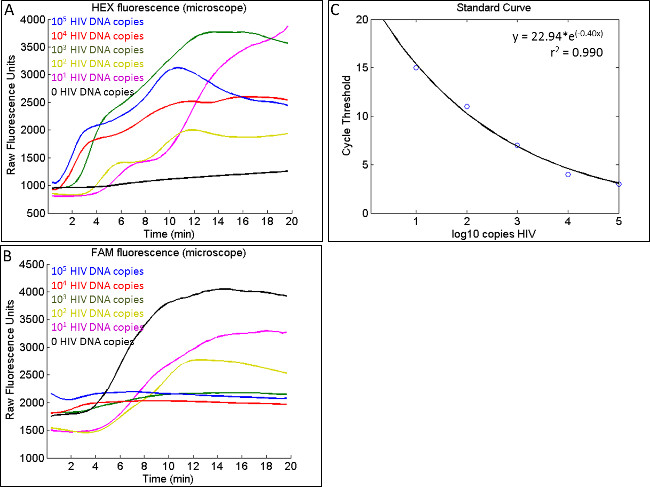
Figure 4: Typical raw fluorescence data generated during co-amplification of HIV-1 DNA and IPC on a microscope. (A) Similar to data generated on the thermal cycler, the onset of detectable HIV-1 amplification, shown by an apparent increase in HEX fluorescence, occurs earlier for high concentrations of HIV-1 DNA. (B) IPC amplification on the microscope, shown by FAM fluorescence, is apparent for low HIV-1 DNA concentrations but not always apparent in samples with high HIV-1 DNA concentrations. (C) A standard curve can be built using the JoVE_standard_curve.m scripts that yields a high r2 coefficient.
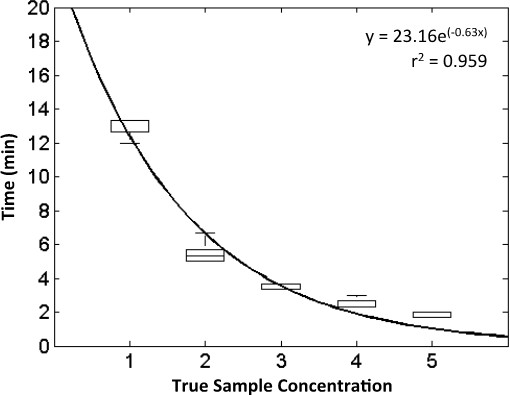
Figure 5: Typical standard curve for HIV-1. Using the JoVE_standard_curve.m script, raw HEX fluorescence data generated during HIV-1 amplification is processed to build a standard curve, which may be used to predict the HIV-1 DNA concentration of unknown samples. This standard curve (z = 1) was generated using data from 5 experiments, in which 6 concentrations were tested using 2 replicates at each concentration. All concentrations are given in log10 copies. Figure originally published in Analytical Chemistry 2014, reprinted here with permission9.
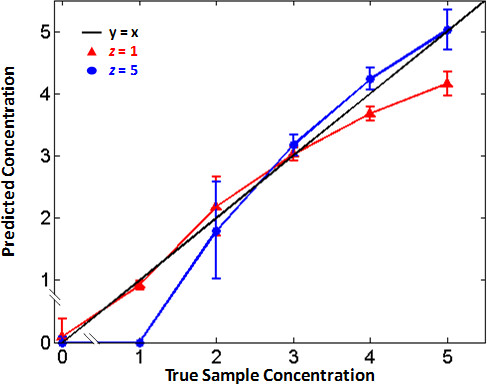
Figure 6: Algorithm tunability. Adjusting the algorithm parameters changes the standard curve used to predict the concentration of unknown samples. The JoVE_validation_and_quantification.m script was used to predict the concentration of unknown samples using z = 1 (red) and z = 5 (blue). All concentrations are given in log10 copies. Predictions are more accurate for low DNA concentrations when z = 1; predictions are more accurate for high DNA concentrations when z = 5. By adjusting the algorithm parameters, the qRPA standard curve may be tuned according to clinical needs. Figure originally published in Analytical Chemistry 2014, reprinted here with permission9.
Sample Concentration | Average Predicted Concentration | Standard Deviation | Percent of Samples Identified as Positive |
No target controls | 0.1 | 0.3 | 10% |
1 | 0.9 | 0.1 | 100% |
2 | 2.2 | 0.5 | 100% |
3 | 3 | 0.1 | 100% |
4 | 3.7 | 0.1 | 100% |
5 | 4.2 | 0.2 | 100% |
Table 1: HIV-1 qRPA assay validation. Using the standard curve in Figure 4, the JoVE_validation_and_quantification.m script was used to predict the concentrations (in log10 copies) of samples for 5 additional experiments. Table originally published in Analytical Chemistry 2014, reprinted here with permission9.
In order to obtain meaningful quantification data using the MATLAB algorithm, the user must select appropriate input values when prompted. After initiating each script in Sections 5 and 6, all input variables are automatically solicited in the command window and outputs are automatically generated. In Section 5.7 the user is prompted to select a slope threshold. The value of the slope threshold affects the square of the correlation coefficient (r2) of the fit. When using raw fluorescence data exported from a thermal cycler, values between 2.0 and 5.0 tend to yield a high r2 coefficient. In Section 5.8 the user must designate the number of standard deviations above the background to set the positive threshold. To score a sample as positive or negative, the script automatically determines the difference Δsample between the maximum and minimum fluorescence for each sample using the raw fluorescence data exported from the thermal cycler. It calculates the average difference Δbackground and standard deviation σbackground for all no-target control samples. A sample is considered positive if Δsample is more than z × σbackground above Δbackground. In Section 5.10 the user decides whether to use the default threshold or set a new threshold. If the user wishes to set a new threshold, determine the new threshold experimentally by performing 3 experiments each containing 12 RPA reactions without any HIV-1 DNA present. Set the threshold at the average increase in fluorescence intensity from these experiments plus 3 standard deviations. After completing Section 6, the script JoVE_qRPA_validation_and_quantification.m automatically returns the estimated DNA concentration for each qRPA reaction (in log10 copies). If the script determines that no HIV-1 DNA was present in the sample, the estimated concentration is listed as either “Negative for HIV” or “Invalid,” depending on whether the fluorescent signal for the internal positive control exceeded the threshold (z × σbackground + Δbackground). If the user is validating the standard curve with known sample concentrations, the script will also return an additional table similar to that of Table 1.
In order to develop a real-time RPA assay that provides accurate quantification, experimental consistency is crucial. For example, use the same primer and probe aliquots for both the standard curve and validation experiments. Also avoid freeze-thaw cycles by storing the primer and probe aliquots at 4 °C between experiments rather than -20 °C. The template aliquots used for the standard curve and validation experiments are stored in the same manner. RPA enzyme pellets and reagents from the same lot are used according to the manufacturer recommendations. Lastly, because RPA lacks true ‘cycles’ to precisely control the rate of amplification, standardization of user steps is absolutely imperative. When assembling reactions, the user must always follow the same steps in the same order, spending approximately the same amount of time on each step. Reactions must always be mixed gently with a new pipette tip, and bubbles must always be eliminated. Before amplification, reactions must be held at a consistent temperature, and the thermal cycler or microscope software must always be prepared before loading reactions to avoid any amplification at sub-optimal temperatures that could influence quantification. Any variation in the initial reaction conditions may lead to inconsistency in experimental outcomes.
When using a microscope to collect data, additional variables must be controlled to minimize variation in fluorescence intensity. All reactions must be placed in the same region on the stage warmer, and the microscope must be focused on the same region of the well for every sample. Even if these practices are followed, fluorescence data collected on a microscope may exhibit variability due to local bright spots that naturally form during RPA reactions, bubble formation within the reaction chambers, or photobleaching resulting from repeated exposure to excitation light. The influence of these variables is evident in fluorescence data collected on the microscope (Figures 4A and 4B), which demonstrate baseline variability, peaks, and troughs. These features are absent from the fluorescence data collected on the thermal cycler (Figures 3A and 3B). Ultimately, data collection on the microscope is for proof-of-principle purposes only and the final assay will be implemented on a field-operable fluorescence reader with more precise geometry and software control that minimizes these variables.
Another important aspect of the qRPA assay development process is consistency in data processing. The protocol described in the methods section uses scripts to process raw fluorescence data (stored in a spreadsheet file) collected from a thermal cycler or microscope. All experiments used to build the standard curve must be formatted identically. When using a thermal cycler to collect data, the same plate layout must be used, and data from wells that do not contain RPA reactions must not be exported. When using a microscope to collect data, the format of the data must match the format of the data automatically exported from the thermal cycler. For example, the no-target-control data must be in cells C2:C61, and data for increasing template concentrations must be in cells D2:D61, E2:E61, etc. If there are multiple replicates of each concentration in an experiment, the 2nd replicate dilution series must be ordered left to right from no target control (NTC) to highest concentration and saved in the columns immediately to the right of the 1st replicate dilution series. For example, in the plate layout used in Section 1.2 with 2 replicates for each sample, fluorescence data for the 1st replicate of each sample in the dilution series must be saved in cells C2:H61 and fluorescence data for the 2nd replicate of each sample in the dilution series must be saved in cells I2:N61. For the plate layout used in Section 1.2, this is the default formatting when exporting data from the thermal cycler software to a spreadsheet.
Representative data provided from HIV-1 qRPA experiments demonstrate proof-of-concept support that RPA may be used for quantification of nucleic acid concentration in unknown samples. Clinically useful HIV-1 viral load tests have a clinical range of at least 4 orders of magnitude, a precision of 0.5 log10 copies, and a limit-of-detection of at least 200 copies19,20. The HIV-1 DNA assay described meets these criteria and is most accurate at low concentrations, as shown in Table 1. Therefore, with the inclusion of a reverse transcriptase step, these results suggest that an HIV-1 RT-RPA assay may have the potential to measure HIV-1 viral load in clinical samples. When developing a qRPA assay, adjusting the algorithm parameters may tune the sensitivity and linear dynamic range depending on clinical needs. Figure 6 shows that adjusting z (a parameter that determines the threshold for positive samples) can influence the sensitivity and accuracy at low and high target concentrations. Furthermore, it may be possible to increase the resolution and accuracy of quantification by incubating reactions at a lower temperature or using less magnesium acetate, thereby decreasing the rate of amplification.
This proof of concept qRPA assay can be used to quantify the concentration of samples containing HIV-1 DNA. The qRPA assay described in this manuscript includes detailed instructions on how to assemble real-time RPA reactions, develop and screen an IPC, and process raw fluorescence data to build a standard curve that can be used to quantify unknown samples. With the detailed instructions included, this protocol may be adapted to quantify DNA concentration in a wide variety of samples.
The authors have nothing to disclose.
This research was funded by a grant from the Bill & Melinda Gates Foundation through the Grand Challenges in Global Health Initiative.
qRPA Assay | |||
Supply | Vendor | Part number | Comments/Description |
HIV-1 forward primer | Integrated DNA Technologies | custom DNA oligos | 5’-TGG CAG TAT TCA TTC ACA ATT TTA AAA GAA AAG G-3’ |
HIV-1 reverse primer | Integrated DNA Technologies | custom DNA oligos | 5’-CCC GAA AAT TTT GAA TTT TTG TAA TTT GTT TTT G-3’ |
HIV-1 probe | BioSearch Technologies | custom DNA oligos | 5’- TGC TAT TAT GTC TAC TAT TCT TTC CCC [SIMA/HEX] GC [THF] C [dT-BHQ1] GTA CCC CCC AAT CCC C -3’ |
IPC probe | BioSearch Technologies | custom DNA oligos | 5’-AGG TAG TGA CAA GAA ATA ACA ATA CAG GAC [FAM] T [THF] T [dT-BHQ1] GGT TTT GTA ATT GGA A -3’ |
RPA exo reagents (pellets, rehydration buffer, magnesium acetate | TwistDx | TwistAmp exo | |
PCR tube strips | BioRad | TLS0801 | |
PCR flat cap tube strips | BioRad | TCS0803 | |
Micro-seal adhesive | BioRad | 558/MJ | |
HIV-1 target (pHIV-IRES- eYFPΔEnvΔVifΔVpr) | custom plasmid, see: Segall, H. I., Yoo, E. & Sutton, R. E. Characterization and detection of artificial replication-competent lentivirus of altered host range. Molecular Therapy 8, 118–129, doi:10.1016/S1525-0016(03)00134-5 (2003). | ||
Human male genomic DNA | Applied Biosystems | 360486 | |
96 well cold-block | Cole Parmer | EW-36700-48 | |
Thermal cycler | BioRad | CFX96 | |
MiniFuge | VWR | 93000-196 | |
Vortex | VWR | 58816-121 | |
Tris buffer 1.0 M, pH 8.0 | EMD Millipore | 648314 | |
EDTA 0.5 M, pH 8.0 | Promega | V4321 | |
Nuclease free water | Ambion | AM9937 | |
IPC Development | |||
Supply | Vendor | Part number | Comments/Description |
Cryptosporidium parvum IPC template | Waterborne Inc | P102C | It is also possible to order a double stranded synthetic target from IDT if the user is unequipped to work with C. parvum (a BSL-2 infectious agent). PCR and RPA primers for C. parvum were designed using GenBank accession number AF115377.1 |
PCR long forward primer | Integrated DNA Technologies | custom DNA oligos | 5’-TGG CAG TAT TCA TTC ACA ATT TTA AAA GAA AAG G/ ATC TAA GGA AGG CAG CAG GC-3’ |
PCR long reverse primer | Integrated DNA Technologies | custom DNA oligos | 5’- CCC GAA AAT TTT GAA TTT TTG TAA TTT GTT TTT G/ TGC TGG AGT ATT CAA GGC ATA -3’ |
Phusion High-Fidelty DNA Polymerase | New England Biolabs | M0530S | |
Qiaquick Gel Extraction Kit | Qiagen | 28704 | |
TAE 10X buffer | EMD Millipore | 574797 | |
Agarose | Sigma Aldrich | A9539 | |
Microscope Experiments | |||
Supply | Vendor | Part number | Comments/Description |
Upright fluorescence microscope | Zeiss | Zeiss Imager.J1 | |
Stage heater | Bioscience Tools | TC-GSH | |
1-Channel Precision High Stability Temperature Controller | Bioscience Tools | TC-1100S | |
FAM/GFP filter cube | Zeiss | filter set 38 (000000-1031-346) | excitation BP 470/40 nm, emission BP 520/50 nm |
HEX filter cube | Chroma | 49014 | excitation BP 530/30 nm, emission BP 575/40 nm |
Laser cutter | Engraver's Network | VLS3.60 | |
1/8" black acrylic | McMaster Carr | 8505K113 | |
1.5 mm clear acrylic | McMaster Carr | PD-72268940 | |
Super glue | Office Depot | Duro super glue | |
PCR grade mineral oil | Sigma Aldrich | M8662-5VL | |
Data Analysis | |||
Software | Vendor | ||
Microsoft Excel | Microsoft | ||
MATLAB | MATLAB | ||
MATLAB script: "JoVE_qRPA_standard_curve.m” | Included in SI | ||
MATLAB script: "JoVE_qRPA_validation_and_quantification.m” | Included in SI | ||
MATLAB script: "JoVE_real_time_intensity_to_excel.m” | Included in SI | ||
Adobe Illustrator | Adobe | ||
JoVE_qRPA_well.ai | Included in SI | ||
JoVE_qRPA_base.ai | Included in SI | ||
AxioVision software | Zeiss | ||
JoVE_AxioVision_Script.ziscript | Included in SI |