Summary

Multimodal Imaging and Spectroscopy Fiber-bundle Microendoscopy Platform for Non-invasive, In Vivo Tissue Analysis

Published: October 17, 2016
doi:

Summary

The assembly and use of a multimodal microendoscope is described which can co-register superficial tissue image data with tissue physiological parameters including hemoglobin concentration, melanin concentration, and oxygen saturation. This technique can be useful for evaluating tissue structure and perfusion, and can be optimized for individual needs of the investigator.

Abstract

Recent fiber-bundle microendoscopy techniques enable non-invasive analysis of in vivo tissue using either imaging techniques or a combination of spectroscopy techniques. Combining imaging and spectroscopy techniques into a single optical probe may provide a more complete analysis of tissue health. In this article, two dissimilar modalities are combined, high-resolution fluorescence microendoscopy imaging and diffuse reflectance spectroscopy, into a single optical probe. High-resolution fluorescence microendoscopy imaging is a technique used to visualize apical tissue micro-architecture and, although mostly a qualitative technique, has demonstrated effective real-time differentiation between neoplastic and non-neoplastic tissue. Diffuse reflectance spectroscopy is a technique which can extract tissue physiological parameters including local hemoglobin concentration, melanin concentration, and oxygen saturation. This article describes the specifications required to construct the fiber-optic probe, how to build the instrumentation, and then demonstrates the technique on in vivo human skin. This work revealed that tissue micro-architecture, specifically apical skin keratinocytes, can be co-registered with its associated physiological parameters. The instrumentation and fiber-bundle probe presented here can be optimized as either a handheld or endoscopically-compatible device for use in a variety of organ systems. Additional clinical research is needed to test the viability of this technique for different epithelial disease states.

Introduction

Fiber-bundle microendoscopy techniques typically analyze in vivo tissue using either imaging techniques or a combination of spectroscopy techniques.1-3 One such imaging technique, high-resolution fluorescence microendoscopy, can image apical tissue micro-architecture with sub-cellular resolution in a small, microscale field-of-view, using a topical contrast agent such as proflavine, fluorescein, or pyranine ink.1,3-11 This imaging modality has shown promising clinical performance in qualitatively differentiating diseased and healthy epithelial tissue in real-time with low inter-observer variability.8 Occasionally, investigators will use high-resolution fluorescence microscopy data to extract quantitative features such as cell and nuclear size or gland area, but this remains a primarily qualitative technique targeted towards visualizing tissue morphology.1,3,8-10 On the other hand, spectroscopy techniques, such as diffuse reflectance spectroscopy, are targeted towards providing functional tissue information and have shown promising clinical performance in quantitatively identifying cancerous lesions in multiple organs.2,12-15

Therefore, there is a need for a device incorporating both types of modalities to potentially further reduce inter-observer variability, maintain real-time visualization of tissue micro-architecture, and provide a more complete analysis of tissue health. To accomplish this goal, a multimodal probe-based instrument was constructed that combines two modalities in a single fiber-optic probe: high-resolution fluorescence microendoscopy and sub-diffuse reflectance spectroscopy.11 This method co-registers qualitative high-resolution images of apical tissue morphology (structural properties) with quantitative spectral information (functional properties) from two distinct tissue depths including local hemoglobin concentration ([Hb]), melanin concentration ([Mel]), and oxygen saturation (SaO2).11,12,16 This specific sub-diffuse reflectance spectroscopy modality uses two source-detector separations (SDSs) to sample two unique tissue depths to provide a more comprehensive picture of tissue health by sampling down to the basement membrane and underlying tissue stroma.11

The fiber-probe consists of a central 1 mm-diameter image fiber with approximately 50,000 4.5 µm diameter fiber elements, a cladding diameter of 1.1 mm and an overall coating diameter of 1.2 mm. The image fiber is surrounded by five 200 µm diameter fibers with cladding diameters of 220 µm. Each 200 µm multimode fiber is located a center-to-center distance of 864 µm away from the center of the image fiber. Each of the 200 µm multimode fibers are 25° apart. Using the leftmost 200 µm multimode fiber as the "source" fiber, and the additional three 200 µm multimode fibers as the "collection" fibers, this geometry necessarily creates three center-to-center SDSs of 374 µm, 730 µm, 1,051 µm, and 1,323 µm. The fiber tips are enclosed in a cylindrical metal casing that keeps the distances between fibers constant. The diameter of the cylindrical metal casing is 3 mm. The distal end (towards the fiber-optic probe tip) of the fiber-optic probe is 2 feet long. The probe then separates into the six respective individual fibers at the proximal end (towards the instrumentation) which is an additional 2 feet long, for a total length of 4 feet. Figure 1 shows a representation of the fiber-optic probe.

Figure 1
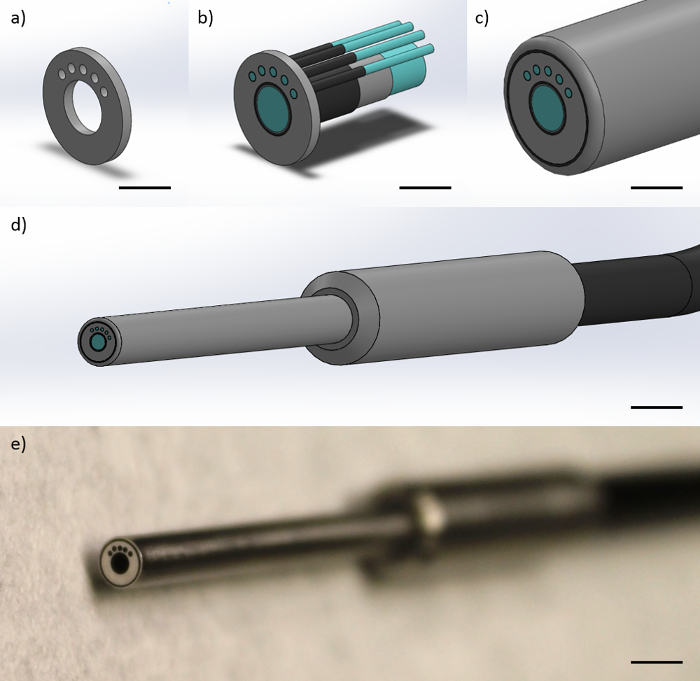
Figure 1: Fiber-optic probe design. The fiber-optic probe consists of one 1 mm-diameter image fiber and four 200 µm multimode fibers. This figure shows representations of (a) the metal end cap which constrains the geometry of the fibers at the probe tip to yield SDSs of 374, 730, and 1,051 µm with respect to the leftmost 200 µm multimode fiber (Scale bar ≈ 1 mm), (b) the fibers being constrained within the metal cap, showing the fiber cores, fiber cladding, and fiber coating (Scale bar ≈ 1 mm), (c) the protective polyamide sheathing around fibers (Scale bar ≈ 1 mm), (d) the finished distal tip of the probe, with the metal finger grip and single black cable containing all fibers (Scale bar ≈ 4 mm), and (e) a picture of the distal tip of the probe (Scale bar ≈ 4 mm). Please click here to view a larger version of this figure.

This multimodal instrumentation and associated technique is the first combination of these modalities within a single probe, although other combined structural/functional techniques do exist that combine different modalities. For example, hyperspectral imaging combines wide-field imaging with quantitative hemoglobin and melanin properties,17,18 and other techniques have been developed that combine optical coherence tomography (OCT) with analysis of tissue protein expression,19 to name a few. This article reports on a compact and easy-to-implement instrumentation setup that uses a general fiber-optic probe which can be optimized for various purposes including endoscopic use in the lower gastrointestinal tract and esophagus or as a handheld probe for use in the oral cavity and external skin placement.11,20

The hardware for this instrumentation requires both custom data acquisition and post-processing code to acquire diffuse reflectance spectra and then extract the resulting volume-averaged tissue physiological parameters including [Hb], [Mel], and SaO2. The custom data acquisition code was built to allow the simultaneous acquisition from a camera (for high-resolution fluorescence microscopy) and a spectrometer (for diffuse reflectance spectroscopy). Drivers are often available from the manufacturers' websites to allow integration with a variety of programming languages. The custom post-processing code imports a priori absorption values of in vivo [Hb] and [Mel]21 and then utilizes a previously developed nonlinear optimization fitting process that creates a fitted curve of the spectra.22 The fitted curve is built by minimizing the χ2 value between itself and the raw spectra and determining the tissue physiological parameters ([Hb], [Mel], and SaO2) from the fitted curve and with the lowest χ2 value.22 The code can be modified to include absorption from other chromophores as well, such as the exogenous pyranine ink used here, so that target physiological parameters are unaffected.

Physiological indicators of tissue health, such as [Hb], [Mel], and SaO2, can be used as reports of tumor response to therapy or as indicators of local vascularization and angiogenesis.14,23 Including a high-resolution fluorescence microendoscopy modality helps guide probe placement and provides investigators with a more complete picture of the relationship between epithelial tissue structure and function. In this article, construction and application of the multimodal microendoscope is described.11

Protocol

Institutional Review Board approval (IRB #15-09-149) was obtained from the Human Subjects Research program at the University of Arkansas for all aspects of this study. The methods described were carried out in accordance with the approved guidelines, and informed consent was obtained from all participants. 1. Assembly of the High-resolution Fluorescence Microendoscopy Modality Note: The outlined steps for assembly of the high-resolution fluorescence microendoscopy mod…

Representative Results

Following this protocol, the investigator will obtain an in-focus high-resolution image of the tissue site with the full field of view (Figure 5). Outlines of cells can be seen if stained with pyranine ink from a standard yellow highlighter, whereas individual cell nuclei can be seen if stained with a dye such as proflavine. Following spectral acquisition, the post-processing software uses a priori knowledge of in vivo hemoglobin concentration ([Hb]) and…

Discussion

The multimodal high-resolution imaging and sub-diffuse reflectance spectroscopy fiber-bundle microendoscope reported here can be optimized and used by investigators for a variety of applications including endoscopic or handheld use for human or animal studies. It thus provides a flexible method for visualizing in vivo apical tissue micro-architecture alongside measurements of hemoglobin concentration, melanin concentration, and tissue oxygen saturation from two different tissue depths. This article describes the…

Declarações

The authors have nothing to disclose.

Acknowledgements

This material is based on work supported by the National Institutes of Health (1R03-CA182052, 1R15-CA202662), the National Science Foundation Graduate Research Fellowship Program (G.G., DGE-1450079), the Arkansas Biosciences Institute, and the University of Arkansas Doctoral Academy Fellowship. Any opinions, findings, and conclusions or recommendations expressed in this material are those of the authors and do not necessarily reflect the views of the acknowledged funding agencies.

Materials

30 mm Cage Cube with Dichroic Filter Mount Thorlabs, Inc. CM1-DCH
470 nm Dichroic Mirror (Beam Splitter) Chroma Corporation T470lpxr
Cage Assembly Rod, 1.5", 4-Pack Thorlabs, Inc. ER1.5-P4
Cage Assembly Rod, 3.0", 4-Pack Thorlabs, Inc. ER3-P4
Cage Assembly Rod, 2.0", 4-Pack Thorlabs, Inc. ER2-P4
SM1-Threaded 30 mm Cage Plate Thorlabs, Inc. CP02
SM1 Series Stress-Free Retaining Ring Thorlabs, Inc. SM1PRR
SM1 Lens Tube, 1.00" Thread Depth Thorlabs, Inc. SM1L10
Right-Angle Kinematic Mirror Mount Thorlabs, Inc. KCB1
1" UV Enhanced Aluminum Mirror Thorlabs, Inc. PF10-03-F01
Z-Axis Translation Mount Thorlabs, Inc. SM1Z
10X Olympus Plan Achromatic Objective Thorlabs, Inc. RMS10X
XY Translating Lens Mount Thorlabs, Inc. CXY1
SMA Fiber Adapter Plate with SM1 Thread Thorlabs, Inc. SM1SMA
SM1 Lens Tube, 0.50" Thread Depth Thorlabs, Inc. SM1L05
440/40 Bandpass Filter (Excitation) Chroma Corporation ET440/40x
525/36 Bandpass Filter (Emission) Chroma Corporation ET525/36m
Quick Set Epoxy Loctite 1395391
455 nm LED Light Housing Kit – 3-Watt LED Supply ALK-LH-3W-KIT
1" Achromatic Doublet, f=50mm Thorlabs, Inc. AC254-050-A
Flea 3 USB Monochrome Camera Point Grey, Inc. FL3-U3-32S2M-CS
0.5" Post Holder, L = 1.5" Thorlabs, Inc. PH1.5
0.5" Optical Post, L = 4.0" Thorlabs, Inc. TR4
Mounting Base, 1" x 2.3" x 3/8" Thorlabs, Inc. BA1S
Long Lifetime Tungsten-Halogen Light Source (Vis-NIR) Ocean Optics HL-2000-LL
20X Olympus Plan Objective Edmund Optics, Inc. PLN20X
Custom-Built Aluminum Motor Arm N/A N/A Custom designed and built
Custom-Built Aluminum Motor Arm Adaptor N/A N/A Custom designed and built
Custom-Built Aluminum Motor Housing N/A N/A Custom designed and built
Stepper Motor – 400 steps/revolution SparkFun Electronics ROB-10846 Multiple suppliers
Custom-Built Aluminum Optical Fiber Switch N/A N/A Custom designed and built
Custom-Built Aluminum Optical Fiber Switch Face-Plate N/A N/A Custom designed and built
Arduino Uno – R3 SparkFun Electronics DEV-11021 Multiple suppliers
Electronic Breadboard – Self-Adhesive SparkFun Electronics PRT-12002 Multiple suppliers
EasyDriver – Stepper Motor Driver Sparkfun Electronics ROB-12779
12V, 229 mA Power Supply Phihong PSM03A Multiple suppliers
Enhanced Sensitivity USB Spectrometer (Vis-NIR) Ocean Optics USB2000+VIS-NIR-ES
550 µm, 0.22 NA, SMA-SMA Fiber Patch Cable Thorlabs, Inc. M37L01
Custom-Built Fiber-Optic Probe Myriad Fiber Imaging N/A
20% Spectralon Diffuse Reflectance Standard Labsphere, Inc. SRS-20-010
Standard Yellow Highlighter Sharpie 25005 Multiple suppliers, proflavine or fluorescein can be substituted

Referências

  1. Muldoon, T. J., et al. Subcellular-resolution molecular imaging within living tissue by fiber microendoscopy. Opt Express. 15, 16413-16423 (2007).
  2. Rajaram, N., Reichenberg, J. S., Migden, M. R., Nguyen, T. H., Tunnell, J. W. Pilot clinical study for quantitative spectral diagnosis of non-melanoma skin cancer. Lasers Surg Med. 42, 716-727 (2010).
  3. Louie, J. S., Richards-Kortum, R., Anandasabapathy, S. Applications and advancements in the use of high-resolution microendoscopy for detection of gastrointestinal neoplasia. Clin Gastroenterol Hepatol. 12, 1789-1792 (2014).
  4. Chang, S. S., et al. High resolution microendoscopy for classification of colorectal polyps. Endoscopy. 45, 553-559 (2013).
  5. Muldoon, T. J., et al. Noninvasive imaging of oral neoplasia with a high-resolution fiber-optic microendoscope. Head Neck. 34, 305-312 (2011).
  6. Muldoon, T. J., et al. Evaluation of quantitative image analysis criteria for the high-resolution microendoscopic detection of neoplasia in Barrett’s esophagus. J Biomed Opt. 15, 026027 (2010).
  7. Prieto, S. P., Powless, A. J., Boice, J. W., Sharma, S. G., Muldoon, T. J. Proflavine Hemisulfate as a Fluorescent Contrast Agent for Point-of-Care Cytology. PLoS One. 10, e0125598 (2015).
  8. Parikh, N., et al. In vivo diagnostic accuracy of high resolution microendoscopy in differentiating neoplastic from non-neoplastic colorectal polyps: a prospective study. Am J Gastroenterol. 109, 68-75 (2014).
  9. Shin, D., et al. Quantitative analysis of high-resolution microendoscopic images for diagnosis of esophageal squamous cell carcinoma. Clin Gastroenterol Hepatol. 13, 272-279 (2015).
  10. Prieto, S. P., et al. Qualitative and quantitative comparison of colonic microendoscopy image features to histopathology. Proc SPIE Int Soc Opt Eng. 9328, (2015).
  11. Greening, G. J., et al. Fiber-bundle microendoscopy with sub-diffuse reflectance spectroscopy and intensity mapping for multimodal optical biopsy of stratified epithelium. Biomed Opt Express. 6, 4934-4950 (2015).
  12. Rajaram, N., Gopal, A., Zhang, X., Tunnell, J. W. Experimental validation of the effects of microvasculature pigment packaging on in vivo diffuse reflectance spectroscopy. Lasers Surg Med. 42, 680-688 (2010).
  13. Spliethoff, J. W., et al. Monitoring of tumor response to cisplatin using optical spectroscopy. Transl Oncol. 7, 230-239 (2014).
  14. Chang, V. T., et al. Quantitative physiology of the precancerous cervix in vivo through optical spectroscopy. Neoplasia. 11, 325-332 (2009).
  15. Yu, B., Shah, A., Nagarajan, V. K., Ferris, D. G. Diffuse reflectance spectroscopy of epithelial tissue with a smart fiber-optic probe. Biomed Opt Express. 5, 675-689 (2014).
  16. Hennessy, R., Goth, W., Sharma, M., Markey, M. K., Tunnell, J. W. Effect of probe geometry and optical properties on the sampling depth for diffuse reflectance spectroscopy. J Biomedical Opt. 19, 107002 (2014).
  17. Ghassemi, P., Travis, T. E., Moffatt, L. T., Shupp, J. W., Ramella-Roman, J. C. A polarized multispectral imaging system for quantitative assessment of hypertrophic scars. Biomed Opt Express. 5, 3337-3354 (2014).
  18. Vasefi, F., et al. Polarization-sensitive hyperspectral imaging in vivo: a multimode dermoscope for skin analysis. Sci Rep. 4, (2014).
  19. Winkler, A. M., Rice, P. F. S., Drezek, R. A., Barton, J. K. Quantitative tool for rapid disease mapping using optical coherence tomography images of azoxymethane-treated mouse colon. J Biomedl Opt. 15, 041512 (2010).
  20. Bish, S. F., et al. Handheld Diffuse Reflectance Spectral Imaging (DRSi) for in-vivo characterization of skin. Biomed Opt Express. 5, 573-586 (2014).
  21. Prahl, S. A. . Optical Absorption of Hemoglobin. , (1999).
  22. Rajaram, N., et al. Design and validation of a clinical instrument for spectral diagnosis of cutaneous malignancy. Appl Opt. 49, 142-152 (2010).
  23. Hennessy, R., Markey, M. K., Tunnell, J. W. Impact of one-layer assumption on diffuse reflectance spectroscopy of skin. J Biomed Opt. 20, 27001 (2015).
  24. Rajaram, N., Nguyen, T. H., Tunnell, J. W. Lookup table-based inverse model for determining optical properties of turbid media. J Biomed Opt. 13, 050501 (2008).
  25. Nichols, B. S., Rajaram, N., Tunnell, J. W. Performance of a lookup table-based approach for measuring tissue optical properties with diffuse optical spectroscopy. J Biomed Opt. 17, 057001 (2012).
  26. Greening, G. J., James, H. M., Muldoon, T. J. . Optical Phantoms: Diffuse and Sub-diffuse Imaging and Spectroscopy Validation. , 1-37 (2015).
  27. Karsten, A. E., Smit, J. E. Modeling and verification of melanin concentration on human skin type. Photochem Photobiol. 88, 469-474 (2012).
  28. Glennie, D. L., Hayward, J. E., Farrell, T. J. Modeling changes in the hemoglobin concentration of skin with total diffuse reflectance spectroscopy. J Biomed Opt. 20, 035002 (2015).
  29. Lim, L., Nichols, B., Rajaram, N., Tunnell, J. W. Probe pressure effects on human skin diffuse reflectance and fluorescence spectroscopy measurements. J Biomed Opt. 16, 011012 (2011).
check_url/pt/54564?article_type=t

Play Video

Citar este artigo
Greening, G. J., Rajaram, N., Muldoon, T. J. Multimodal Imaging and Spectroscopy Fiber-bundle Microendoscopy Platform for Non-invasive, In Vivo Tissue Analysis. J. Vis. Exp. (116), e54564, doi:10.3791/54564 (2016).

View Video