Summary

Single-Particle Interferometric Reflectance Imaging Characterization of Individual Extracellular Vesicles and Population Dynamics

Published: January 10, 2022
doi:

Summary

This protocol presents single-particle interferometric reflectance imaging that is designed for the multi-level and comprehensive measurements of extracellular vesicles (EV) size, EV count, EV phenotype, and EV biomarker colocalization.

Abstract

Extracellular vesicles (EVs) are nanometer-sized vesicles with a lipid bilayer that are secreted by most cells. EVs carry a multitude of different biological molecules, including protein, lipid, DNA, and RNA, and are postulated to facilitate cell-to-cell communication in diverse tissues and organs. Recently, EVs have attracted significant attention as biomarkers for diagnostics and therapeutic agents for various diseases. Many methods have been developed for EV characterization. However, current methods for EV analysis all have different limitations. Thus, developing efficient and effective methods for EV isolation and characterization remains one of the crucial steps for this cutting-edge research field as it matures. Here, we provide a detailed protocol outlining a single-particle interferometric reflectance imaging sensor (SP-IRIS), as a method that is capable of detecting and characterizing EVs from unpurified biological sources and purified EVs by other methodologies. This advanced technique can be used for multi-level and comprehensive measurements for the analysis of EV size, EV count, EV phenotype, and biomarker colocalization.

Introduction

Extracellular vesicles (EVs) are nanometer-sized membrane vesicles of cellular origin that can be isolated from numerous biological fluids, including blood, breast milk, saliva, urine, bile, pancreatic juice, and cerebrospinal and peritoneal fluids. Derivation of EVs occurs via three main mechanisms: apoptosis, release via fusion of multivesicular bodies with the plasma membrane, and blebbing of the plasma membrane1. Evidence for EV transfer of donor cell components to neighboring or distant cells and tissues suggests these membrane enclosed packages may play important roles in paracrine as well as long distance or endocrine signaling cascades1,2,3. Because EVs can provide a snapshot of a cell's phenotype, the potential for their use as diagnostic and therapeutic tools for the treatment of various diseases has become an active area of research4,5,6,7,8.

Many methods aimed at EV characterization have been developed9,10,11,12,13. Most of these methods provide unique and valuable information about populations of EVs primarily in bulk. While a subset of these techniques can provide details regarding substances within or on single EVs, there can be limitations to characterizing EVs at the single EV level. For example, immuno-electron microscopy can be used to understand single EVs and their composition, but this technique is low throughput, severely limited in its ability to be used for describing population dynamics, and requires significant methods development14.

Recently, development and commercialization of the single-particle interferometric reflectance imaging sensor (SP-IRIS) technique, via the ExoView platform, has opened individual EV characterization using a routine and simple automated data collection method. The core of this technology is the chip, a 1 cm x 1 cm Si/SiO2 double layer, which enables the interferometric measurement of single biological nanoparticles. The chip is tilled with a microarray of individual functionalized antibody spots, allowing for multiplexed detection of up to six different capture types. Standard chips include the common tetraspanin markers (CD81, CD63, and CD9) for capture during the incubation step, and the user can add additional custom capture spots to isolate distinct populations of EVs separate from the tetraspanins. After the incubation step, each capture spot has bound many EVs to it which express the corresponding marker. These captured EVs can then be simply washed, dried, and scanned in the reader to quantify the size of vesicles bound to the capture spot between 50-200 nm to give a number weighted size distribution via SP-IRIS15. The system also offers three fluorescent detection channels for immunolabeling the captured EVs, and provides both the mean fluorescent intensity, which is not limited by the size such as SP-IRIS measurements, and colocalization aspects for each fluorescent stain. This allows the user to define populations of single EVs based on the display of four different biomarkers per EV (capture plus three immunofluorescent labels). The system can go beyond measuring surface proteins with immunofluorescence, as an optional cargo protocol allows the user to probe for interior proteins of the captured EVs and luminal epitopes of membrane spanning surface markers, as well as allows the user to check for EV membrane integrity. In this article, we provide a detailed protocol outlining the steps necessary to obtain consistent data regarding EV size and number, with up to four different biomarkers at a single EV level on large populations of EVs. This technique can be used on both unprocessed biological fluids and EVs isolated using any number of techniques, such as ultracentrifugation, ultrafiltration, precipitating agents, immunoaffinity capture, microfluidics, and size-exclusion chromatography.

The protocol described below uses extracellular vesicles (EV) derived from HEK 293 cell culture media and from the mouse serum using an established isolation method16. The protocol has been applied to numerous other biological fluids, cell culture medium, and purified extracellular vesicles isolated from biological fluids. This protocol is divided into a two-day procedure with the workflow for a typical experiment shown in Figure 1.

Figure 1
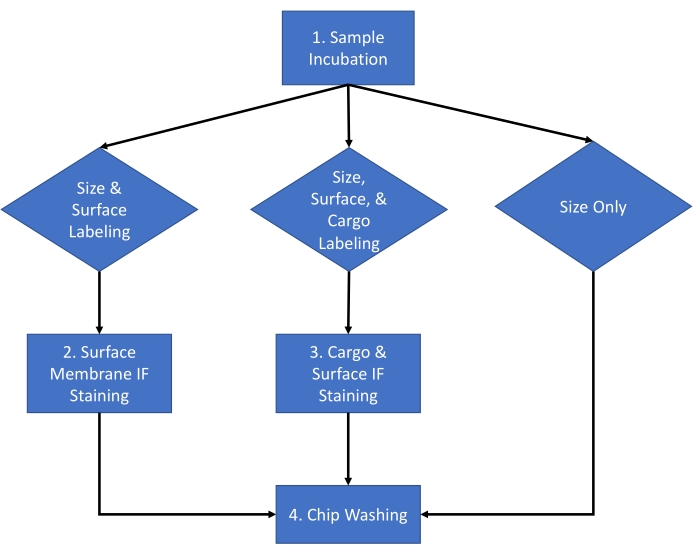
Figure 1: Assay workflow. Assay workflow for choosing the type of analysis to be completed for the sample between size and count, size count and surface staining, and size count and cargo staining. Please click here to view a larger version of this figure.

Protocol

Serum samples were collected from mice according to an approved Institutional Animal Care and Use Committees (IACUC) at the University of Kansas Medical Center (KUMC) protocol. Use of these biological samples in these experiments was also approved by KUMC. 1. Sample preparation (Day 1) Determine EV concentration using nanoparticle tracking or an equivalent technique. Dilute the sample with the incubation solution to a concentration of 5 x 10⁷-5…

Representative Results

Figure 7 (left panel) shows a three-color composite image of EVs derived from HEK293 conditioned media bound to the CD63 spot on the chip and stained for CD81, CD63, and CD9 in the following channels green, red, and blue, respectively. Figure 7 (top right panel) is a zoomed-in image that shows each of the captured EVs can display co-localization of one or more colors with varying intensities in each channel. The difference in staining of the captured EVs represe…

Discussion

Current EV characterization methods largely rely on purified EVs, which is restricted by current experimental limitations of EV purification methods9,10,11,12,13.Single-particle interferometric reflectance imaging (SP-IRIS) is an effective technology that can eliminate purification steps required for sample analysis and therefore save time and reduce costs tha…

Declarações

The authors have nothing to disclose.

Acknowledgements

This work was sponsored in part by the University of Kansas School of Medicine Research Equipment and Resource Procurement Award Program. PCG, LKC, FD and AR were supported with funds from NIA R21 AG066488-01.

Materials

10-cm sterile Petri dish Fisher FB0875712
15mL sterile tube n/a various
24-well cell culture plate, flat bottom Fisher 08-772-1
Blocking Solution NanoView Biosciences EV-TETRA-C Can be found in ExoView Human Tetraspanin Kit.
Chipfiles NanoView Biosciences EV-TETRA-C Can be found in ExoView Human Tetraspanin Kit.
Chips NanoView Biosciences EV-TETRA-C Can be found in ExoView Human Tetraspanin Kit.
Chuck NanoView Biosciences EV-TETRA-C Can be found in ExoView Human Tetraspanin Kit.
Corning Easy Grip Disposable Polystyrene Sterile Bottles 250 ml Fisher 09-761-4
Corning Easy Grip Disposable Polystyrene Sterile Bottles 500 ml Fisher 09-761-10
Deionized (DI) water Fisher LC267404
EMS style tweezers with Carbon Fiber tips Fisher 50-193-0842
ExoView Human Tetraspanin Kit NanoView Biosciences EV-TETRA-C Capture for hCD81, hCD9, hCD63, IgG Control
 + stains for hEV-A (hEV-CD63-647, hEV-CD81-555, hEV-CD9-488) 16 Chips per kit
ExoView R100 Imager NanoView Biosciences EV-R100 Interferometric microscope including high specification camera including 3 color fluorescence and label free sizing and counting extracellular vesicles
Fluorescently labled huma CD9 IgG antibody NanoView Biosciences EV-TETRA-C Can be found in ExoView Human Tetraspanin Kit.
Fluorescently labled human CD63 IgG antibody NanoView Biosciences EV-TETRA-C Can be found in ExoView Human Tetraspanin Kit.
Fluorescently labled human CD81 IgG antibody NanoView Biosciences EV-TETRA-C Can be found in ExoView Human Tetraspanin Kit.
Incubation Solution NanoView Biosciences EV-TETRA-C Can be found in ExoView Human Tetraspanin Kit.
Orbital shaker or microplate shaker with digital settings capable of shaking at 500 rpm n/a various
Plate Seal NanoView Biosciences EV-TETRA-C Can be found in ExoView Human Tetraspanin Kit.
Solution A NanoView Biosciences EV-TETRA-C Can be found in ExoView Human Tetraspanin Kit.
Solution B NanoView Biosciences EV-TETRA-C Can be found in ExoView Human Tetraspanin Kit.
Solution C NanoView Biosciences EV-TETRA-C Can be found in ExoView Human Tetraspanin Kit.
Solution D NanoView Biosciences EV-TETRA-C Can be found in ExoView Human Tetraspanin Kit.
Square/flat tip tweezer Fisher 50-239-62
Straight strong point Boley style tweezers Fisher 16-100-124
Thermo Scientific Adhesive PCR Plate Seals Fisher AB-0558

Referências

  1. Maas, S. L. N., Breakefield, X. O., Weaver, A. M. Extracellular vesicles: Unique intercellular delivery vehicles. Trends in Cell Biology. 27 (3), 172-188 (2017).
  2. Shah, R., Patel, T., Freedman, J. E. Circulating extracellular vesicles in human disease. The New England Journal of Medicine. 379 (10), 958-966 (2018).
  3. Deng, F., Miller, J. A review on protein markers of exosome from different bio-resources and the antibodies used for characterization. Journal of Histotechnology. 42 (4), 226-239 (2019).
  4. Cohen, O., et al. ’Golden’ exosomes as delivery vehicles to target tumors and overcome intratumoral barriers: in vivo tracking in a model for head and neck cancer. Biomaterials Science. 9 (6), 2103-2114 (2021).
  5. Han, Y., et al. Overview and update on methods for cargo loading into extracellular vesicles. Processes (Basel). 9 (2), 356 (2021).
  6. Lee, M., Im, W., Kim, M. Exosomes as a potential messenger unit during heterochronic parabiosis for amelioration of Huntington’s disease. Neurobiology of Disease. 155, 105374 (2021).
  7. Sun, B., et al. Characterization and biomarker analyses of post-COVID-19 complications and neurological manifestations. Cells. 10 (2), 386 (2021).
  8. Jiang, L., Gu, Y., Du, Y., Liu, J. Exosomes: Diagnostic biomarkers and therapeutic delivery vehicles for cancer. Molecular Pharmaceutics. 16 (8), 3333-3349 (2019).
  9. Bachurski, D., et al. Extracellular vesicle measurements with nanoparticle tracking analysis – An accuracy and repeatability comparison between NanoSight NS300 and ZetaView. Journal of Extracellular Vesicles. 8 (1), 1596016 (2019).
  10. Carmicheal, J., et al. Label-free characterization of exosome via surface enhanced Raman spectroscopy for the early detection of pancreatic cancer. Nanomedicine. 16, 88-96 (2019).
  11. Greening, D. W., Xu, R., Ji, H., Tauro, B. J., Simpson, R. J. A protocol for exosome isolation and characterization: evaluation of ultracentrifugation, density-gradient separation, and immunoaffinity capture methods. Methods in Molecular Biology. 1295, 179-209 (2015).
  12. Wu, Y., Deng, W., Klinke, D. J. Exosomes: improved methods to characterize their morphology, RNA content, and surface protein biomarkers. The Analyst. 140 (19), 6631-6642 (2015).
  13. van de Vlekkert, D., Qiu, X., Annunziata, I., d’Azzo, A. Isolation and characterization of exosomes from skeletal muscle fibroblasts. Journal of Visualized Experiments: JoVE. (159), (2020).
  14. Ayala-Mar, S., Donoso-Quezada, J., Gallo-Villanueva, R. C., Perez-Gonzalez, V. H., Gonzalez-Valdez, J. Recent advances and challenges in the recovery and purification of cellular exosomes. Electrophoresis. 40 (23-24), 3036-3049 (2019).
  15. Daaboul, G. G., et al. Digital detection of exosomes by interferometric imaging. Scientific Reports. 6, 37246 (2016).
  16. Pohler, K. G., et al. Circulating microRNA as candidates for early embryonic viability in cattle. NMolecular Reproduction and Development. 84 (8), 731-743 (2017).
  17. NanoView Biosciences. ExoView R100 User Guide. v240.4. NanoView Biosciences. , 202 (2021).
  18. Daaboul, G. G., et al. Enhanced light microscopy visualization of virus particles from Zika virus to filamentous ebolaviruses. PLoS One. 12, 0179728 (2017).
  19. ET Consortium. EV-TRACK: transparent reporting and centralizing knowledge in extracellular vesicle research. Nature Methods. 14, 228-232 (2017).
This article has been published
Video Coming Soon
Keep me updated:

.

Citar este artigo
Deng, F., Ratri, A., Deighan, C., Daaboul, G., Geiger, P. C., Christenson, L. K. Single-Particle Interferometric Reflectance Imaging Characterization of Individual Extracellular Vesicles and Population Dynamics. J. Vis. Exp. (179), e62988, doi:10.3791/62988 (2022).

View Video