Back to chapter

11.13:

位相図

JoVE Core
Chemistry
A subscription to JoVE is required to view this content.  Sign in or start your free trial.
JoVE Core Chemistry
Phase Diagrams

Languages

Share

Carbon dioxide can exist as a solid, liquid, or gas under specific temperatures and pressures. This dependence is mapped into a phase diagram, which includes three general features: regions, lines, and points.  Regions represent the temperature and pressure conditions for a single phase. At standard pressure, carbon dioxide can be solid or gaseous, depending on the temperature. At pressures below 5.1 atm, if the temperature of solid carbon dioxide is raised, it will directly transition to the gaseous phase without passing through the liquid form. A transition through all three phases — solid to liquid and liquid to gas —  will occur at pressures above 5.1 atm.  The lines or curves that separate the regions denote the temperatures and pressures at which the phases on either side of the curve are in equilibrium.  For example, the point at 1 atm and −78.5 °C, lies on the curve separating the solid and vapor phases, so a solid–vapor equilibrium exists under those conditions. Accordingly, this is called the sublimation curve.  Similarly, the liquid-gas equilibrium exists on the vaporization curve, and the solid-liquid equilibrium exists on the fusion curve. These curves are known more generally as phase boundaries. At 5.1 atm and −56.6 °C all three phases will coexist. This is the triple point of carbon dioxide.  At 73 atm and 31 °C, both liquid and vapor phases of carbon dioxide will coalesce into a single-phase supercritical fluid. This is the critical point of carbon dioxide. In the region beyond the critical point no pressure or temperature change can convert a supercritical fluid to a gas or liquid. The phase diagram of water has a few notable differences from that of carbon dioxide.  The fusion curve of carbon dioxide has a positive slope, while for water, the slope is negative. This is an atypical feature of water. Increasing the pressure favors a liquid-to- solid transition in carbon dioxide but a solid-to-liquid transition in water.  The higher pressure favors the denser solid form of carbon dioxide. In the case of water, the denser liquid form is favored

11.13:

位相図

位相図とは、物質の液相-気相、固相-液相、固相-気相の各相転移平衡について、圧力と温度をプロットしたものです。これらの図は、特定の圧力と温度の条件下で存在する物理状態を示し、相転移温度(融点、昇華点、沸点)の圧力依存性を示しています。固体、液体、気体と書かれた領域は単相を表し、線や曲線は平衡状態にある2つの相(または相変化点)を表します。三重点は、三相が共存する圧力と温度の条件を示します。一方、臨界点とは、気体と液体の中間的な物性を持つ単相が存在する温度と圧力を示します。
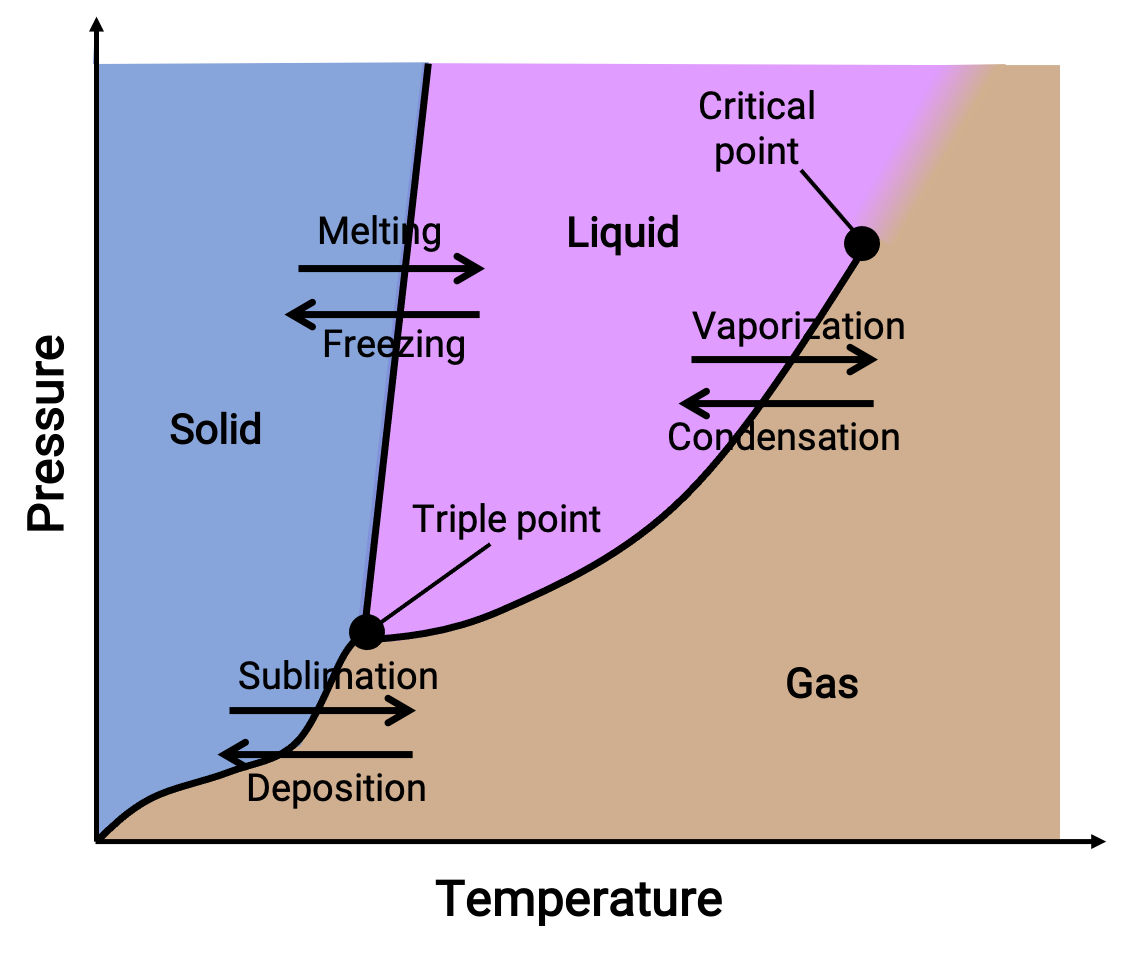
Image1

図 1. 一般的な位相図。

位相図は、指定された圧力と温度の条件下での物質の物理的状態を示します。 これらのプロットの有用性を説明するために、以下に示す水の位相図を検討します。
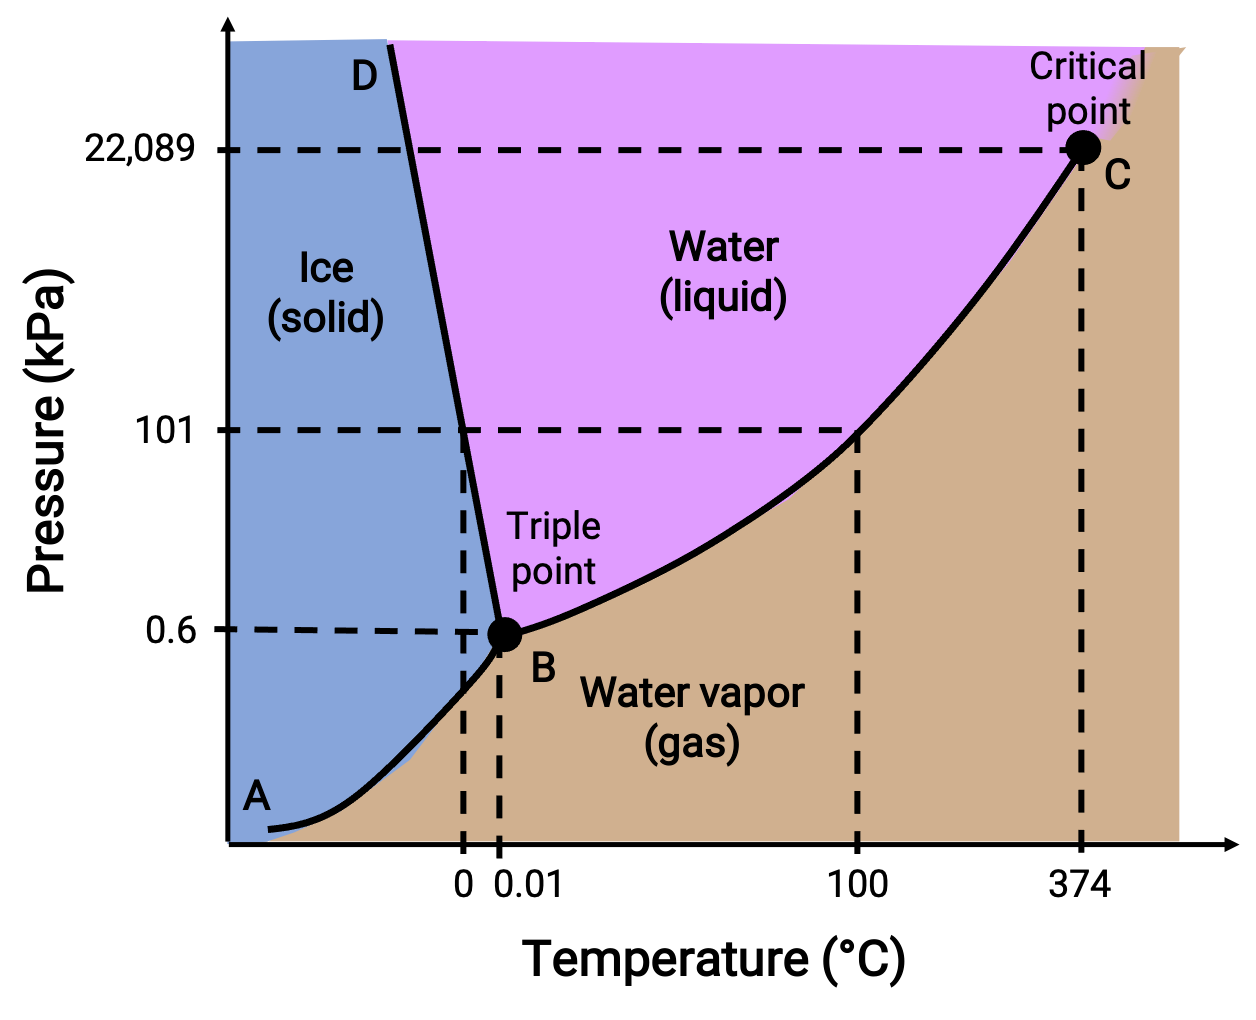
Image2

図 2. 水の位相図。

50 kPaの圧力と −10 °Cの温度は、図の “氷と書かれた領域に相当します。この条件では、水は固体としてのみ存在します。圧力が50kPa、温度が50 °Cの場合は、水が液体としてのみ存在する領域に相当します。25kPa、200℃では、水は気体としてしか存在しません。曲線BCは、相図の液体と気体の領域を分ける液体-蒸気曲線で、任意の圧力における水の沸点を示しています。例えば、1気圧の場合、沸点は100℃です。液体-蒸気曲線は、温度374℃、圧力218気圧で終了することに注意してください。これは、圧力に関係なく、この温度以上では水は液体として存在できないことを示しています。この条件での水の物理的性質は、液相と気相の中間的なものです。このような特異な物質状態を超臨界流体と呼びます。ABと書かれた固体-蒸気曲線は、氷と水蒸気が平衡状態にある温度と圧力を示しています。これらの温度と圧力のデータペアは、水の昇華点または凝結点に対応します。

BDと書かれた固体-液体曲線は、氷と液体の水が平衡状態にある温度と圧力を示しており、水の融点と凝固点を表しています。この曲線はわずかに負の傾きを示しており、圧力が高くなるにつれて水の融点がわずかに低下することを示しています。ほとんどの物質は圧力が高くなると融点が高くなるので、水はこの点では珍しい物質です。3つの曲線の交点(B)は水の三重点で、3つの相が平衡状態にあることを示しています。三重点より低い圧力では、温度に関係なく水は液体として存在できません。

二酸化炭素の位相図を別の例として考えてみましょう。
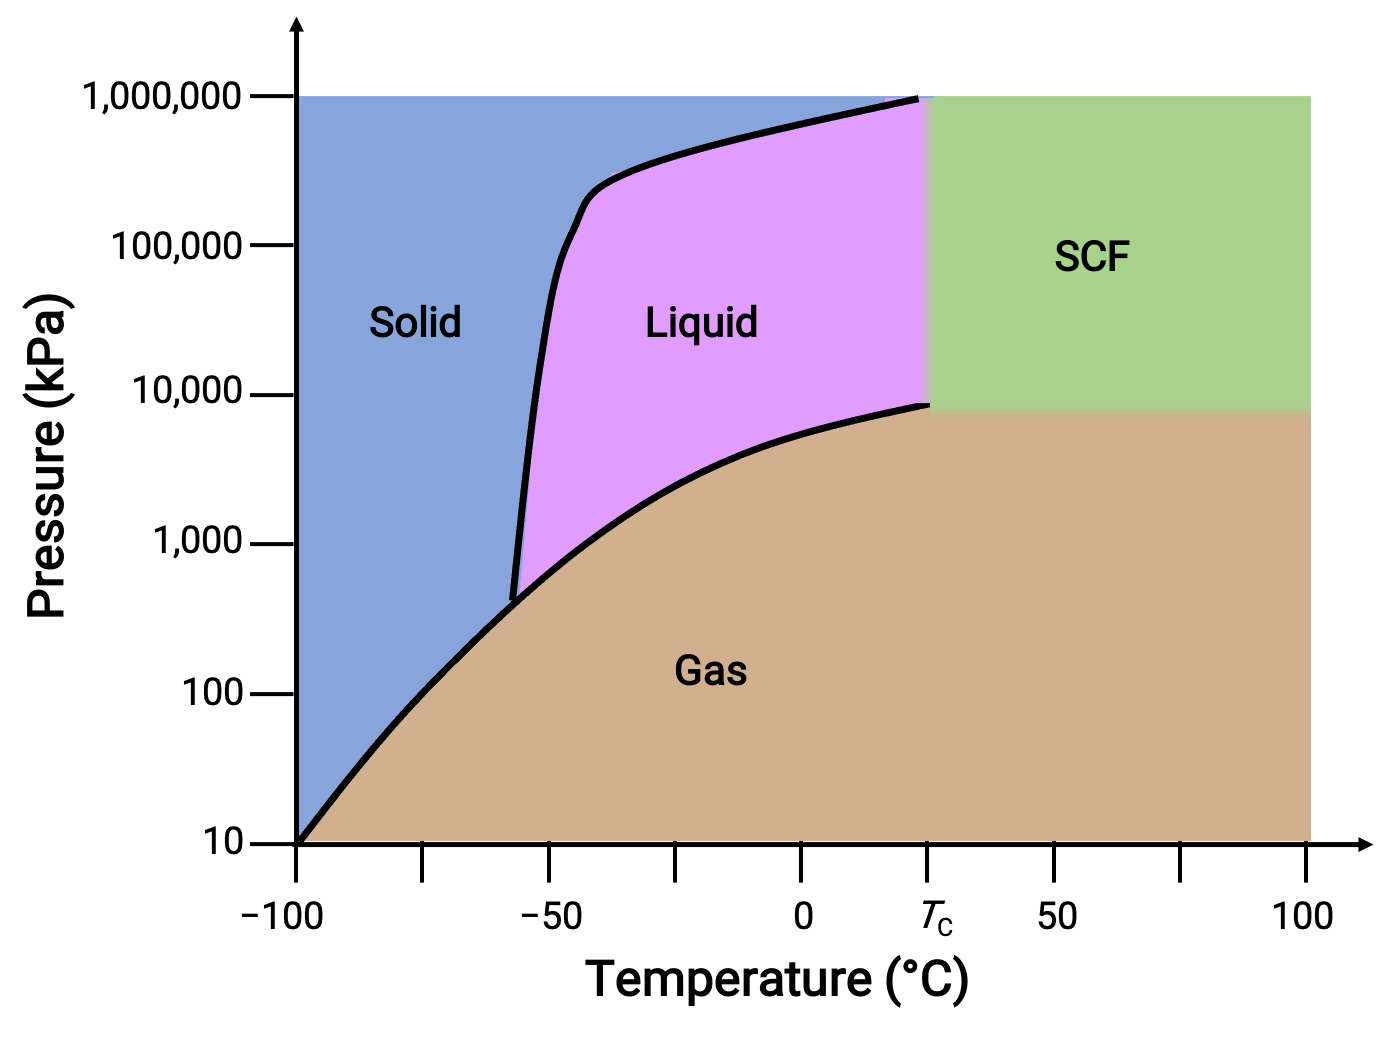
Image3

図 3. 二酸化炭素の位相図。

固液曲線は正の傾きを示しており、これはCO2の融点がほとんどの物質と同様に圧力とともに上昇することを示しています。また、三重点が1気圧をはるかに超えていることから、二酸化炭素は常圧条件では液体として存在できないことが分かります。1気圧で気体の二酸化炭素を冷却すると、固体になります。同様に、固体の二酸化炭素は1気圧では溶融せず、昇華してガス状のCO2となります。最後に、二酸化炭素の臨界点は、水に比べて比較的緩やかな温度と圧力で観測されます。

このテキストは、 Openstax, Chemistry 2e, Section 10.4: Phase Diagrams から引用したものです。