Back to chapter

16.15:

酸塩基滴定曲線

JoVE Core
Chemistry
A subscription to JoVE is required to view this content.  Sign in or start your free trial.
JoVE Core Chemistry
Acid-Base Titration Curves

Languages

Share

Acid-base titration can be performed to determine an unknown concentration of an acid using a known concentration of a base or vice versa.  When titrating an acid with a base, the titrant is gradually added to the acid, raising the pH. The pH change is plotted against the volume of the base to create a titration or pH curve. The titration curves are S-shaped, though differences exist depending on whether the acid is strong or weak. The pH at the start of the titration will be acidic but higher for a weak acid, assuming equal initial concentrations of acid. The equivalence point is the point on the titration curve at which the moles of base equals the moles of acid in solution. In the case of a strong acid, the equivalence point is reached when a strong base neutralizes all the hydronium ions produced by the strong acid; therefore, it always occurs at pH 7. In contrast, a weak acid’s equivalence point occurs at a pH greater than 7 and is reached when all the weak acid is converted into its conjugate base. Near the equivalence point, there is a sudden jump in the pH of the solution. However, in a weak acid titration, this rapid pH shift is not as steep as in a strong acid titration. The pH after the equivalence point on a titration curve for both weak and strong acids gradually increases due to excess strong base. Other features of a weak acid titration curve, but not a strong one, are the buffer region and the half-equivalence point. When a strong base is added, a weak acid produces its conjugate base creating a buffer. The half-equivalence point lies within this buffer region. This point is when half of the volume of base needed to reach the equivalence point has been added. Here, the concentration of weak acid equals its conjugate base, and the pH of the solution equals the pKa. The titration curves of a strong or a weak base with a strong acid as the titrant is an inverted S-shaped, where the pH starts high and decreases with the addition of the strong acid.

16.15:

酸塩基滴定曲線

滴定曲線とは、溶液のpHと滴定液の添加量をプロットしたものです。酸塩基滴定の場合、溶液の組成に応じたpHの変化が予測可能なため、滴定の進行状況や終点の検出をモニターするのに有用です。酸塩基滴定は、強酸と強塩基、強酸と弱塩基、または強塩基と弱酸で行うことができます。

0.100 MのHCl(強酸)25.00 mLを0.100 MのNaOH(強塩基)で滴定した場合、その滴定曲線はFigure 1aのように赤色で表示されます。また、0.100 MのCH3COOH(弱酸)25.00 mLを0.100 MのNaOHで滴定すると、その滴定曲線はFigure 1bのように黄色で表示されます。

Image1

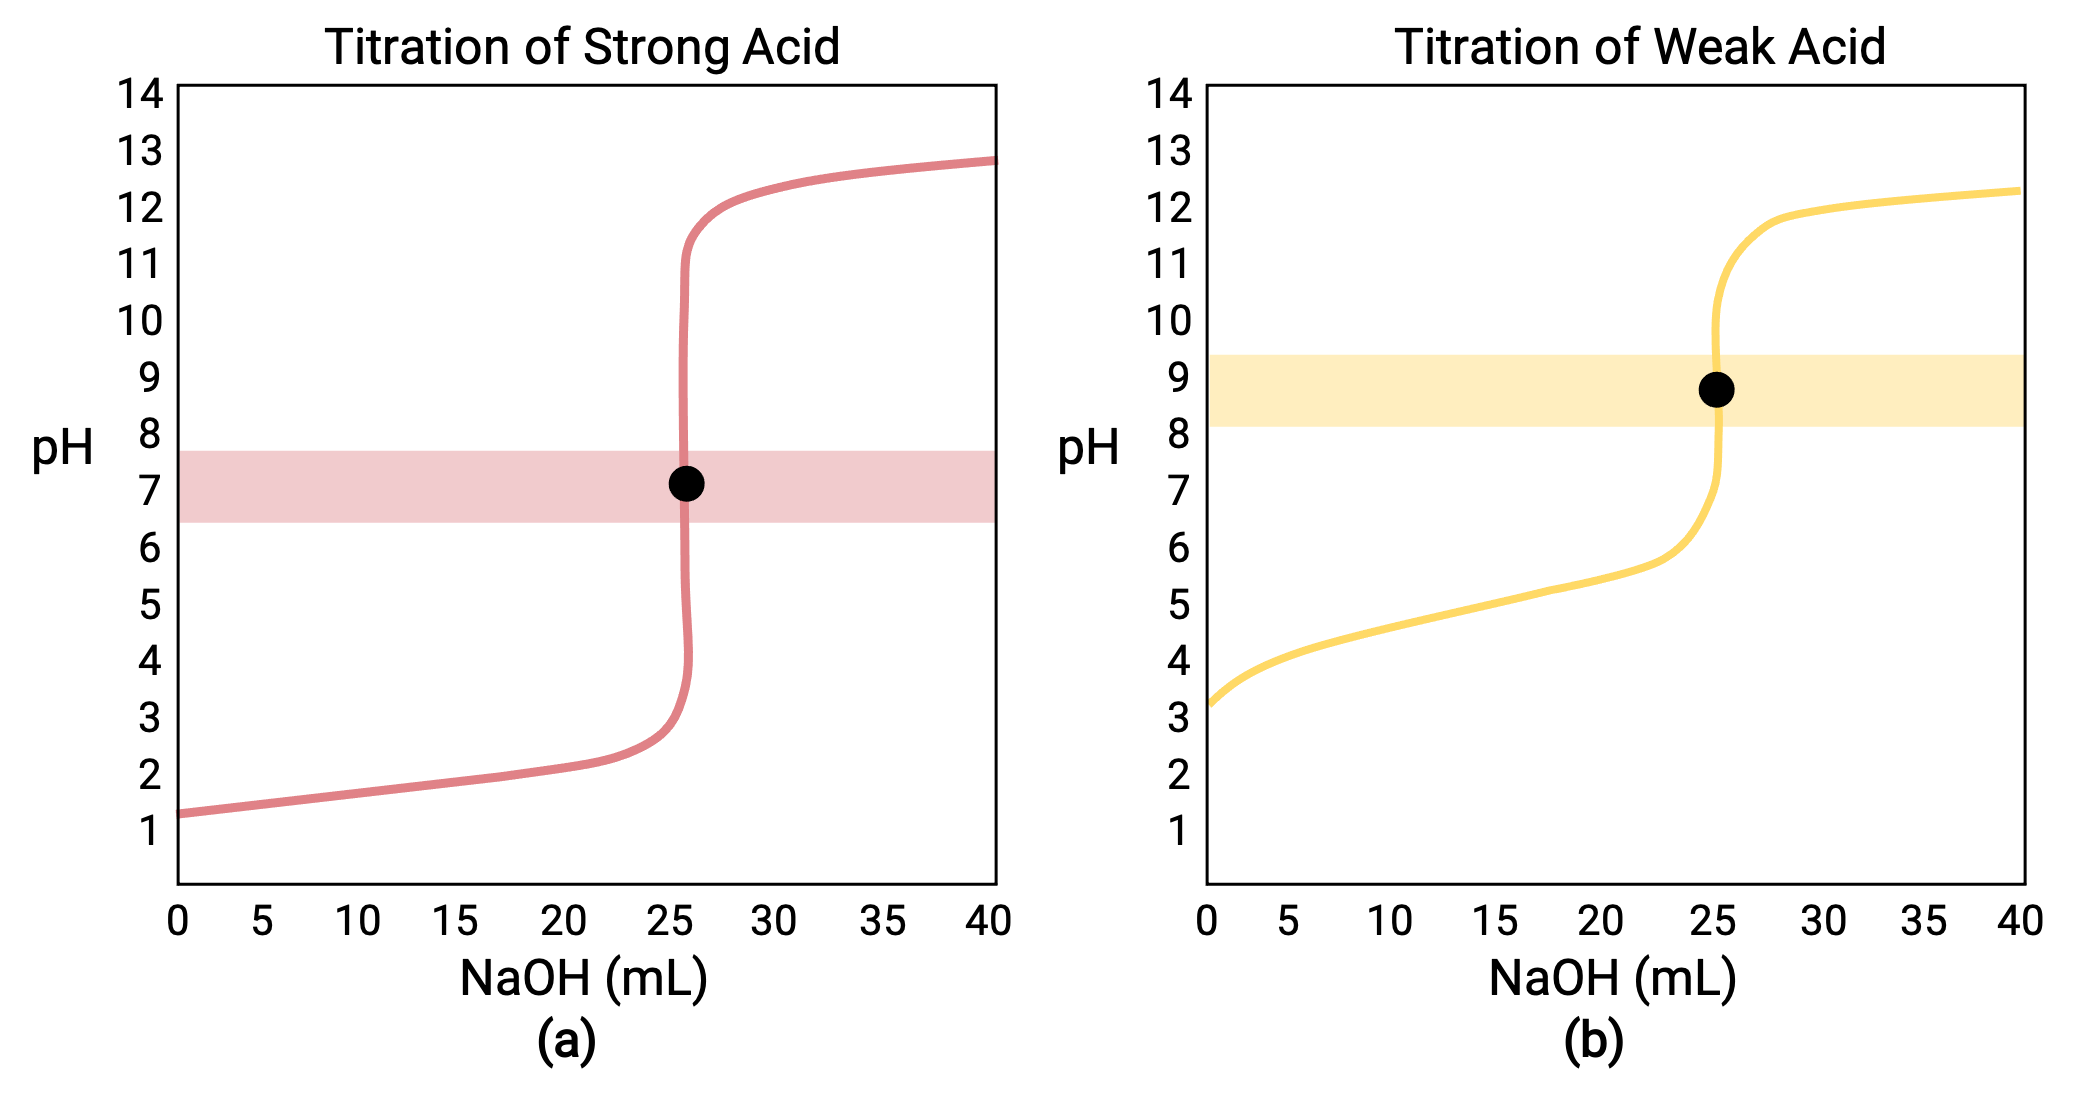
Figure 1 (a) 0.100 M塩酸(強酸)25.00 mLを0.100 M NaOH(強塩基)で滴定したときの滴定曲線は、当量点がpH7.00となります。(b) 0.100 M酢酸(弱酸)25.00 mLを0.100 M NaOH(強塩基)で滴定したときの滴定曲線の当量点は、pH8.72です。

<p強塩基または弱塩基と強酸との滴定は、似たようなS字型の曲線を描きますが、pHは塩基性領域から始まり、強酸の添加とともに減少するため、形状は反転します。また、弱酸または弱塩基の滴定は、それぞれKaまたはKbを決定するために使用することができます。.

滴定における4つの段階

  1. 初期状態(滴定液添加量 = 0mL): pHは、滴定する酸によって決まります。強酸と弱酸の酸が同濃度の場合、弱酸がより大きな初期pHを示します。
  2. 等量点前(0mL < V < 25 mL): 溶液のpHが徐々に上昇し、添加した滴定剤との反応で酸が消費され、組成には未反応の酸とその反応生成物である共役の塩基が含まれます。
  3. 等量点(V = 25 mL): 溶液の組成が酸性から中性(強酸を滴定する場合)または塩基性(弱酸を滴定する場合)に移行する際に、pHの急激な上昇が観察され、酸の共役塩基のイオン化によってpHが決まります。
  4. <li滴定後(V > 25 mL): 過剰な強塩基滴定溶液の添加量によってpHが決まるが、両試料とも同じ滴定溶液で滴定しているため、この段階では両試料の滴定曲線は類似しています。

上記の文章は以下から引用しました。 Openstax, Chemistry 2e, Section 14.7: Acid-base Titrations.

Suggested Reading

  1. Ramette, Richard W. "TITRATE: A Learning Tool for Acid-Base Titrations." (1994): 238. https://pubs.acs.org/doi/pdf/10.1021/ed071p238.2