Many different methods exist for the measurement of extracellular vesicles (EVs) using flow cytometry (FCM). Several aspects should be considered when determining the most appropriate method to use. Two protocols for measuring EVs are presented, using either individual detection or a bead-based approach.
Extracellular Vesicles (EVs) are small, membrane-derived vesicles found in bodily fluids that are highly involved in cell-cell communication and help regulate a diverse range of biological processes. Analysis of EVs using flow cytometry (FCM) has been notoriously difficult due to their small size and lack of discrete populations positive for markers of interest. Methods for EV analysis, while considerably improved over the last decade, are still a work in progress. Unfortunately, there is no one-size-fits-all protocol, and several aspects must be considered when determining the most appropriate method to use. Presented here are several different techniques for processing EVs and two protocols for analyzing EVs using either individual detection or a bead-based approach. The methods described here will assist with eliminating the antibody aggregates commonly found in commercial preparations, increasing signal–to-noise ratio, and setting gates in a rational fashion that minimizes detection of background fluorescence. The first protocol uses an individual detection method that is especially well suited for analyzing a high volume of clinical samples, while the second protocol uses a bead-based approach to capture and detect smaller EVs and exosomes.
EVs, also known as microparticles, are small, membrane-derived vesicles found in bodily fluids that are involved in cell-cell communication and help regulate a diverse range of biological processes1. Through expression of various surface markers and/or direct transfer of biological material, EVs are able to alter the function of recipient cells to play either activating or suppressing roles in intercellular communication2–4. Clinically, platelet-derived EVs are known to have strong anticoagulant activity5, while others have been shown to contribute to a wide range of conditions, from promoting tumor metastasis6 to protecting against disease7. EVs can be classified into smaller categories of cell-derived vesicles such as exosomes and microvesicles (MVs), depending on their size and mechanism of generation8. The nomenclature of cell-derived vesicle subpopulations continues to be a topic of ongoing debate8,9, however, exosomes are generally described as small, 40 to 100 nm particles derived from endosomal fusion with the plasma membrane, while MVs are larger 100 to 1,000 nm particles formed by shedding of the plasma membrane10. Here, the general term “EVs” will be used to refer to all types of extracellular biological vesicles released by cells.
Isolation of EVs from whole blood is a multi-step procedure and many different processing variables have been shown to affect EV content, including storage temperature and duration11,12, anticoagulant/preservative used13 and centrifugation method used14. A need for standardization of these variables has led to recommendations by the International Society on Thrombosis and Haemostasis Scientific and Standardization Committee (ISTH SSC) for proper blood processing and EV isolation procedures15,16, yet there exists no consensus among researchers on the optimal protocol to use 12. Most agree, however, that tightly controlled pre-analytical variables are crucial for accurate and reproducible data.
In order to analyze EVs, researchers have utilized various methods, including transmission electron microscopy17, scanning electron microscopy18,19, atomic force microscopy, dynamic light scattering20,21 and western blotting22,23. While FCM is the method of choice for many researchers9,24–26 due to its high throughput capabilities, analysis of EVs using FCM has been notoriously difficult due to their size and lack of discrete positive populations27–32. Compared to analysis of cells, the small size of the EVs results in 1) less fluorescence emitted due to the fewer number of antigens per particle and 2) limited feasibility of post-stain washing, which is necessary to reduce background fluorescence. Common challenges among researchers include signals arising from immunoglobulin aggregates27,28and self-aggregation of antibodies29. Furthermore, the long processing times and lengthy washing/isolation procedures used by many of the current protocols33,34 require multi-day time commitments to analyze a small number of samples, making them less than ideal for high throughput applications. Some researchers forgo a wash step altogether, rendering traditionally used FCM negative controls such as fluorescence minus one (FMO) and antibody isotypes useless for accurately assessing background fluorescence30.
Our protocols address three common problems that can impede proper FCM analysis of EVs: signals arising from antibody aggregates and other non-vesicles, difficulty in removing unbound antibody, and lack of discernible positive populations. The techniques described here will assist with eliminating the antibody aggregates commonly found in commercial preparations, increasing signal–to-noise ratio, and setting gates in a rational fashion that minimizes detection of background fluorescence. Two different detection methods are presented here: the first protocol uses an individual detection method that is especially well suited for analyzing a high volume of clinical samples, while the second protocol uses a beads-based approach to capture and detect smaller EVs and exosomes.
NOTE: The following protocols have been performed in compliance with all institutional, national and international guidelines for human welfare. All human subject samples were tested under an institutional review board (IRB)-approved protocol and with informed consent of the subjects.
1. METHOD A: Individual Detection Method
1.1) Processing of Blood Sample/Isolation of EVs
1.2) Preparing Samples for Analysis
NOTE: From this point on, the steps explain a high throughput protocol for analyzing 12 samples for 14 markers in 3 panels. However, other combinations of antibodies can be used here; the protocol can be adapted to study other EV populations by substituting the suggested markers for those of interest.
1.3) Staining EV Samples
1.4) Washing MV Samples
1.5) Cytometer Setup
1.6) Sample Reading
1.7) Data Analysis
2. METHOD B: Beads Method
2.1) Processing of Blood Sample/Isolation of EVs
2.2) Preparing Samples for Analysis
2.3) Staining EV Samples
2.4) Cytometer Setup and Sample Reading
Figure 1 outlines the overall processing scheme for the isolation and detection of EVs using either the bead-based method or individual detection method. Individual detection of EVs using FCM works well for analyzing larger EVs but most cytometers are not capable of individually detecting particles as small as exosomes. A bead-based approach allows small EVs to be detected, however, there are drawbacks associated with using this method, as outlined in Table 1. Generally, isolation of EVs using ultracentrifugation (with or without the addition of a sucrose gradient fractionation procedure) is recommended when EVs are needed for functional assays. Ultracentrifugation removes impurities including serum proteins and other soluble contaminants from the plasma, which can affect functional experimental outcomes. However, ultracentrifugation is time consuming and may alter EV quantity and quality12.
Expected results for the two detection assays are depicted in Figures 2-3. For the individual detection assay, the lysed control (bottom row, Figure 2) is used to set gates for the corresponding non-lysed sample (top row, Figure 2). The majority of events should fall within the EV gate. Quadrant gates should not reveal double positive events when the two markers in comparison are not normally found on the same cell. The right biparameter plots in Figure 2 show the markers CD108a and CD235a, which are two red blood cell markers known to coexist on cells. Here, on EVs, over half of the positive events are positive for both markers, as expected. In the same way, cell surface markers known to reside on the same cell should show similar patterns of double positivity on EVs. The center biparameter plots show EV expression of two markers that are known not to coexist on cells. In this analysis of CD235a (a red blood cell marker) and CD41a (a platelet marker), the EVs show distinct, separate, positive populations, which is expected since they come from different cell types. When lysed, positive events should disappear. In general, any positive events remaining after lysis indicate the presence of signal coming from non-vesicle particles, aggregates, and/or detergent-resistant EVs. Figure 3 shows expected results using the bead-based detection method. Unlike the individual detection method, these data cannot/should not be viewed in bi-parameter plots. In the upper dot plots, no separation between the positive and negative populations exist, and events appear in the double positive quadrants even though they aren’t normally found on the same cell types due to the fact that both types of EVs will bind to a single bead. For the bead-based detection method, data are best analyzed using histogram overlays with the negative control (depicted underneath the dot plots). Positivity is measured using a marker’s MFI (mean fluorescence intensity) and compared directly with that of the negative control. If a sample is positive for the marker in question, its MFI will be higher than the negative control. The negative control for the bead method is simply beads blocked with BSA (no EVs added), which have been stained with the same antibodies and washed alongside the EV-coated beads. A comparison of expected results using the two methods can be seen in Figure 4.
The ability of the individual detection assay to properly assess EV phenotypes relies heavily on correct gating to separate Ab-positive events from background fluorescence. Therefore, it is critical to choose a negative control that most appropriately mimics/predicts background fluorescence for a given sample. When stained EVs are not washed before reading, commonly used negative controls (e.g., isotypes) fail to accurately predict background fluorescence for all markers (Figure 5A). In these cases, if washing is not an option, lysed samples tend to work better for predicting background fluorescence. However, when stained EVs are washed before reading (using centrifugal filtration, in this case), both negative controls (isotypes and lysed samples) work well for predicting background fluorescence of a sample (Figure 5A). It should be noted, however, that while all negative controls “work,” lysed controls are preferred because they provide additional information about a sample (e.g., the presence of detergent-resistant, non-vesicle-related events and/or aggregates) that can result in non-EV positive signals and improperly inflate Ab counts. Furthermore, isotype controls can sometimes be unreliable, even in washed samples, as shown in Figure 5B, where the stained sample has fewer positive events than the same sample stained with matched isotype control antibodies.
Without thorough removal of unbound antibody, FCM dot plots of some EV markers are nearly impossible to interpret, appearing as clouds of dimly fluorescent particles indistinguishable from their highly fluorescent backgrounds (Figure 6, top plot). Washing stained samples using centrifugal filters enhances the separation between background and positive marker signals (Figure 6, bottom plot); however, small EVs and exosomes may be lost through the pores of the filter.
The use of a detergent lysis step reveals positive, vesicle-mimicking events from immune complexes and protein aggregates21. When PPP is analyzed using individual detection, encountering positive events that do not disappear with lysis is a fairly often occurrence. These detergent-resistant events often appear as suspicious, highly fluorescent diagonal signals in both single parameter and biparameter plots (Figure 7). Clinically, these protein complexes and/or insoluble immune complexes are more prevalent in patients afflicted with various diseases21, such as rheumatoid arthritis28, nephrotic syndrome19, and systemic lupus erythematosus29. Therefore, depending on the objective of the research, one may wish to include or remove them from the analysis.Another way diagonal signals can form is by vortexing the samples, particularly after the addition of the lysis reagent (Figure 8). Samples should always be mixed up and down by pipet to prevent the formation of aggregates.
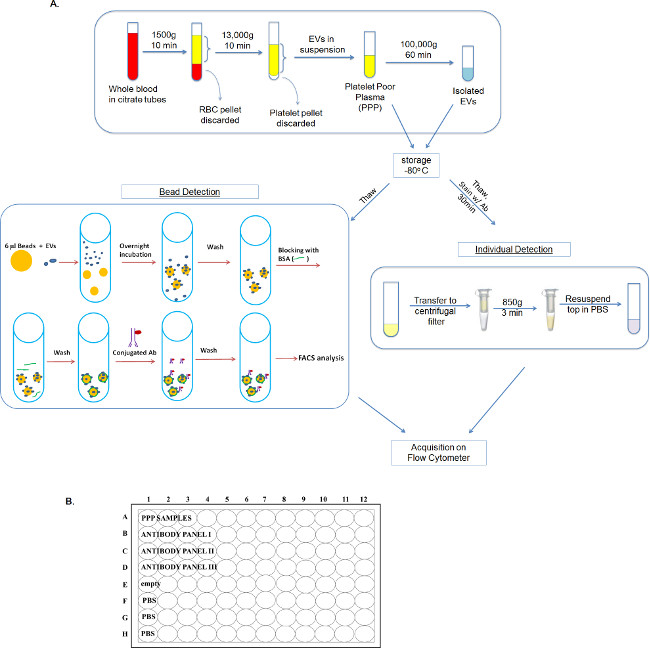
Figure 1: Overall processing scheme for the isolation and detection of EVs using either the bead-based method or individual detection method. (A) Whole blood is first processed into PPP. From there, PPP can either be processed further using ultracentrifugation to yield isolated EVs or used as-is in the individual detection or bead-based assays. (B) Outline of suggested plate map for high throughput sample analysis using the individual detection method. Please click here to view a larger version of this figure.
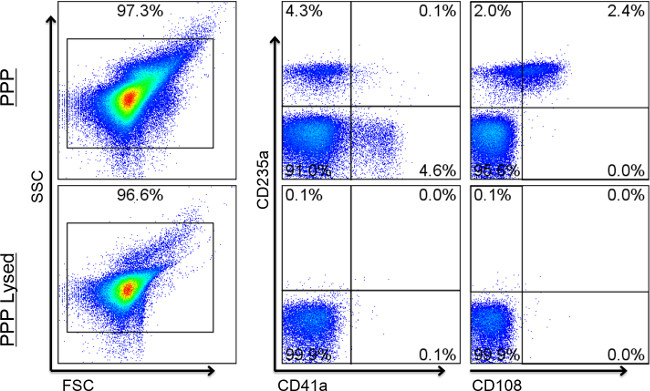
Figure 2: Expected results for Individual Detection. Flow cytometry dot plots show representative staining of lysed and unlysed EV samples. Values show percentages of positive events. The majority of events fall within the EV gate. Events shown in the right biparameter plots are within the FSC/SSC EV gates on the left. The lysed sample (bottom row) is used to set fluorescent-based gates for each corresponding (non-lysed) sample. Quad gates should not reveal double positive events when the two markers in comparison are not normally found on the same cell. Here, the biparameter CD235a and CD41a plot shows a distinct separation between the EVs expressing red blood cell markers and those expressing platelet cell markers. Likewise, cell surface markers known to reside on the same cell should show similar patterns of double positivity on EVs. The right biparameter plot shows that over half of CD235a-positive EVs are also positive for the secondary red blood cell (RBC) marker, CD108a. When lysed, positive events should disappear. Positive events remaining after lysis indicate the presence of signal coming from non-vesicle or detergent resistant particles and/or aggregates.
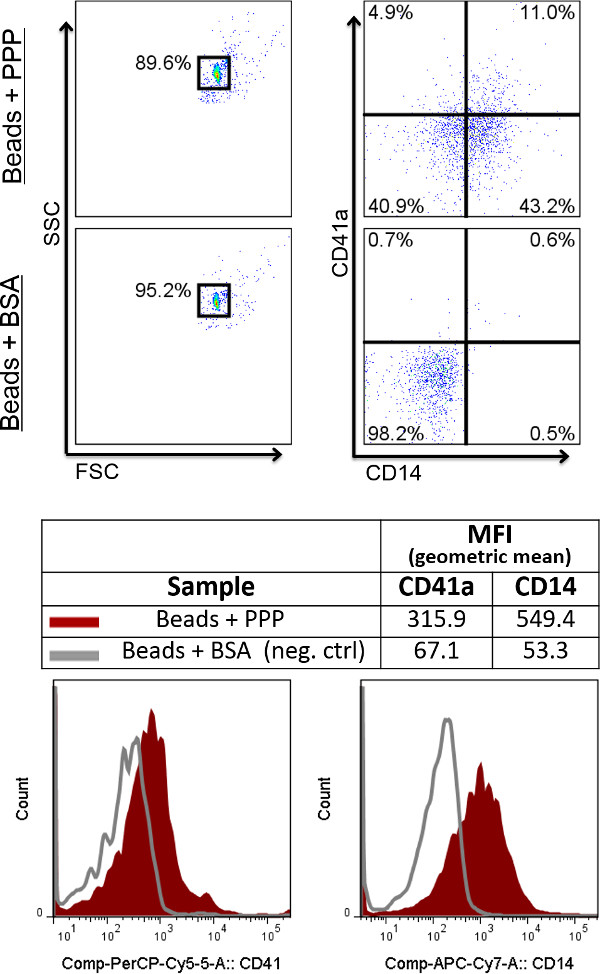
Figure 3: Expected results using the bead-based detection method. Flow cytometry dot plots show representative staining of EVs coupled to beads, as compared to beads blocked with BSA, which serves as the negative control. Values show percentages of positive events. Events shown in the right biparameter plots are within the FSC/SSC beads gates on the left. For the beads-based detection method, data are best analyzed using histogram overlays with the negative control (depicted underneath the dot plots). Positivity is measured using a marker’s MFI (mean fluorescence intensity) and compared directly with that of the negative control.
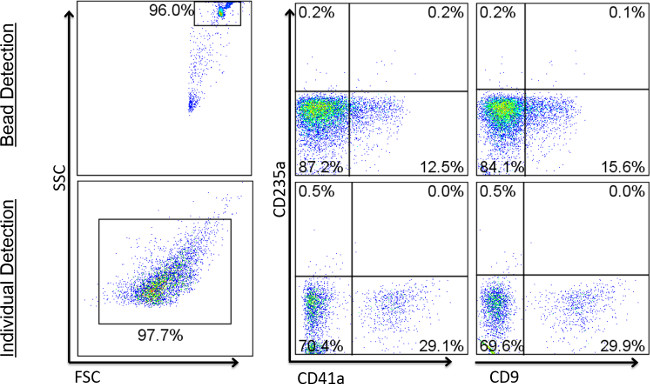
Figure 4: Comparison of expected results using beads vs. individual detection. Flow cytometry dot plots show representative staining of EVs coupled to beads (top row), compared to EVs analyzing using individual detection (bottom row). Events shown in the right biparameter plots are within the FSC/SSC beads gates on the left.
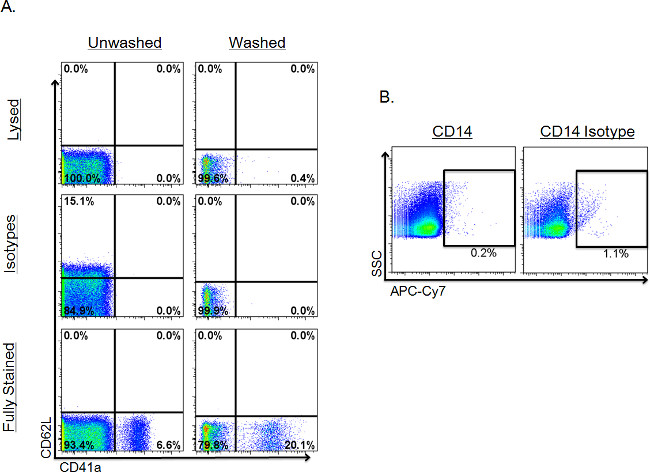
Figure 5: Comparison of different negative controls in individual detection analysis. Values show percentages of positive events. Events shown are within the FSC/SSC EV gate. (A) Comparison of negative controls in unwashed vs. washed samples. Isotype or lysed controls were evaluated for their ability to provide appropriate indications of background fluorescence across two different markers in a fully stained sample (bottom row). Gates for each marker were made using the lysed sample (top row) and then copied to the rows beneath. Washed samples were washed using post-stain filtration. (B) Example of a sample stained with the isotype control having more positive events than the sample stained with actual antibody.
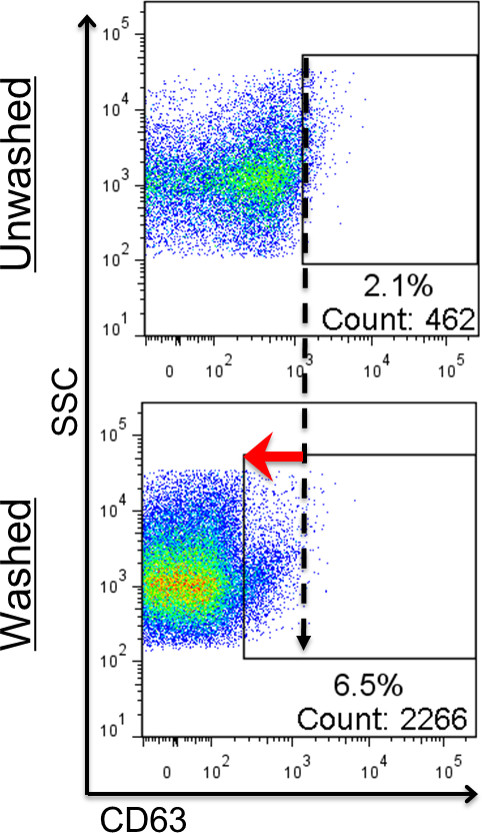
Figure 6: Effect of post-stain washing in individual detection. Values show percentages and numbers of positive events. Events shown are within the FSC/SSC EV gate. Gates for each sample were made using each sample’s lysed counterpart (not shown; refer to previous figure for gate-setting in unwashed vs washed samples). High background fluorescence makes distinguishing positive from negative events difficult (top plot). When washed, however, the positive population is revealed as unbound fluorescent antibodies are removed and background fluorescence is reduced (bottom plot).
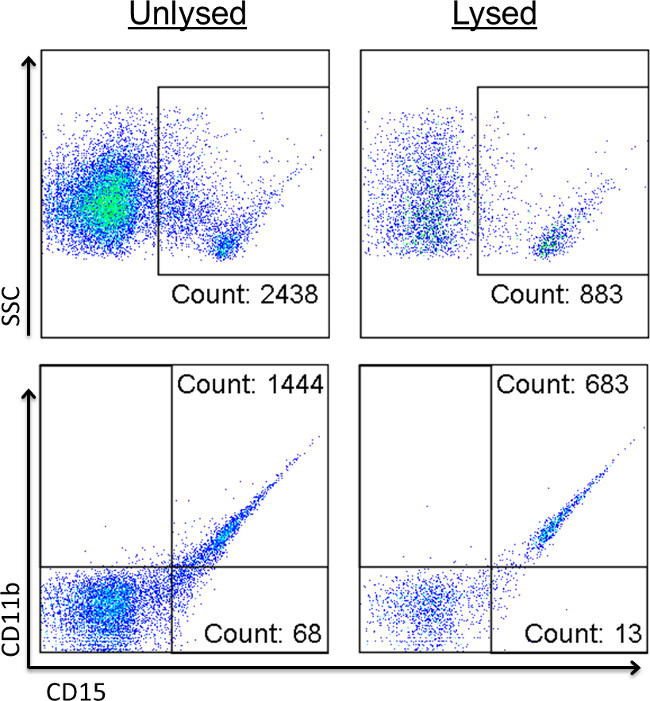
Figure 7: Detergent lysis confirms the presence of non-EV signals. Events shown are within the FSC/SCC EV gate. Values show percentages of positive events. Stained EV samples were read before (left column) and after addition of detergent (right column) to identify positive signals caused by immune complexes and other non-EV-related events.
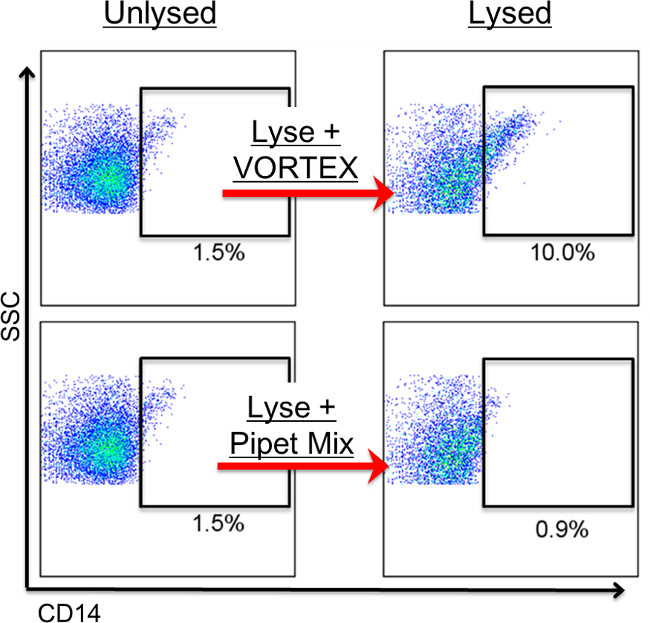
Figure 8: Vortexing causes the appearance of non-EV signals. Events shown are within the FSC/SCC EV gate. Values show percentages of positive events. Stained EV samples were read before (left column) and after addition of detergent (right column). Using a vortex to mix samples can cause EV-mimicking, diagonal populations to form (top row). When mixed gently up and down using a pipet, however, formation of these populations can be avoided (bottom row). Vortexing is not recommended for mixing, as it can cause aggregation in some samples, leading to diagonal-appearing, positive populations. In general, event number within a positive gate should not increase after lysing.
Bead-Based Detection | Individual Detection | |
EV Sizes | recommended for < 100 nm only | recommended for > 100 nm only |
Time | requires overnight incubation | can complete in < 1 day |
Sensitivity | cluster detection | single particle detection |
Results | qualitative | quantitative |
Washing | simple, standard centrifugation | requires centrifugal filters |
Negative control | BSA-coated beads | lysed samples |
Table 1: Pros and cons of both detection methods.
Two different protocols for the isolation, treatment and analysis of EVs were presented, using either an individual detection or bead-based approach. Selecting the most appropriate method to use is not always straightforward and requires an understanding of the sample being tested as well as the individual subpopulations of interest. Furthermore, the sensitivity of the cytometer used for acquisition must be considered when choosing the most appropriate method. Oftentimes there is no single best protocol to use, rather, a combination of methods provides more information about a sample than any one method alone. Ideally, several different isolation and detection techniques should be evaluated first in order to develop a tailored protocol that takes into consideration individual cytometer performance with respect to the specific EV population being studied. Alternative isolation techniques include ultracentrifugation, sucrose density fractionation, immunomagnetic bead separation, chromatography, and affinity purification12, while alternative detection methods include scanning electron microscopy, transmission electron microscopy, atomic force microscopy, dynamic light scattering, and western blotting8. By combining different techniques, the methods presented here can be adapted in order to create protocols best suited for studying various EV populations of interest.
In general, individual detection of EVs using FCM works well for analyzing larger EVs but loses sensitivity as EVs get smaller. While individual detection is more consistent in detecting larger EVs, bead-based detection is less sensitive in detecting larger EVs and more sensitive for exosomes. Larger EVs can be washed easily via post-stain filtration and detected singly via FCM. Smaller EVs and exosomes, on the other hand, are not detected well individually using FCM and are much more difficult to wash post-staining. The bead-capture protocol resolves both of these issues, allowing EVs to be easily washed and multiple EVs to be measured together to create larger positive signals detectable by FCM. However, there are drawbacks associated with using this method, as outlined in Table 1.
When working with a less sensitive cytometer, the capacity for individual detection is limited. Prior to EV analysis, the sensitivity of the cytometer should be determined using a mixture of bead sizes ranging from 0.1-1.0 µm. Failure of the cytometer to detect a majority of particles below 1.0 µm would necessitate the use of the bead-based protocol. Highly expressed markers are easily detected using either protocol. Rarer populations are sometimes easier to detect using the single particle detection protocol rather than the bead capture protocol, however, this can vary depending on such variables as: the brightness of the fluorochrome, the sample’s EV:bead ratio, and the size of the EV bearing the rare cell surface marker. Detection of multiple markers on a single particle necessitates the use of the individual detection method. The bead-based method is not capable of individual EV detection. Therefore, the bead-based protocol will yield data that are more qualitative in nature, while the individual detection method will give more quantitative data.
Additional isolation techniques must be utilized whenever EVs are needed for downstream applications. EVs used in functional assays should be ultracentrifuged using the 3-step differential centrifugation protocol, since the soluble serum proteins in plasma can affect functional experimental outcomes. For characterization of EVs, however, ultracentrifugation is not recommended, since this added step may affect EV quality and quantity due to the high forces imparted on the particles12.
The individual detection protocol contains several key steps optimized for high-throughput testing, including: 1) the implementation of centrifugal filters for the quick and effective removal of positive events caused by Ab aggregates, 2) the use of filters as a more practical alternative to ultracentrifugation or sucrose gradient fractionation for washing unbound Ab from EV samples post-staining, and 3) utilization of detergent lysis as a negative control, which not only reveals positive events caused by non-EVs but provides a good approximation of background fluorescence to distinguish positive from negative populations for drawing gates. The individual detection protocol is recommended whenever a large number of samples needs testing as it can be performed in a single day, whereas the bead-based method requires an overnight incubation.
The negative controls in each protocol have different advantages and disadvantages depending on which detection method is used. One benefit of using the bead-based assay is that the same monoclonal antibodies can be used for negative and positive tubes and the same negative control can be used for all samples. The individual detection method, on the other hand, requires separate controls to be read for each sample tested. The negative control used by the individual detection protocol uses lysed samples, which do not require the use/consumption of additional antibodies but do require that each tube be read a second time after addition of the lysing agent. The lysed controls have the added benefit of being able to identify the proportion of positive signal that can be attributed to non-vesicle-related events such as immune complexes 21. The bead-based assay does not have this ability todistinguish between positive signals arising from true EVs and those arising from non-vesicles.
Limitations of the technique
While there is no standardized method for the isolation of EVs, differential centrifugation is a widely used technique among EV researchers. The differential centrifugation method described here is based on common protocols for isolating PPP, which typically require an initial centrifugation between 1,200-1,500 x g for 10-20 min to remove cells, followed by a second centrifugation between 10,000-13,000 x g for 10-30 min to remove platelets 35. The protocol described herein uses a centrifugation at 1,500 x g for 10 min followed by a centrifugation at 13,000 x g for 10 min. While higher forces of 25,000-100,000 x g are typically required to pellet EVs, some of the larger EVs may be removed with the differential centrifugation protocol we have presented.
Up to 90% of EVs detected by FCM are lost with one hour ultracentrifugation at 100,000 x g (data not shown). Longer centrifugation times should be considered, albeit cautiously, as this may adversely impact the sample’s composition. If additional processing is needed for characterization studies, filtration can be performed after the 2-step centrifugation (before staining) to further fractionate samples based on particle size. Similar to ultra-centrifugation, filtration can result in a loss of up to 50% of positive marker events and up to 90% of total particles detected by FCM (data not shown). While the increase in signal-to-noise ratio is of obvious benefit, the loss of smaller EVs represents a significant limitation when considering any washing or isolation method.
Finally, the anticoagulant used (e.g., heparin, ACD, ethylenediaminetetraacetic acid (EDTA), etc.) during blood collection may impact the quality and quantity of EV content. While ACD has proven to be a good and reliable anticoagulant for our studies, testing multiple solutions is recommended to ensure that the most suitable anticoagulant for the application is chosen. This is especially important when EVs will be used in downstream assays where the anticoagulant used can affect the outcome. For example, some anticoagulants (e.g., EDTA and heparin) are known to interfere with PCR reactions while others (e.g., theophylline, adenosine and dipyridamole) have been shown to inhibit EV release from platelets12.
Methods for EV analysis, while considerably improved over the last decade, are still a work in progress. Ultimately, the best methods for analyzing EVs will depend on the research being conducted and tools available to the researcher.
The authors have nothing to disclose.
The authors would like to thank Dale Hirschkorn from Blood Systems Research Institute for his help with flow cytometer instrument settings. This work was supported by NIH grants HL095470 and U01 HL072268 and DoD contracts W81XWH-10-1-0023 and W81XWH-2-0028.
LSR II benchtop flow cytometer | BD Biosciences | 3-laser (20 mW Coherent Sapphire 488 nm blue, 25 mW Coherent Vioflame 405 nm violet, and 17 mW JDS Uniphase HeNe 633nm red) | |
FACS Diva software | BD Biosciences | PC version 6.0 | |
FlowJo software | Treestar US | Mac version 9.6.1 or PC version 7.6.5 | |
Sphero Rainbow fluorescent particles | BD Biosciences | 556298 | used to adjust all channel voltages to maintain fluorescence intensity consistency |
Ultra Rainbow fluorescent particles | Spherotech | URFP-10-5 | used in addition to Megamix-Plus SSC beads to ensure EV gating consistency from batch to batch |
Megmix-Plus SSC beads | Biocytex | 7803 | used to adjust FSC and SSC voltages to maintain consistency between runs. Can also used to monitor flow rate and ajust flow rate dial in order to ensure that same flow rate is used in all runs |
AbC Anti-Mouse Bead Kit | Life Technologies | A-10344 | used for compensation controls & negative AbC beads used for beads-based method |
Nonidet P-40 Alternative (NP-40) (CAS 9016-45-9) | Santa Cruz | sc-281108 | used in the individual detection method only to lyse samples after initial reading for use as negative controls. Stock may be diluted to 1:10 in PBS and stored in fridge for up to 1 month. |
BD TruCOUNT Tubes | BD Biosciences | 340334 | used whenver absolute EV concentrations are needed |
Ultrafree-MC, GV 0.22 µm Centrifugal Filter Units | Millipore | UFC30GVNB | used to post-stain wash Evs and/or fractionate EVs based on size |
Vacutainer glass whole blood tubes ACD-A | BD Biosciences | 364606 | |
Facs tubes 12×75 polystrene | BD Biosciences | 352058 | |
50mL Reservoirs individually wrapped | Phenix | RR-50-1s | |
Green-Pak pipet tips – 10µL | Rainin | GP-L10S | |
Green-Pak pipet tips -200µL | Rainin | GP-L250S | |
Green -Pak pipet tips – 1000µL | Rainin | GP-L1000S | |
Stable Stack L300 tips presterilized | Rainin | SS-L300S | |
Pipet-Lite XLS 8 Channel LTS Adjustable Spacer | Rainin | LA8-300XLS | |
96 well tissue culture plates | E&K Scientific | EK-20180 | |
RPMI 1640 Media (without Hepes) | UCSF Cell Culture Facility | CCFAE001 | media used for bead-based detection method |
Dulbeccos PBS D-PBS, CaMg-free, 0.2µm filtered | UCSF Cell Culture Facility | CCFAL003 | |
Ultracentrifuge Tube, Thinwall, Ultra-Clear | BECKMAN COULTER INC | 344058 | |
PANEL I | |||
CD3 PerCP-Cy5.5 | Biolegend | 344808 | 2 µl |
CD14 APC-Cy7 | Biolegend | 301820 | 2 µl |
CD16 V450 | BD Biosciences | 560474 | 2 µl |
CD28 FITC | biolegend | 302906 | 2 µl |
CD152 APC | BD Biosciences | 555855 | 2 µl |
CD19 A700 | Biolegend | 302226 | 2 µl |
PANEL II | |||
CD41a PerCP-Cy5.5 | BD Biosciences | 340930 | 2 µl |
CD62L APC | Biolegend | 304810 | 2 µl |
CD108 PE | BD Biosciences | 552830 | 2 µl |
CD235a FITC | biolegend | 349104 | 2 µl |
PANEL III | |||
CD11b PE-Cy7 | Biolegend | 301322 | 2 µl |
CD62p APC | Biolegend | 304910 | 2 µl |
CD66b PE | Biolegend | 305106 | 2 µl |
CD15 FITC | exalpha | X1496M | 5 µl |
CD9 PE | Biolegend | 555372 | |
CD63 APC | Biolegend | 353008 | |
APC-Cy7 Ms IgG2a, κ | Biolegend | 400230 |