This protocol describes how to conduct automatic image-guided patch-clamp experiments using a system recently developed for standard in vitro electrophysiology equipment.
Whole-cell patch clamp is the gold-standard method to measure the electrical properties of single cells. However, the in vitro patch clamp remains a challenging and low-throughput technique due to its complexity and high reliance on user operation and control. This manuscript demonstrates an image-guided automatic patch clamp system for in vitro whole-cell patch clamp experiments in acute brain slices. Our system implements a computer vision-based algorithm to detect fluorescently labeled cells and to target them for fully automatic patching using a micromanipulator and internal pipette pressure control. The entire process is highly automated, with minimal requirements for human intervention. Real-time experimental information, including electrical resistance and internal pipette pressure, are documented electronically for future analysis and for optimization to different cell types. Although our system is described in the context of acute brain slice recordings, it can also be applied to the automated image-guided patch clamp of dissociated neurons, organotypic slice cultures, and other non-neuronal cell types.
The patch clamp technique was first developed by Neher and Sakmann in the 1970s to study the ionic channels of excitable membranes1. Since then, patch clamping has been applied to the study of many different subjects at the cellular, synaptic, and circuit level—both in vitro and in vivo—in many different cell types, including neurons, cardiomyocytes, Xenopus oocytes, and artificial liposomes2. This process involves the correct identification and targeting of a cell of interest, intricate micromanipulator control to move the patch pipette in close proximity to the cell, the application of positive and negative pressure to the pipette at the proper time to establish a tight gigaseal patch, and a break-in to establish a whole-cell patch configuration. Patch clamping is typically conducted manually and requires extensive training to master. Even for a researcher experienced with the patch clamp, the success rate is relatively low. More recently, several attempts have been made to automate patch-clamp experiments. Two main strategies have evolved to accomplish automation: augmenting standard patch clamp equipment to provide automatic control of the patching process and the design of new equipment and techniques from the ground up. The former strategy is adaptable to existing hardware and can be used in a variety of patch clamp applications, including in vivo blind patch clamp3,4,5, in vitro patch clamp of acute brain slices, organotypic slice cultures, and cultured dissociated neurons6. It enables the interrogation of complex local circuits by using multiple micromanipulators simultaneously7. The planar patch method is an example of the new development strategy, which can achieve the high-throughput simultaneous patch clamp of cells in suspension for drug screening purposes8. However, the planar patch method is not applicable to all cell types, particularly neurons with long processes or intact circuits containing extensive connections. This limits its application to mapping the intricate circuitry of the nervous system, which is a key advantage of traditional patch clamp technology.
We have developed a system that automates the manual patch clamp process in vitro by augmenting standard patch clamp hardware. Our system, Autopatcher IG, provides automatic pipette calibration, fluorescent cell target identification, automatic control of pipette movement, automatic whole-cell patching, and data logging. The system can automatically acquire multiple images of brain slices at different depths; analyze them using computer vision; and extract information, including the coordinates of fluorescently labeled cells. This information can then be used to target and automatically patch cells of interest. The software is written in Python—a free, open-source programming language—using several open-source libraries. This ensures its accessibility to other researchers and improves the reproducibility and rigor of electrophysiology experiments. The system has a modular design, such that additional hardware can easily be interfaced with the current system demonstrated here.
1. System Setup
2. Automatic Patch Clamp Procedure
3. Performing Recordings
NOTE: The mode in the computer-controlled microelectrode amplifier will be set automatically to Current Clamp ("IC") by the autopatcher software once a successful patch has been achieved. Whole-cell patch clamp recordings can be done using the recording software of choice (this system does not include a recording function). If multiple target cells were identified, after finishing a recording, go back to step 2.4 and try another cell.
Our system has been tested on its ability to patch cells in acute brain slices, mouse induced Pluripotent Stem Cells (iPSCs) differentiated into neurons, and HEK 293 cells artificially expressing channels of interest. Figure 3 shows an experiment using Thy1-ChR2-YFP transgenic mice (B6.Cg-Tg(Thy1-COP4/EYFP)18Gfng/J) targeting fluorescently labeled layer 5 pyramidal neurons in the visual cortex. The target cell was one of the automatically identified green fluorescent-positive cells (Figure 3b). Figure 3a is the Differential Interference Contrast (DIC) image of the patched neuron. The whole-cell configuration was achieved by the automatic patching protocol in steps 2.5 – 2.6 and was validated by step current injection-induced action potentials (Figure 3c)
To demonstrate the additional "Command Sequence" function, we delivered 500 mM KCl for 200 ms to three locations on a brain slice while patching a cell (Figure 4). First, we selected 3 locations on the brain slice: one close to the patched cell body and two far away from the patched cell. The coordinates were stored in the "Memory Positions" GUI. The coordinates were loaded to the "Command Sequence" GUI under "Unit1," which was the manipulator that the KCl-containing pipette was mounted on. We set the commands in the left column to send a +5-V TTL signal for 500 ms, followed by 0 V for 10 s (Figure 4a), from port A channel 0 on the secondary DAQ board, which was connected to the digitizer "start trigger" input. Figure 4c shows that the patched cell was a regular spiking neuron. The drug application pipette (Unit 1) traversed the three selected locations automatically (Figure 4b), and we recorded 10 s for each application under voltage-clamp (Figure 4d). The color of the traces in Figure 4d corresponds to the border color in Figure 4b. When KCl was puffed at the cell, a large inward current was observed, which slowly diminished as KCl diffused. Red fluorescent dye was added to the KCl solution to indicate the spatial distribution of drug delivery and was imaged using combined DIC and epifluorescent imaging. This experiment illustrated the ease and flexibility of our system to control manipulator/microscope movement and external hardware through TTL signals.
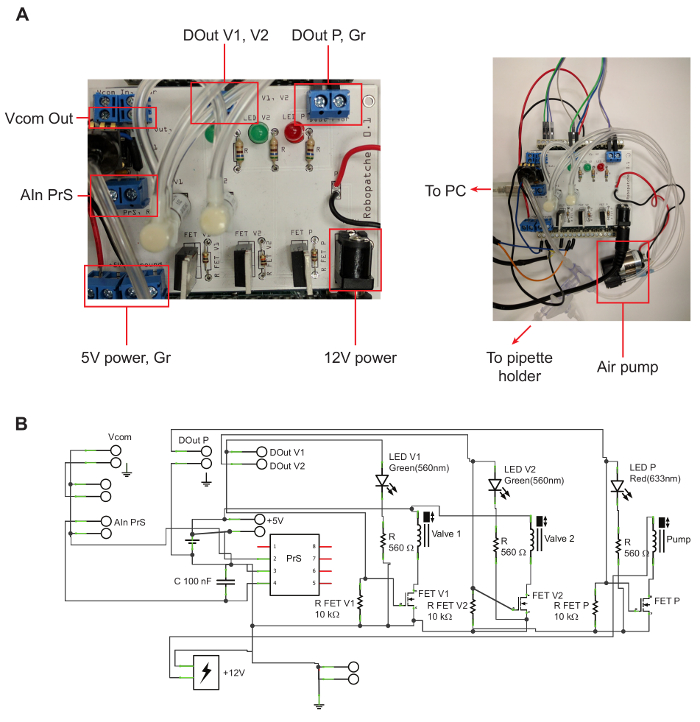
Figure 1. Pressure Control Unit. A: Printed Circuit Board (PCB) for connecting the valves, pressure sensor, and air pump. The left shows details on the PCB, labeling locations of outputs that are mentioned in the protocol. The right shows the connection between the PCB and the air pump, USB port, and tubing. B: Circuit map for the PCB. Please click here to view a larger version of this figure.
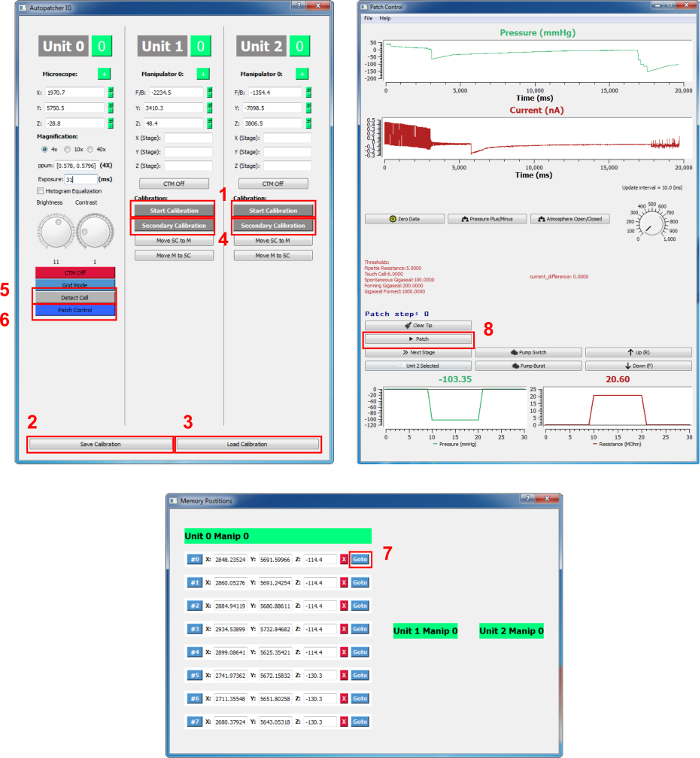
Figure 2. Autopatcher GUI. The buttons mentioned in the protocol are shown in red squares and are numbered. 1: Start Calibration, 2: Save Calibration, 3: Load Calibration, 4: Secondary Calibration, 5: Detect Cell, 6: Patch Control, 7: Go to (target cell coordinate), and 8: Patch. Please click here to view a larger version of this figure.
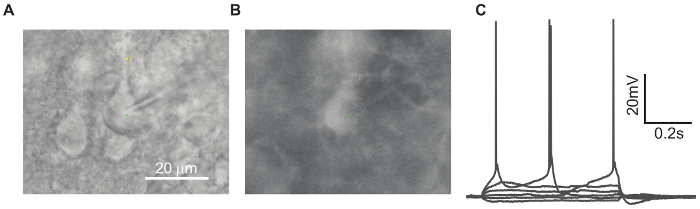
Figure 3. An Example of the Patched ChR2-YFP-positive Cell. A: 40X magnification under DIC optics. B: Epifluorescence image of the same cell in panel A (LED illumination at 488 nm). C: Current-clamp recordings from the patched cell during a series of hyperpolarizing and depolarizing step current injections. Please click here to view a larger version of this figure.
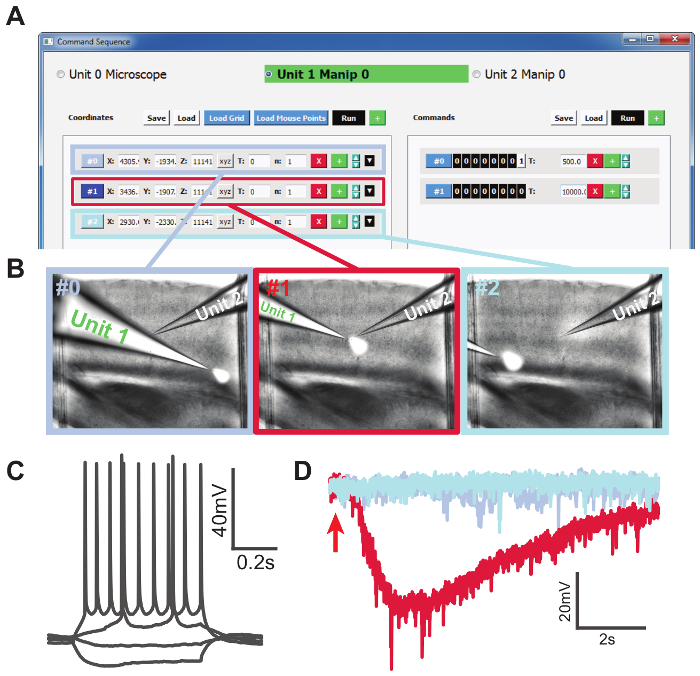
Figure 4. Conducting an Automated Drug Delivery Experiment. A: Selected locations loaded to the "Command Sequence" GUI. The left column shows the list of coordinates, and the right column shows the list of commands in the form of TTL signals for each location. B: Screenshots during the drug application experiment corresponding to the three selected locations. Unit 1 was the KCl-containing pipette and Unit 2 was the patching pipette. KCl solution was mixed with red fluorescent dye for the purpose of visualization. Images were obtained by combining DIC and fluorescence imaging. C: Step current injections showing a regular spiking neuron. D: Voltage-clamp recording traces from the local application of 500 mM KCl solution at three locations. The red trace with inward current was recorded from the trial when KCl application was close to the patched cell. The red arrow indicates the timing of KCl application. Please click here to view a larger version of this figure.
Outlet on the PCB | Port name on the DAQ board | Port # on DAQ board | Remark |
DOUT V1 | Port A channel 1 | 22 | Control valve 1 |
DOUT V2 | Port A channel 2 | 23 | Control valve 2 |
DOUT P | Port A channel 3 | 24 | Control air pump |
Gr | Ground | 29 | Ground |
Table 1. Printed Circuit Board (PCB) to secondary data acquisition (DAQ) board connection configuration. Use this table to connect PCB outputs (first column from left) to ports on the DAQ board (second column from left). The port name and number on the secondary DAQ refer to single-ended mode.
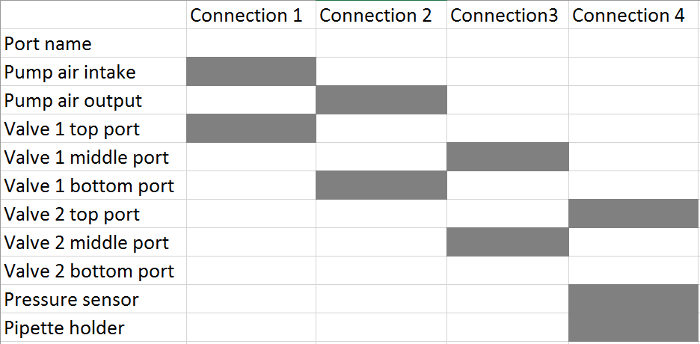
Table 2. Tubing Connections from the Pressure Control Unit to the Pipette Holder(s). For each connection, connect the corresponding ports, highlighted with a grey box, using soft tubing (see the Table of Materials).
Here, we describe a method for automatic image-guided patch clamp recordings in vitro. The key steps in this process are summarized as follows. First, computer vision is used to automatically recognize the pipette tip using a series of images acquired via a microscope. This information is then used to calculate the coordinate transformation function between the microscope and the manipulator coordinate systems. Computer vision is used to automatically detect fluorescently labeled cells and to identify their coordinates. These steps are integrated with pipette targeting and the automatic patching algorithm using the open-source Python programming language, PyQT, and OpenCV libraries.
Compared to existing in vitro patch clamp methods, this system makes significant improvements in the several areas. It minimizes human intervention. This system automates most of the steps in the patch clamp experiment, minimizing the requirement for human intervention. Some of the remaining manual steps, including switching between the low-/high-magnification microscope lenses, can be automated using additional motorized hardware.
The patch-clamp method improves throughput. Patch-clamp experiments using this system achieved higher success rates and shorter times for each trial, contributing to a significant increase in overall throughput. The computer vision algorithm for fluorescent cell detection and pipette tip detection is very robust, and the error rate was very low. The average error for pipette tip detection was 1.6 µm, and the false-positive rate for fluorescent cell detection was 4.9% ±2.25%. A detailed comparison between traditional manual patching and automatic patching has been made6.
Detailed documentation of experiments is possible. Patch logs of each trial can be saved and analyzed post hoc. Such detailed documentation was not previously available for manual patching. This allows for the systematic analysis of patching experiments in unique experimental conditions, cell types, species, and slice preparations.
This method shows compatibility with standard in vitro patch clamp equipment. Our system, as demonstrated in this manuscript, is designed to augment existing in vitro patch clamp rigs, giving them the capacity to conduct automatic patching. Unlike the planar patch approach, this system is suitable for laboratories already conducting manual patch clamping to convert their equipment at minimal cost. At the same time, there is still the option to patch manually or semi-automatically using the same system.
Because of the adaptability of the system mentioned above, connecting the hardware and configuring the software is required by the experimenter when the system is set up for the first time. Problems may result from incorrect port assignment and inadequate driver libraries for the control of certain hardware. Please refer to steps 1.2 – 1.4 when troubleshooting.
Compared to the partial automation of existing systems, this system achieves the maximum level of automation in the conventional in vitro patch clamping of acute brain slices (and other in vitro preparations). This is true for all steps, from cell detection to pipette calibration to patching7,11. The only bottleneck is the manual process of filling and changing the patch pipettes between trails. Recent developments in the reuse of patch pipettes can potentially solve this problem12. Besides the quality of slice preparation, the most common reason for unsuccessful trials originates from manipulator mechanical errors and the movement of the slice in the chamber. These limitations are beyond our control in the current system. Efforts are being made to implement close-loop, real-time detection and control of pipette movement to account for this problem.
For future development, we are interested in expanding the current fluorescent cell detection capabilities to general cell detection under DIC optics.
The authors have nothing to disclose.
We are grateful for the financial support from the Whitehall Foundation. We would like to thank Samuel T. Kissinger for the valuable comments.
CCD Camera | QImaging | Rolera Bolt | |
Electrophysiology rig | Scientifica | SliceScope Pro 2000 | Include microscope and manipulators. The manufacturer provided manipulator control software demonstrated in this manuscript is “Linlab2”. |
Amplifier | Molecular Devices | MultiClamp 700B | computer-controlled microelectrode amplifier |
Digitizer | Molecular Devices | Axon Digidata 1550 | |
LED light source | Cool LED | pE-100 | 488nm wavelength |
Data acquisition board | Measurement Computing | USB1208-FS | Secondary DAQ. See manual at : http://www.mccdaq.com/pdfs/manuals/USB-1208FS.pdf |
Solenoid valves | The Lee Co. | LHDA0531115H | |
Air pump | Virtual industry | VMP1625MX-12-90-CH | |
Air pressure sensor | Freescale semiconductor | MPXV7025G | |
Slice hold-down | Warner instruments | 64-1415 (SHD-40/2) | Slice Anchor Kit, Flat for RC-40 Chamber, 2.0 mm, 19.7 mm |
Python | Anaconda | version 2.7 (32-bit for windows) | https://www.continuum.io/downloads |
Screw Terminals | Sparkfun | PRT – 08084 | Screw Terminals 3.5mm Pitch (2-Pin) |
(2-Pin) | |||
N-Channel MOSFET 60V 30A | Sparkfun | COM – 10213 | |
DIP Sockets Solder Tail – 8-Pin | Sparkfun | PRT-07937 | |
LED – Basic Red 5mm | Sparkfun | COM-09590 | |
LED – Basic Green 5mm | Sparkfun | COM-09592 | |
DC Barrel Power Jack/Connector (SMD) | Sparkfun | PRT-12748 | |
Wall Adapter Power Supply – 12VDC 600mA | Sparkfun | TOL-09442 | |
Hook-Up Wire – Assortment (Solid Core, 22 AWG) | Sparkfun | PRT-11367 | |
Locking Male x Female X Female Stopcock | ARK-PLAS | RCX10-GP0 | |
Fisherbrand Tygon S3 E-3603 Flexible Tubings | Fisher scientific | 14-171-129 | Outer Diameter: 1/8 in. Inner Diameter: 1/16 in. |
BNC male to BNC male coaxial cable | Belkin Components | F3K101-06-E | |
560 Ohm Resistor (5% tolerance) | Radioshack | 2711116 | |
Picospritzer | General Valve | Picospritzer II |