Zebrafish have been used as reliable genetic model organisms in biomedical research, especially with the advent of gene-editing technologies. When larval phenotypes are expected, DNA extraction and genotype identification can be challenging. Here, we describe an efficient genotyping procedure for zebrafish larvae, by tail clipping, as early as 72-h post-fertilization.
Method Article
High-throughput DNA Extraction and Genotyping of 3dpf Zebrafish Larvae by Fin Clipping
In This Article
Summary
Abstract
Zebrafish (Danio rerio) possess orthologues for 84% of the genes known to be associated with human diseases. In addition, these animals have a short generation time, are easy to handle, display a high reproductive rate, low cost, and are easily amenable to genetic manipulations by microinjection of DNA in embryos. Recent advances in gene editing tools are enabling precise introduction of mutations and transgenes in zebrafish. Disease modeling in zebrafish often leads to larval phenotypes and early death which can be challenging to interpret if genotypes are unknown. This early identification of genotypes is also needed in experiments requiring sample pooling, such as in gene expression or mass spectrometry studies. However, extensive genotypic screening is limited by traditional methods, which in most labs are performed only on adult zebrafish or in postmortem larvae. We addressed this problem by adapting a method for the isolation of PCR-ready genomic DNA from live zebrafish larvae that can be achieved as early as 72 h post-fertilization (hpf). This time and cost-effective technique, improved from a previously published genotyping protocol, allows the identification of genotypes from microscopic fin biopsies. The fins quickly regenerate as the larvae develop. Researchers are then able to select and raise the desired genotypes to adulthood by utilizing this high-throughput PCR-based genotyping procedure.
Introduction
The zebrafish (Danio rerio) is a vertebrate organism widely used as a model for disease investigation as well as for preclinical testing of therapeutic hypotheses1,2,3. These animals have a short generation time, are easy to handle, display a high reproductive rate, low cost, and are easily amenable to genetic manipulations by microinjection of DNA in embryos4. Through the increasing development of novel transgenic and gene editing technologies such as Zinc-Finger nucleases (ZFN)5, TAL-like Effector Nucleases (TALENs)6,7, and the Clustered Regularly Interspaced Short Palindromic Repeats (CRISPR)/CRISPR-associated 9 (Cas9) system8, the zebrafish is poised to substantially improve the understanding of several pathologic conditions. These technologies have been used to create targeted knockouts in both somatic and germline cells in zebrafish, efficiently engendering genetically modified animals8. Recent examples in the literature include the successful development of genetic models of epilepsy and metabolic disorders in zebrafish3,9,10,11,12.
With the progress made in zebrafish genome editing, rapid and reliable genotyping has become an undeniable rate-limiting step. Identification of specific DNA mutations adjacent to the predicted genome-editing target site is an essential stage of the protocol. Traditionally, genotyping techniques by fin clipping are usually only performed in juvenile or adult zebrafish. However, the time spent raising zebrafish to adulthood (>2 months) considerably delays advancements in research. In many cases, adulthood cannot be achieved due to the knockout of essential genes (e.g., in disease modeling) or gain-of-function mutations leading to detrimental phenotypic effects. In addition, several assays require pooling of larvae, such as in RNA or metabolite extraction, and thus involve prior identification of the genotypes, which can be challenging when only post hoc genotyping techniques are available. These aforementioned examples highlight the importance of larval genotyping techniques which are at the same time precise and enable full recovery and normal development of the larvae. Early stage zebrafish genotyping does not currently appear to be widely used; this is reflected by recent publications of disease models in which larval genotypes are identified via post-mortem genotyping rather than genotyping prior to the execution of the experiment12,13,14. In this paper, a larval fin clip strategy is presented aiming to improve previously established genotyping procedures.
In the past, strategies employing proteinase K digestion to genotype live zebrafish larvae have led to variable polymerase chain reaction (PCR) efficiency15. Although a more recently published microscopic tail biopsy technique provided more promising results16, we and other groups were not able to reproduce the high efficiency and DNA recovery reported by the authors. A major setback of the protocol described by Wilkinson et al.16 could be the transfer of the tail tissue to the PCR tube. Due to its microscopic size, it is hard to ensure that the fin was properly collected and dispensed by pipetting. To address this barrier, we have developed an improved protocol for genotyping large numbers of live zebrafish larvae with nearly 100% efficiency9. Using a microscalpel, the tip of the fin tail is removed and placed onto a piece of filter paper. The piece of filter paper containing the tissue can be readily visualized and correctly placed into a PCR tube. Genomic DNA extraction is then performed, followed by PCR amplification of the region of interest to genotype the specimen. The advantages of this method include a high PCR efficiency, a low false positive rate and a low mortality rate. Additionally, genotyping of large numbers of embryos is possible using this protocol. The protocol described herein allows fin-clipping of hundreds of larvae within 2 - 3 h using this approach and correct identification of genotyped fish and tail regeneration within two days.
Protocol
Procedures involving animal subjects have been approved and are in accordance with animal care guidelines provided by the Canadian Council on Animal Care and the University of Ottawa animal care committees.
1. Preparation
- Prepare the dissection surface by taping a 9 cm Petri dish lid with autoclave tape across its interior surface. Position it under a stereo-microscope.
- Place 3 - 5 days post-fertilization (dpf) zebrafish larvae in a Petri dish and anesthetize in ˜1.5 mM Tricaine in 1x E3 embryo media (5 mM NaCl, 0.17 mM KCl, 0.33 mM CaCl2, 0.33 mM MgSO4, pH 7.2).
- Cut off the end of a P1000 pipette tip with a pair of scissors or a razor blade to a diameter of 2 mm to accommodate a 3 dpf larva with minimal stress.
2. Fin Clipping of Zebrafish Larvae
- Pick up an anesthetized larva using the modified P1000 micropipette and place the zebrafish larva onto the positioned autoclave tape on the Petri dish lid.
- Remove excess Tricaine solution surrounding the larva using a micropipette. The area should be as dry as possible to successfully section and pick up the fin but still wet to ensure survival.
- Using a micro scalpel, section the caudal fin under a stereo-microscope as indicated in Figure 1, as described in Wilkinson et al16. During the incision, apply a steady downward pressure within the pigment gap site of the caudal fin, distal to the limit of the blood circulation (Figure 1A). Apply gentle pressure to avoid damaging the notochord.
- Visualize the sectioned fin under the microscope and position the piece on top of the tip of the microscalpel blade (Figure 2A). Place the microscalpel containing the fin onto the surface of a small piece of filter paper.
NOTE: Due to the presence of melanocytes in the transected tissue, this step allows visualization of the fin as a small black spot (Figure 2B). - Using scissors and tweezers (Figure 2C), transfer the filter paper containing the fin to a 96-well PCR plate, containing 25 μL of 50 mM NaOH solution per well (Figure 2D).
- Prepare a flat-bottom 96-well plate, numbering the well according to the label of the PCR plate. Using the modified P1000 pipette filled with 200 µL of fresh 1x E3 embryo media, carefully collect the zebrafish larva using gentle pressure. Dispense the larva in the 96-well tissue culture plate, in the same well number as the PCR plate (Figure 2E).
- Make sure that the filter paper is well submerged in the solution (Figure 2F). Clean the blade of the microscapel and tweezers between each cut to prevent cross-contamination by dipping it into 70% EtOH solution. Wipe the blade with clean paper tissue/wipe.
- Repeat steps 2.1 - 2.7 until all embryos have been clipped.
- Store the larvae in the 96-well plate at 28 °C until the genotypes have been identified.
NOTE: The embryo media does not need to be changed, since the protocol can be easily completed in less than 2 days. If more time is needed, a media change is recommended.
3. Genomic DNA Extraction
- Seal the 96-well PCR plate and centrifuge the samples at 1,000 x g for 1 min to make sure all the filter papers are submerged within the NaOH solution.
- For tissue lysis, heat the samples in a thermocycler at 95 °C for 5 min followed by cooling to 4 °C for 10 min.
- Add 6 μL of 500 mM Tris-HCl, pH 8.0 to each sample. Vortex.
- Briefly centrifuge the plate at 1,500 x g, for 5 min at room temperature.
- Use 1.5 μL of the DNA supernatant per PCR reaction.
- Prepare a PCR to genotype the larvae, as shown in Table 1-2.
NOTE: This protocol was tested for two applications: multiplex PCR reactions revealing the genotype using agarose gels9, and heteroduplex melting assay (HMA) revealing the genotypes using polyacrylamide gel electrophoresis (PAGE)17.
4. Alternative Genomic Extraction Using a Chelating Resin
- Complete step 2.5 by adding filter paper with the clipped fin to a 96-well PCR plate, containing 30 μL of 5% chelating resin (styrene-divinylbenzene copolymer containing paired iminodiacetate ions).
NOTE: This type of resin is commonly used for tissue lysis and preparation of PCR-ready DNA in a fast and efficient manner18. - Follow steps 2.6 - 2.8 as indicated.
- Seal the 96-well PCR plate and briefly centrifuge the samples to make sure all filter paper is submerged within the chelating resin.
- For tissue lysis, heat the samples in a thermocycler at 95 °C for 15 min followed by cooling to 4 °C for 10 min.
NOTE: This step allows lysis and subsequent binding of the polar resin beads to cellular components while DNA and RNA remain in solution. - Briefly centrifuge the samples to pellet the resin beads and obtain the DNA in the suspension.
- Follow steps 3.5 - 3.6 to complete genotyping procedure.
5. Application 1: Multiplex PCR Followed by Agarose Gel Analysis
- Following Table 1, set up a multiplex PCR reaction to enable the discrimination between homozygous mutants, heterozygotes, and WT larvae. Use a 96-well thermal cycler to perform the PCR reactions using the cycling conditions described in Table 3.
NOTE: The PCR reactions can also be performed in any other conventional PCR thermal cycler. This example describes the PCR strategy used by Pena, et al.9 to identify aldh7a1 WT and 5-bp insertion mutant alleles in the same multiplex reaction. - Prepare a 1% agarose gel in sodium borate buffer, stained with 1x GelRed.
NOTE: 20x sodium borate buffer stock is made of 40 mL of 10 M NaOH, 1800 mL of ddH2O, pH adjusted to 8.5 with 76 g of boric acid and then completed to 2 L final volume using ddH2O. - Run the gel in 1x sodium borate buffer for 15 min at 250 V. To facilitate the process, if possible, use a gel system that is compatible with multichannel pipets to enable higher throughput capabilities by reducing the time to load samples.
- Image the gel under ultraviolet (UV) light to allow discrimination of the different genotypes.
6. Application 2: Heteroduplex Melting Assay
- Prepare PAGE 12% gels using the 1.5 mm spacer plate and the 15-samples combs. Prepare two PAGE gels using 12.21 mL of ddH2O, 2.52 mL of 10x Tris/Borate/EDTA (TBE), 10 mL of 30% acrylamide, 250 μL of 10% ammonium persulfate (APS) and 20 μL of tetramethylethylenediamine (TEMED). Use 1x TBE buffer (0.089 M Tris-HCl, 0.089 M boric acid and 0.002 M ethylenediaminetetraacetic acid (EDTA)) as running buffer.
- Heat the PCR products at 94 °C for 5 min.
- Cool the tubes on ice or in the thermocycler for 10 min at 4 °C.
- Load 10 μL per PCR sample and 8 μL of molecular weight marker.
- Run the PAGE at 150 V in 1x TBE using a vertical electrophoresis system for 1 h or until the molecular weight marker almost reaches the foot line of the glass plate.
- Image the gel under UV light to allow discrimination of the different genotypes.
Results
The efficiency of the protocoll was demonstrated by genotyping the offspring of an heterozygous cross (aldh7a1+/ot100, here shown as aldh7a1+/-) (Figure 3A-C)9. The aldh7a1ot100 mutant allele has a 5-base pair (bp) insertion in the first coding exon of the zebrafish aldh7a1 gene that leads to frameshift and loss-of-function due to an early stop codon9. Four primers were used in a multiplex reaction to obtain three distinctive bands to differentiate between WT, heterozygous (aldh7a1+/-), and homozygous mutant (aldh7a1-/-) genotypes (from Pena, et al.9): Gen1_FW 5'-ATGATGCAGCGCGTGCTGAC-3', "Gen2_RV":5' -CCCTTTGAACCTCACAGGAGTT-3', "5 nt-ins-specific_FW":5'-TGTTTTCAACGGTTCAACGG-3', and "WT-specific_RV":5'-TCCCTGTCCTCCCCAAGAAC-3'). The amplification of both alleles using the Gen1_FW and Gen1_RV primers resulted in a 434-bp amplicon. A 293-bp band arose from specific amplification of the mutant allele, and a 195-bp band was obtained specifically for the WT allele, as shown in Figure 3A. Following PCR, 8 µL of each 20 µL reaction volume was analyzed on a 1% agarose/sodium borate gel, as shown in Figure 3B. Sufficient larval DNA was recovered from 98% (n = 576) of the samples, resulting in a high PCR efficiency rate. DNA extraction using the NaOH technique obtains on average 4.7 0.5 ng/µL of larval DNA per sample following the fin biopsy procedure, in ~30 µL volume. DNA extraction using chelating resin results in a similar yield, on average 3.8 0.5 ng/µL of DNA per sample. This amount of DNA collected from larval fin transections generates PCR-ready genomic DNA of sufficient quality to allow for the identification of genotypes. Each DNA sample can be used in ˜30 PCR amplification reactions. Amplification products obtained using primers Gen1_FW and Gen2_RV can also be used for sequencing applications9, which successfully identified the 5-bp insertion in the homozygous mutants (aldh7a1-/-) (Figure 3C). Sanger sequencing was performed via an external service to test if the PCR products were suitable for this application. DNA samples from agarose-gel confirmed homozygous mutants and WTs (n = 3 each) were used. High Phred19 scores (>30) were obtained indicating high quality reads, except for the first and last 40 base pairs.
This protocol was subsequently used to genotype various other zebrafish mutations by heteroduplex melting analysis. The plpbpot101 and plpbpot102 mutant alleles of the plpbp gene (Figure 4A-D) each lead to a frameshift and early stop codon. In order to identify plpbp-null zebrafish larvae, two primers were used to amplify the first coding exon including the mutation site (plpbp-F 5'-GCACTCTGGCTATGTGGAGA-3' and plpbp-R 5'-AGCTGTCACTCATCCCTCGT-3'). The amplification of the plpbp fragment in WT animals results in a 272-bp amplicon (homoduplex). The amplicon obtained from plpbpot101 (4-bp deletion allele, Figure 4C) consists of a fragment of 268-bp and that of the plpbpot102 (5bp-substitution, 2-bp deletion allele, Figure 4D), 270-bp, as seen in Figure 4A-B. After denaturation and annealing, the PCR fragments from heterozygous animals would contain heteroduplex and homoduplex DNA17. Homoduplex and heteroduplex bands can be easily separated and visualized using polyacrylamide gel electrophoresis (PAGE). The presence of an open angle between matched and mismatched DNA strands caused by imperfect annealing due to the occurrence of mutations cause the heteroduplex DNA to migrate at a significantly slower pace than homoduplex DNA17. Distinct migration patterns are produced by distinct mutations. The heterozygous genotypes (plpbp+/ot101, plpbp+/ot102) would therefore display heteroduplex DNA fragments, as well as the compound heterozygous (plpbpot101/ot102) (Figure 4A-B). Precise genotyping is obtained by this heteroduplex melting assay as a unique PAGE pattern is obtained for each genotype and distinct heterozygous mutations can be visualized (Figure 4A-B). Homozygous mutants would display a homoduplex pattern in the PAGE gel and therefore be indistinguishable to WTs. To distinguish these genotypes, another round of PAGE gel analyses should be performed in which PCR products from WT alleles need to be mixed with the samples to be studied, as described elsewhere17.
About 90% (88/98) of WT and heterozygous embryos were successfully raised to adulthood (>2 months). As aldh7a1 and plpbp are loss-of-function mutants that display an early death phenotype, untreated animals could not be raised to adulthood. However, the genotypes of all surviving WT and heterozygous adults were identical to larval fin clipping results, indicating a 100% accuracy rate for the identification of genotypes using the larval fin biopsy procedure.
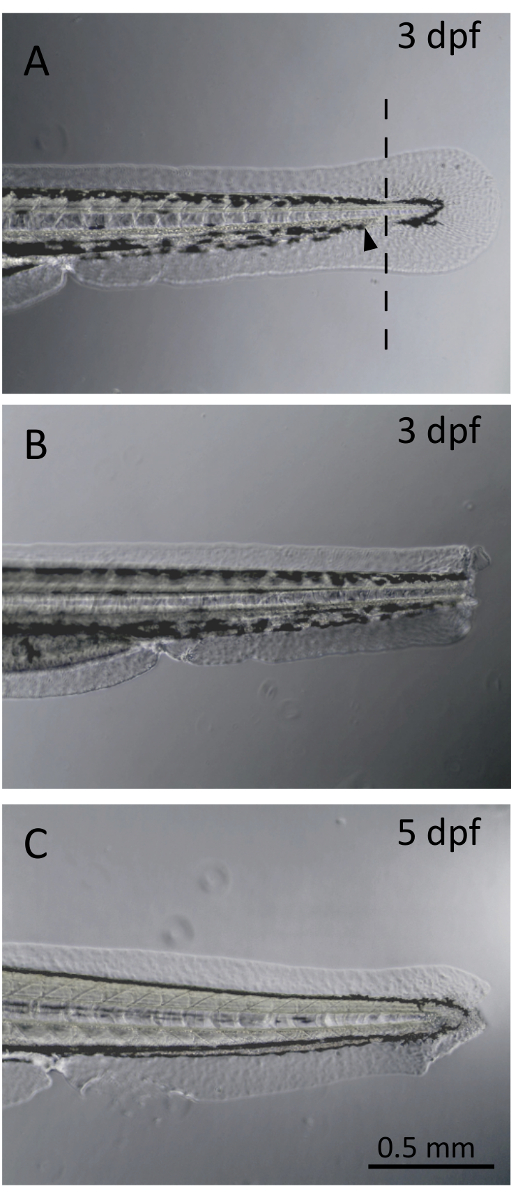
Figure 1. Larval fin clip. (A). Non-severed larval fin at three days post-fertilization (dpf). The line represents the site of transection, located within the pigment gap. The black arrowhead demonstrates the limit of the caudal blood circulation. (B). Larva following fin clipping procedure at 3 dpf. (C). Larval zebrafish fin regrowth at 5 dpf. Fin regeneration from a blastemal formation is observed only 2 days post-fin transection. Please click here to view a larger version of this figure.
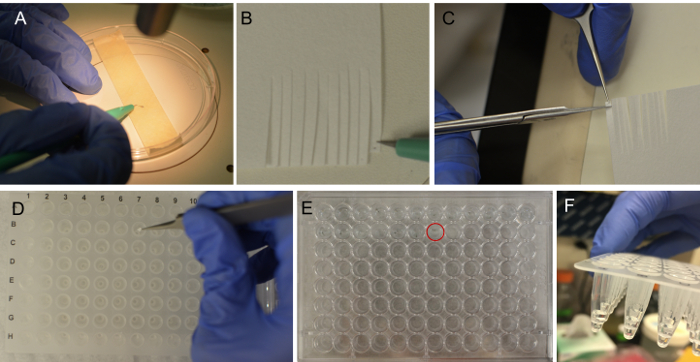
Figure 2. Procedure for larval fin clipping. (A). The larvae are placed onto the tape and excess embryo media is removed. Under the microscope, the fin is transected at the region of the pigment gap as shown in Figure 1A. Using a microscalpel, the fin is collected and placed onto a filter paper surface simply by touch (B), and can be readily visualized as a black spot. Hold the piece of filter paper containing the fin and cut a small square surrounding the desired region (C). Place the small piece of filter paper containing the fin into a well of a 96 well plate (D). The corresponding larva should be placed into the corresponding well of a flat-bottom 96-well plate in 200 µL of embryo media (E). The filter paper piece should be submerged in the lysis solution (F). Please click here to view a larger version of this figure.
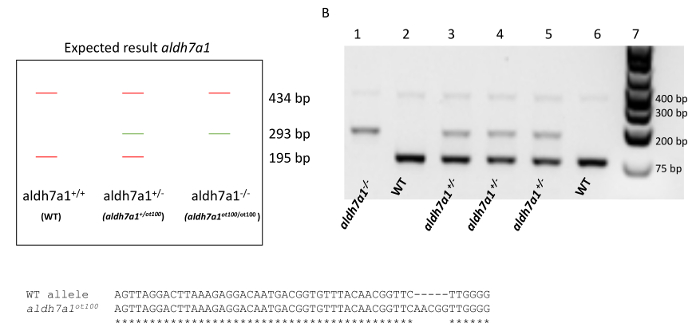
Figure 3. Genotyping of aldh7a1 heterozygous cross from larval fin biopsies. (A). Expected result where amplification of both WT and aldh7a1ot100 alleles results in a 434-bp amplicon. A 293-bp band arises from amplification of the mutant allele (aldh7a1ot100, 5-bp insertion), and a 195-bp band is obtained for the WT allele. (B). Example of PCR amplification from aldh7a1 larval fin tissues. A 1 kb molecular weight marker is shown in lane 7. Lanes 1 - 6 each represent a single fin biopsy. PCR results identify aldh7a1-/- (aldh7a1ot100/ot100) genotypes (lane 1), aldh7a1+/- heterozygous genotypes (aldh7a1+/ot100) (lanes 3, 4, and 5) and WT (aldh7a1+/+) genotypes (lanes 2 and 6). (C). Alignment between the sequenced WT and aldh7a1ot100 allele showing the position of the 5-bp insertion mutation. This figure was adapted from the Supplemental Figure 5 of Pena et al.9 with permission granted from the Genetics Society of America. Please click here to view a larger version of this figure.
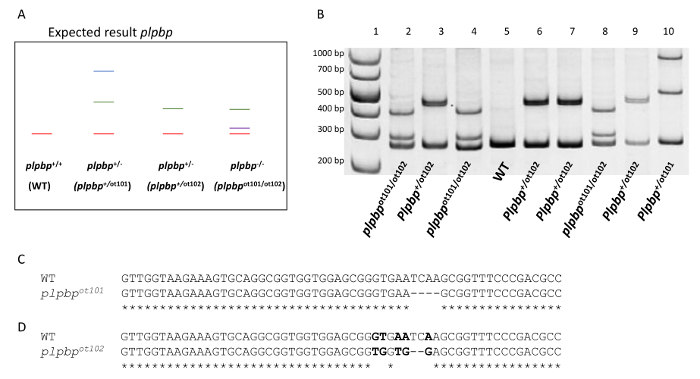
Figure 4. Genotyping of plpbp compound heterozygous (2 bp deletion /4 bp deletion) from larval fin biopsies. (A). Expected result where amplification of the WT allele resulted in a 272-bp amplicon. The 4-bp deletion allele (plpbpot101) and the 5-bp substitution with 2-bp deletion allele (plpbpot102) produce amplicon lengths of 268-bp and 270-bp respectively. A heteroduplex is formed between a WT allele and the mutant allele in a heterozygous genotype (plpbp+/-). Formation of a heteroduplex due to mismatching alleles will cause retardation of the band within the gel compared to the WT homoduplex. (B). PCR amplification resulting from larval fin clippings of the offspring of a plpbp+/ot101x plpbp+/ot102 cross. A 1 kb molecular weight marker is shown in lane 1. Lanes 2 - 10 each represent a single fin biopsy. PCR results identify mutant genotypes (plpbp-null compound heterozygous plpbpot101/ot102, lanes 2, 4, and 8), heterozygous genotypes (lanes 3, 6, 7, 9, and 10) and WT genotypes (lane 5). (C). Alignment between the sequenced WT and plpbpot101 allele showing the position of the 4-bp deletion mutation. (D). Alignment between the sequenced WT and plpbpot102 allele showing the position of the 2-bp deletion and 5-bp substitution (bold). Please click here to view a larger version of this figure.
| Components | 20 μl reaction | 100 reactions | Final Conc. |
| Nuclease-free H2O | 7.45 μL | 745 μL | |
| Go-Taq 2x (Promega, M7122) | 10 μL | 1000 μL | 1x |
| primer Gen1_FW | 0.25 μL | 25 μL | 0.125 μM |
| primer 5 nt-ins-specific_FW | 0.3 μL | 30 μL | 0.15 μM |
| Primer Gen2_RV | 0.25 μL | 25 μL | 0.125 μM |
| Primer WT-specific_RV | 0.25 μL | 25 μL | 0.125 μM |
| DNA | 1.5 μL | -- |
Table 1. Reaction conditions for multiplex PCR used for the aldh7a1 allele in this protocol. The primers used are as follows: Gen1_FW 5'-ATGATGCAGCGCGTGCTGAC-3', "Gen2_RV":5' -CCCTTTGAACCTCACAGGAGTT-3', "5 nt-ins-specific_FW":5'-TGTTTTCAACGGTTCAACGG-3', and "WT-specific_RV":5'-TCCCTGTCCTCCCCAAGAAC-3'. Primer stocks were 10 µM.
| Components | 13 μl reaction | 100 reactions | Final Conc. |
| H2O | 3.25 μL | 325 μL | |
| Go-Taq 2x (Promega, M7122) | 6.25 μL | 625 μL | 1x |
| primer FW | 1 μL | 100 μL | 0.77 μM |
| Primer RV | 1 μL | 100 μL | 0.77 μM |
| DNA | 1.5 μL | -- |
Table 2. Reaction conditions for PCR used for plpbp allele in this protocol. The forward primer used was PLPBP-F 5'-GCACTCTGGCTATGTGGAGA-3' and the reverse, PLPBP-R 5'-AGCTGTCACTCATCCCTCGT-3'. Primer stocks were 10 µM.
| Cycle Step | Temp. | Time | Cycles |
| Initial denaturation | 95 °C | 3 min | 1 |
| Denaturing | 95 °C | 30 sec | 36 |
| Annealing* | X °C | 30 sec | |
| Extension | 72 °C | 20 sec/kb | |
| Final Extension | 72 °C | 5 min | 1 |
| 4 °C | hold |
Table 3. PCR conditions used in this protocol.
Discussion
Gene editing tools have been employed to precisely introduce mutations and transgenes in zebrafish over the past years5,6,7,8. When performing disease modeling in zebrafish, early larval or juvenile phenotypes are often observed9,12,13,14. The protocol presented here describes the extraction of PCR-ready DNA from small zebrafish larval tail biopsies, enabling genotyping of larvae as young as 3 dpf. Early identification of genotypes is crucial for several laboratory applications, especially when post hoc genotyping is not possible9. Knowing genotypes from an early age also facilitates survival studies and phenotypic analysis of mutants. This protocol is also particularly useful for the raising of larvae of specific genotypes to maturity. Larval genotyping is not yet widely used in zebrafish laboratories across the world and this protocol aims to facilitate the dissemination of this technique. While manipulating the transected fins, the use of this method provides confidence as to the presence of DNA within the sample; the fin biopsy can be readily visualized as a dark spot on the filter paper throughout the handling process. This represents an important improvement of the protocol published by Wilkinson et al.16.
Several critical steps within the protocol must be correctly followed to obtain quality results. First and foremost, the transection of the larval fin must occur within the pigment gap, distal to the limit of the blood circulation, to avoid bleeding. This ensures survival of the larvae during the fin biopsy. Moreover, a black dot on the filter paper, marking the placement of the fin, must be observed before placing the filter paper in the NaOH solution. This assures the presence of fin tissue (and therefore, DNA) in each sample well. The filter paper must also be immersed within the NaOH solution to guarantee cell lysis and successful DNA extraction. This protocol was not tested for younger ages than 3 dpf as only hatched larvae were used. To genotype younger embryos (unhatched <3 dpf) chorion removal would be required. In case that insufficient PCR amplification occurs, standard PCR optimization strategies should be applied (e.g., varying primer concentration, annealing temperature, and/or DNA concentration). Although sufficient DNA is extracted to successfully perform several types of PCR reactions (as shown for aldh7a1 and plpbp genotyping examples), the concentration of DNA obtained following this fin clipping procedure is small (~5 ng/µL per sample) and thus, increasing the concentration of DNA in the PCR reaction may allow for greater success of amplification.
The larval fin DNA extracted with this protocol can be used for several amplification reactions, allowing accurate identification of larval zebrafish genotypes and in a high-throughput manner. A heteroduplex melting assay in PAGE gels can be used to identify different mutations17. Given that ~30 μL of DNA is obtained per sample, and ~1 - 1.5 μL of DNA is used per PCR reaction, approximately 30 PCR reactions can be run per extracted sample. The PCR products are also suitable for Sanger sequencing applications; high quality of reads were obtained, allowing accurate confirmation of WT and homozygous mutant sequences for aldh7a1. Genomic-DNA extraction from larval zebrafish has many applications in research. The original goal for developing this protocol was to effectively genotype larvae that cannot reach adulthood due to specific mutations in the aldh7a19. In addition, this protocol enabled the segregation of genotypes and the observation of epilepsy-associated phenotypes specifically in aldh7a1-/- fish from the larval stage onward9. The pooling of larvae of each genotype for approaches such as RNA extraction or metabolite extraction can be accurately executed after genotyping using this larval fin clipping procedure9. In conclusion, after a short period of training, an experienced investigator can use this simple and time-efficient protocol, requiring only minimal and inexpensive reagents, to routinely perform hundreds of fin clips per day. The use of this protocol made possible the research described by Pena et al. and will hopefully serve a similar purpose for the broader Zebrafish community.
Disclosures
The authors declare that they have no competing financial interests.
Acknowledgements
The authors would like to thank the Rare Disease Models and Mechanism (RDMM) Network (funded by the Canadian Institutes of Health Research (CIHR) and Genome Canada). CK is supported by a UROP scholarship award (University of Ottawa). DLJ is supported by a Vanier Canada Graduate Scholarship. IAP is supported by a Canadian Institutes of Health Research (CIHR) postdoctoral fellowship award. The authors thank the Genetics Society of America for granting permission to publish this protocol and to use an adaptation of the Supplemental Figure 5 from Pena, et al.
Materials
| Name | Company | Catalog Number | Comments |
|---|---|---|---|
| Petri dish | Corning | 430167 | |
| Microscalpel | World Precision Instruments | 500249 | |
| Stereomicroscope | Nikon | SMZ1500 | |
| Tricaine/Ethyl 3-aminobenzoate methanesulfonate | Sigma-Aldrich | E10521 | |
| 96-well Tissue-culture plate | Costar | 3595 | |
| 96-well PCR plate | Fisher | 14230232 | |
| NaOH | Fisher | S25548A | |
| Tris base | Sigma-Aldrich | T1503 | |
| NaCl | Fisher | BP358-10 | |
| KCl | Sigma-Aldrich | P3911 | |
| MgSO4 | Sigma-Aldrich | 230391 | |
| 5% Chelex 100 sodium form | Sigma-Aldrich | C7901 | |
| GelRed 1x | Biotium | 41003 | |
| Boric Acid | Sigma-Aldrich | B6768 | |
| Sub-Cell Model 192 system | Bio-Rad | 1704508 | |
| 30 % Acrylamide/Bis Solution, 37.5: 1 | Bio-Rad | 1610158 | |
| GoTaq Green Master Mix, 2X | Promega | M7123 | |
| paper wipes (Kimwipes® disposable wipers) | Sigma-Aldrich | Z188956 | |
| 1kb-plus molecylar weight marker | Thermo Scientific | SM1343 | |
| Nuclease free water | Sigma-Aldrich | W4502 | |
| Sub-Cell Model 192 system (high-throughput agarose gel system) | Bio-Rad | 1704508 | |
| vertical gel electrophoresis system Mini-PROTEAN Tetra Cell | Bio-Rad | 1658004 |
References
- Howe, K., et al. The zebrafish reference genome sequence and its relationship to the human genome. Nature. 496 (7446), (2013).
- Stewart, A. M., Kalueff, A. V. Developing better and more valid animal models of brain disorders. Behav Brain Res. 276, 28-31 (2015).
- Grone, B. P., Baraban, S. C. Animal models in epilepsy research: legacies and new directions. Nat Neurosci. 18 (3), 339-343 (2015).
- Rosen, J. N., Sweeney, M. F., Mably, J. D. Microinjection of Zebrafish Embryos to Analyze Gene Function. J Vis Exp. (25), e1115(2009).
- Doyon, Y., et al. Heritable targeted gene disruption in zebrafish using designed zinc-finger nucleases. Nat Biotechnol. 26 (6), 702-708 (2008).
- Bedell, V. M., et al. In vivo Genome Editing Using High Efficieny TALENs. Nature. 491 (7422), 114-118 (2012).
- Sander, J. D., et al. Targeted gene disruption in somatic zebrafish cells using engineered TALENs. Nat Biotechnol. 29 (8), 697-698 (2012).
- Hwang, W. Y., et al. Efficient genome editing in zebrafish using a CRISPR-Cas system. Nat Biotechnol. 31 (3), 227-229 (2013).
- Pena, I. A., et al. Pyridoxine-Dependent Epilepsy in Zebrafish Caused by Aldh7a1 Deficiency. Genetics. 207, 1501-1518 (2017).
- Baraban, S. C., Dinday, M. T., Hortopan, G. A. Drug screening in Scn1a zebrafish mutant identifies clemizole as a potential Dravet syndrome treatment. Nat Commun. 4, 2410(2013).
- Godoy, R., Noble, S., Yoon, K., Anisman, H., Ekker, M. Chemogenetic ablation of dopaminergic neurons leads to transient locomotor impairments in zebrafish larvae. J Neurochem. 135, 249-260 (2015).
- Scheldeman, C., et al. Neurobiology of Disease mTOR-related neuropathology in mutant tsc2 zebra fish Phenotypic, transcriptomic and pharmacological analysis. Neurobiol Dis. 108 (September), 225-237 (2017).
- Zabinyakov, N., et al. Characterization of the first knock-out aldh7a1 zebrafish model for pyridoxine-dependent epilepsy using CRISPR-Cas9 technology. PLoS One. 12 (10), 1-14 (2017).
- Grone, B. P., et al. Epilepsy, behavioral abnormalities, and physiological comorbidities in syntaxin-binding protein 1 (STXBP1) mutant zebrafish. PLoS One. 11 (3), (2016).
- Kawakami, K., Hopkins, N. Rapid identification of transgenic zebrafish. Trends Genet. 12 (1), 9-10 (1996).
- Wilkinson, R. N., Elworthy, S., Ingham, P. W., van Eeden, F. J. M. A method for high-throughput PCR-based genotyping of larval zebrafish tail biopsies. Biotechniques. 55 (6), 314-316 (2013).
- Zhu, X., et al. An efficient genotyping method for genome-modified animals and human cells generated with CRISPR/Cas9 system. Sci Rep. 4, 6420(2014).
- Walsh, P. S., Metzger, D. A., Higuchi, R. Chelex 100 as a medium for simple extraction of DNA for PCR-based typing from forensic material. Biotechniques. 54 (3), 506-513 (2013).
- Ewing, B., Green, P. Basecalling of automated sequencer traces using phred. II. Error probabilities. Genome Res. 8, 175-185 (1998).
Reprints and Permissions
