Here, we present a protocol for live-imaging of fluorescently labeled human endometrial fragments grafted in mice. The method allows studying the effects of drugs of choice on endometriotic lesion size through monitoring and quantification of fluorescence emitted by the fluorescent reporter on real time
Here, we describe a protocol for the implementation of a heterologous mouse model in which progression of endometriosis can be assessed in real time through noninvasive monitoring of fluorescence emitted by implanted ectopic human endometrial tissue. For this purpose, biopsies of human endometrium are obtained from donor women ongoing oocyte donation. Human endometrial fragments are cultured in the presence of adenoviruses engineered to express cDNA for the reporter fluorescent protein mCherry. Upon visualization, labeled tissues with an optimal rate of fluorescence after infection are subsequently chosen for the implantation in recipient mice. One week prior to the implantation surgery, recipient mice are oophorectomized, and estradiol pellets are placed subcutaneously to sustain the survival and growth of lesions. On the day of surgery mice are anesthetized, and peritoneal cavity accessed through a small (1.5 cm) incision by the linea-alba. Fluorescently labeled implants are tweezed, briefly soaked in glue and attached to the peritoneal layer. Incisions are sutured, and animals left to recover for a couple of days. Fluorescence emitted by endometriotic implants is usually non-invasively monitored every 3 days for 4 weeks with an in vivo imaging system. Variations in the size of endometriotic implants can be estimated in real time by quantification of the mCherry signal and normalization against the initial time-point showing maximal fluorescence intensity.
Traditional preclinical rodents of models of endometriosis do not allow non-invasive monitoring of lesion in real time but rather allow evaluation of the effects of drugs assayed at the end point. This protocol allows one to track lesions in real time and is more useful to explore the therapeutic potential of drugs in preclinical models of endometriosis. The main limitation of the model thus generated is that non-invasive monitoring is not possible over long periods of time due to the episomal expression of Ad-virus.
Endometriosis is a chronic gynecologic disorder initiated by the implantation of the functional endometrium outside the uterine cavity. Ectopic lesions grow and induce inflammatory processes leading to chronic pelvic pain and infertility1. It is estimated that up to 10–15% of women of reproductive age are affected by endometriosis2, and it is present in approximately 40–50% of infertile women3. Current pharmacological treatments for endometriosis are unable to completely eradicate lesions and not free of side effects4,5. The research for more efficient therapies requires of the refinement of the existing animal models of endometriosis in such a way that human lesions can be appropriately mimicked, and the effects of compounds on lesion size among others can be closely assessed.
Primate models have been used to mimic endometriosis by implanting ectopic lesions histologically identical and at similar sites as in humans6,7,8; however, ethical concerns and the high economic costs related to experimentation with primates limit their use9. Consequently, the use of small animals, especially rodents, for the implementation of in-vivo models of endometriosis continues to be favored as it allows studies with larger numbers of individuals10,11. Endometriosis can be induced in these animals by transplanting either pieces of rodent uterine horns ("homologous models")12,13 or human endometrial/endometriotic tissue to ectopic sites (heterologous models)14. In contrast to humans, rodents do not shed their endometrial tissue and thereby endometriosis can not be developed spontaneously in these species. Therefore, homologous mouse models of endometriosis have been criticized due to the fact that implanted ectopic mouse uterine tissue does not reflect the characteristics of human endometriotic lesions15.
Appropriate physiology of endometriosis can be mimicked in the heterologous models of endometriosis where fresh human endometrial fragments are implanted into immunodeficient animals. In conventional heterologous models, the therapeutic effects of compounds of interest are commonly assessed at the end point by the assessment of lesion size with the use of calipers16. An obvious limitation is that, as such, endpoint animal models do not allow studying implantation dynamics or endometriotic lesion development over time. An additional limitation is that the use of calipers does not allow accurate measurements of lesion size. Indeed, the standard error provided by calipers is in the same range (i.e., millimeters) as the size of the lesions implanted in mice, thus restricting the capacity of these tools to detect actual variations in size.
In order to overcome such limitations, herein, we describe the generation of a heterologous mouse model of endometriosis in which implanted human tissue is engineered to express a reporter m-Cherry fluorescent protein. Detection of the fluorescent signal with an appropriate image system enables non-invasive monitoring of lesion status with simultaneous quantification of its size in real time. Thus, our model provides clear advantages when compared to conventional endpoint models as it brings the opportunity of real-time non-invasive monitoring and the possibility to perform more objective and accurate estimation of variations in lesion size.
The use of human tissue specimens was approved by the Institutional Review Board and Ethics Committee of the Hospital Universitario La Fe. All patients provided written informed consent. The study involving animals was approved by the Institutional Animal Care Committee at the Centro de Investigacion Principe Felipe de Valencia, and all procedures were performed following the guidelines for the care and use of mammals from the National Institutes of Health.
1. Endometrial Tissue Collection and Pre-processing
2. Adenoviral Transfection of Endometrial Fragments
NOTE: All the materials that are going to be employed in the process should be introduced in the hood in advance. Take out everything that is not going to be used in the process and place a flask with bleach. All material that comes into contact with the adenoviral vector must be disinfected with the bleach before discarding it in the biohazard container.
3. Generation of the Endometriosis Mouse Model
NOTE: Use 6–8 week-old athymic nude (or similar immunocompromised strains) female mice housed in specific pathogen–free conditions, as recipient animals. To avoid hormonal cycle-dependent variations and simultaneously fuel lesion growth with estradiol, animals are ovariectomized and placed with 60-day release capsules containing 18 mg of 17 βeta-Estradiol (17β-E2). Oophorectomy and pellet placement have to be performed at least one week in advance of grafting endometrial fragments into the recipient animals.
4. In Vivo Fluorescent Imaging with an In Vivo Imaging System
5. Quantification of In Vivo Fluorescence Images
6. Data (fluorescent signal) Normalization
Here, we describe the process for creating a heterologous model of endometriosis in which the architecture of lesions is preserved by implanting fluorescently labeled pieces of human endometrium into immunocompromised mice, thus allowing non-invasive monitoring of lesion progression. Labeling of endometrial fragments is achieved by infection with adenovirus engineered to express mCherry, a protein emitting fluorescence in the near infrared region. In Figure 1, we show representative images of human endometrial fragments infected with Ad-mCherry observed under the fluorescence microscope. For illustrative purposes, both labeled and non-labeled fragments are included so differences in fluorescence between infected and non-infected tissues (autofluorescence) can be noted. During monitoring, in addition to the reference wavelength for mCherry, fluorescent images are taken with different pairs of excitation/emission wavelengths filters (Figure 2) to define the characteristic fluorescent emission profile of tissues. The purpose of this action is to "unmix" actual fluorescence emitted by lesions from background and autofluorescence emitted by host tissues and scar originated during surgery respectively. An illustrative example of the unmix process is shown in Figure 3. Estimations of variation in lesion size is performed by quantifying and normalizing fluorescent signaling emitted by lesions during the time course. For this purpose, images of monitoring containing raw fluorescence emitted by animals during each time point are first brought together unnormalized (Figure 4) in a single file. Subsequently fluorescence is unmixed, normalized and represented as a false color image (Figure 5). Finally, ROIs corresponding to specific lesion and background signaling are automatically recognized by the program and quantified (Figure 6). Background ROI signaling is subtracted from lesion ROI signaling and results of intensity in each time point are normalized against the time point at which intensity is maximal (Figure 7). At the end of the monitoring process, several weeks after surgery mice are sacrificed and viable implant can be recovered attached to the mouse peritoneum (Figure 8).
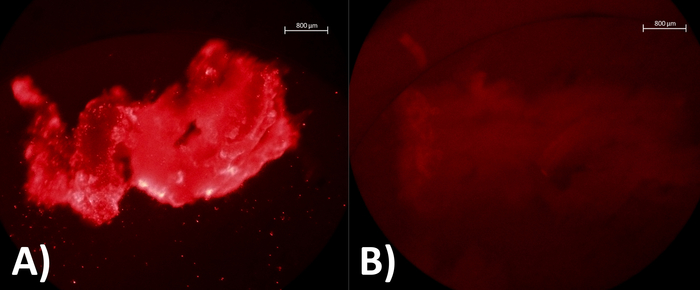
Figure 1: Visualization of endometrial fragments with fluorescence microscope after Ad-mCherry infection. (A) Human endometrial fragment incubated with Ad-mCherry at 37 °C and 5% CO2 during 24 h as a positive sample. (B) Human endometrial fragment incubated at 37 °C and 5% CO2 without Ad-mCherry as a negative control sample. Please click here to view a larger version of this figure.
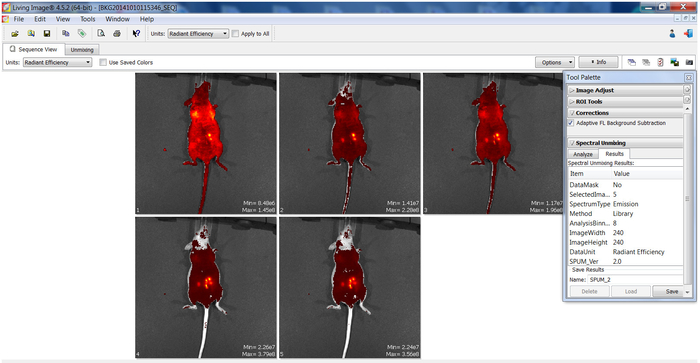
Figure 2: Raw imaging fluorescence emitted by labeled fragments implanted in mice. Picture shows representative imaging of raw fluorescence signal emitted by the same animal at a specific time point. Images correspond to screenshots obtained using software coupled to an in vivo imaging system device during a monitoring session. Each panel containing mice (numbered 1–5 in the left corner) corresponds to the fluorescence observed by using a different specific excitation/emission pair filter for acquiring images. Panel on the right (tool palette) show fluorescence parameters selected for acquisition of images Please click here to view a larger version of this figure.
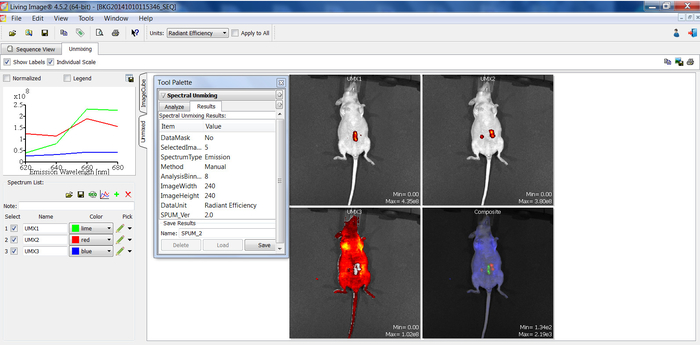
Figure 3: Unmixing of background vs specific fluorescence emitted by lesions. Picture shows representative images of the unmixing process performed to dissect actual fluorescence from lesions using the in vivo imaging system coupled software. Graph on the left panel denote normalized specific profiles of fluorescence emission by scar (green line, UMX1), lesions (red line, UMX2) and host tissue (blue line, UMX3 panel). Fluorescence intensity at different emission wavelengths (X-axis) is represented in units of radiant efficiency (Y-axis). Just note how each specific structure (i.e., scar, labeled lesions and host tissue) emits a different fluorescence profile which allows identifying and segregating them specifically form each other. On the right panel, fluorescence arising from launching specific emission profiles for scar (UMX1), lesions (UMX2) and host tissue (UMX3) are shown superposed on photograph images of mice. A composite image (Composite) is also included for illustrative purposes to denote the segmentation of fluorescence emitted by lesions from that emitted by scar or host tissues. Middle panel shows parameters selected for unmixing with the image software coupled to the in vivo imaging device Please click here to view a larger version of this figure.
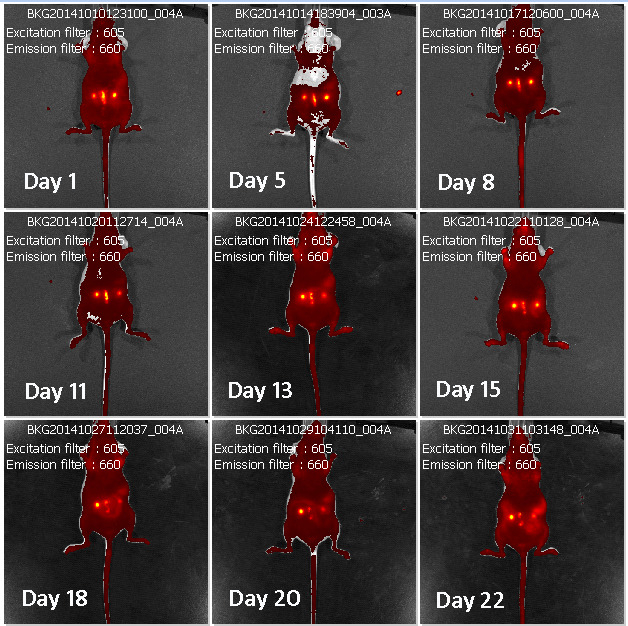
Figure 4: Time course monitoring of raw fluorescence emitted by lesions. Panel shows representative images of raw fluorescence emitted by a single mouse implanted with labeled human lesions (brilliant yellow spots) during the time course. Time points after surgery at which monitoring was performed are denoted as "Day (number)". Emission ad excitation pair filters used for monitoring are indicated in each panel/image. Each panel is identified by a specific code (BKG) in the upper part containing info related to the date at which fluorescence was acquired.
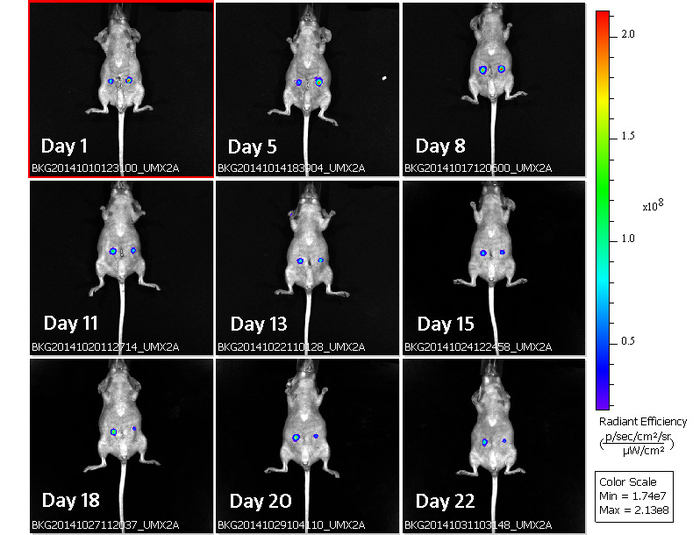
Figure 5: Time course monitoring of normalized fluorescence emitted by lesions. Representative images corresponding to unmixed, normalized fluorescent signaling emitted by human lesions (spots with rainbow color) superposed in a single mouse during the time course (days after surgery). Time points after surgery at which monitoring was performed are denoted as "Day (number)".Each panel is identified by a specific code (BKG) in the lower part containing info related to the date at which fluorescence was acquired. Rainbow palette color on the right side identifies fluorescence intensity (Radiant efficiency) emitted by lesions at each time point. Note how strong fluorescence intensity during the initial time points (i.e., red color in the center of lesions on days 1,5 and 8) declines during the time course (i.e., blue color in lesions on days 20 and 25). Please click here to view a larger version of this figure.
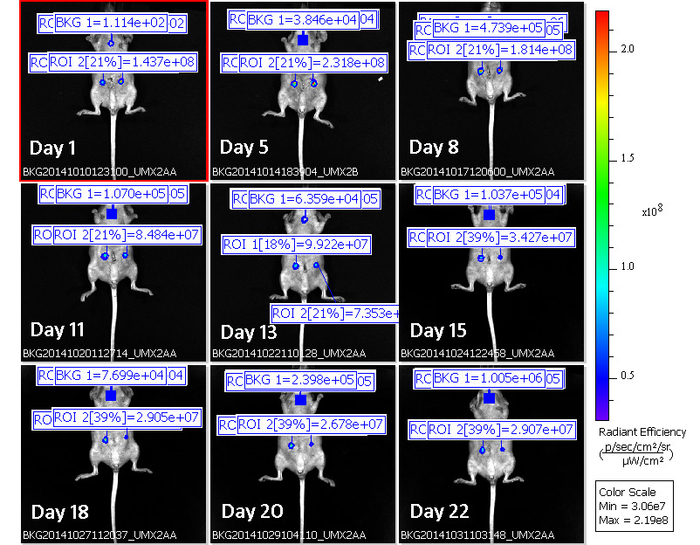
Figure 6: Use of ROIs for quantification of fluorescence intensity in lesions during the time course. Figure shows panel of images of normalized fluorescence emitted by lesions in a single mouse during the time course (i.e., Figure 5) with the addition of ROIs (delineating lesions and background) for quantification of fluorescence intensity. ROI 1 and ROI 2 identify the amount of fluorescence emitted by each of the two lesions during the time course. BKG identify the amount of fluorescence emitted by the host tissue (background fluorescence) during the time course. Background fluorescence is subtracted from ROIs for quantification purposes. Time points after surgery at which monitoring was performed are denoted as "Day (number)". Images acquired at each time point are labeled with a specific code (BKG) at the bottom of each one containing info related to the date at which fluorescence was acquired (first eight digits following BKG detail data for year(2014)-month (10) and -day(10 to 31)), an individual identification code (last 6 digits) and the specific profiles of fluorescence emission used for unmixing (UMX2) Rainbow palette color on the right side provides a visual scale of fluorescence intensity (Radiant efficiency) emitted by lesions at each time point. Note how fluorescence intensity values in the two lesions (ROI1 and ROI2) are higher at the initial time points (days 1 and 5) and decays during the time course to reach the lowest values at the end time points (days 20 and 25). Please click here to view a larger version of this figure.
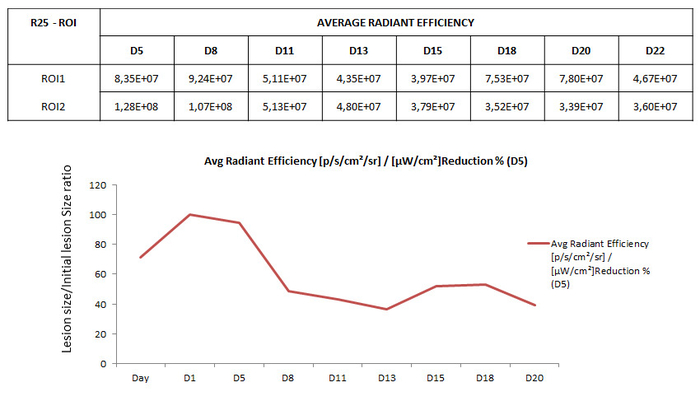
Figure 7: Normalization of fluorescence intensity during the time course. Table in the upper part shows illustrative example of the values of fluorescence intensity (radiant efficiency) emitted by two mCherry labeled lesions (ROI1 and ROI2) implanted in a mouse (R25). Monitoring of fluorescence was performed at different days after surgery (D5-D25) during the time course. D5- Graph at the bottom illustrates typical pattern of normalized fluorescence emitted by lesions infected with mCherry decaying during the time course. Y-axis shows values of fluorescence normalized to express the percentage of decay by using the formula (Signal intensity at each time point / Maximal signal intensity observed during the time course) x 100. Time points (Days (Dx) after implanting surgery) at which fluorescence was monitored are indicated in the X-axis. Note initial increase of signaling during the first 24 h after surgery, corresponding to stabilization of lesion, the peak in fluorescence intensity around D1-D5 and its subsequent decay due to episomal expression of mCherry during the time course Please click here to view a larger version of this figure.
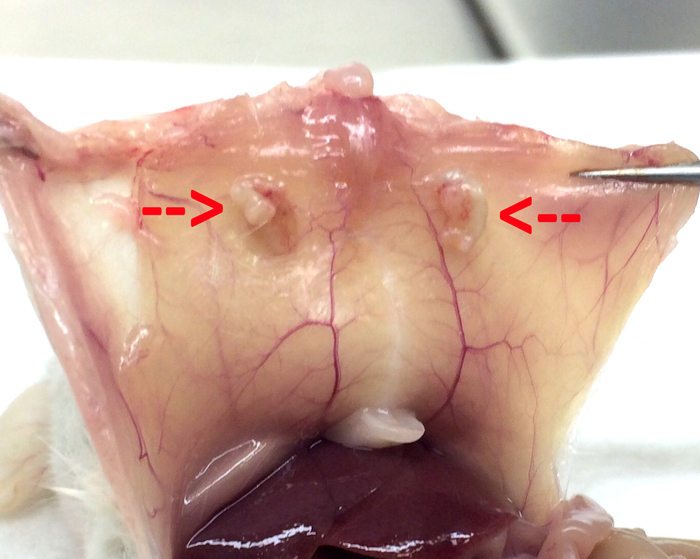
Figure 8: Macroscopic appearance of implanted endometriotic lesions. Representative images showing macroscopic appearance of endometriotic lesions implanted in mice at the end of the monitoring process upon sacrifice Please click here to view a larger version of this figure.
The protocol herein detailed describes the implementation of an animal model of endometriosis in which the architecture of implanting lesions architecture is preserved whilst simultaneously allowing real time assessment of fluorescence emitted by mCherry labeled endometrial tissue. In this protocol, we describe the use of a specific in vivo imaging system and related software to non-invasively assess fluorescence emitted by the labeled lesion. Each user should adapt the protocol depending on the specific imaging device and related software available at their institution. Monitoring is performed in anesthetized animals through an isoflurane gas anesthesia machine coupled to an in vivo imaging system. To avoid interference with auto-fluorescence emitted by wounds, it is recommended to start monitoring lesions fluorescence at least three days after implantation surgery.
Heterologous mouse models of endometriosis similar to the one herein shown have been previously described consisting in the implantation endometrial fragments labeled with green fluorescent protein (GFP)18,19. The use of mCherry as a reporter for tagging the human tissue provides however an advantage over GFP because of the enhanced tissue penetration of the former. Due to its larger emission spectrum and higher photostability mCherry emits a brighter signal that is more appropriate for the visualization of intraperitoneal fragments.
Due to its small size adenoviruses are the vectors of choice for infection (i.e., labeling) of whole tissue pieces as those provide acceptable diffusion through 3D structures. Even with that the percentage of tissue infected cells is not higher than 30–35%. Thus, the limitation of this model relies on the inefficient labeling of tissue and additionally the transient expression achieved by adenoviruses. Indeed, fluorescence cannot be monitored beyond 4–6 week as it fades progressively due to the episomal transient expression of the Ad-virus. Efficiency of labeling and the period of monitoring might be increased by disrupting the donor tissue and infecting isolated single epithelial/stromal cells with ad-virus previous to being injected into recipient mice19,20. Such an approach, however, reduces the extent at which the animal model mimics the physiology of endometriosis provided that ectopic human lesions do not consist in a disorganized accumulation of single epithelial/stromal cells but rather in well-structured endometriotic tissue.
In this protocol, the most critical step is the labeling of the tissue and most specifically the determination of the appropriate concentration of ad-virus required for optimal infection. Indeed, the 1 x 10¹⁰ pfu/mL concentration pointed out in the protocol is mostly an orientative/consensus figure based on our experience. The optimal concentration might differ in each experiment depending on the type and quality of the biopsy and/or how quickly this is processed. We thus suggest testing at least three different (two-fold) titers in each experiment and choosing the one providing optimal labeling based on visualization under the fluorescence microscope.
Our protocol/model is useful to study the mechanisms implicated in the establishment and early development of the endometriotic lesions. In spite of the period of time of monitoring is constrained, the model is still useful to study and detect the effects of pharmacological compounds able to exert dramatic effects on lesion size in a short period of time such as antiangiogenic or antiestrogenic drugs. The development of more efficient and durable methods of labeling human tissue are expected to spread non-invasive monitoring as a consolidated technique to explore the potential therapeutic of a wider range of drugs in preclinical model endometriosis.
The authors have nothing to disclose.
This work was supported by Spanish Ministry of Economy and Competitiveness through the Miguel Servet Program [CP13/00077] cofounded by FEDER (European Regional Development Fund) and awarded to Dr R. Gómez as well as by Carlos III Institute of Health grants awarded to Dr R Gómez [PI14/00547 and PI17/02329] and to Prof A. Cano [PI12/02582].
Endosampler™ | Medgyn | 22720 | Cannula for sampling the uterine endometrium |
DMEM Medium | VWR | HYCLSH30285.FS | Medium |
Ad-mCherry | Vector Biolabs | 1767 | Adenoviral vector expressing mCherry |
PBS, 1X solution, sterile, pH 7,4 | VWR | E504-500ML | Buffer for washes |
Pellets 17-B-Estradiol 18 mg/ 60 days | Innovative Research of America | SE-121 | Hormone pellets for rodents |
Vetbond™ Tissue Adhesive | 3M | 780-680 | Tissue adhesive |
Petri dishes in polystyrene crystal | Levantina | 367-P101VR20 | Petri dishes |
Penicillin-Streptomicin | Sigma | P4333-100ML | Antibiotics |
Syringes, medical 10 ml 0,5 ml | VWR | CODA626616 | Syringes |
Nitrile gloves, powder-free | VWR | 112-2754 | Gloves |
Soft swiss nude mice | Charles River | SNUSSFE05S | Mice for animal experiment |
Ivis Spectrum In vivo Imaging system | Perkin Elmer | 124262 | In vivo Monitoring equipment |
Living Image® (Ivis software) | Perkin Elmer | — | In vivo monitoring software |
Fetal Bovine Serum | Gibco | 10082147 | Enrichment serum |
96-well cell culture treated plates | Life technologies | 167008 | Culture plates |
Urine flasks | Summedical | 4004-248-001 | Flasks for washes |
Sterile surgical blades | (Aesculap Division) Sanycare | 1609022-0008 | Surgical blades |
Isovet 1000 mg/g | B-BRAUN | — | Isoflurane (Anesthetic) |
Buprex® 0.3 mg | Schering Plough S.A. | — | Buprenorphine (Analgesic solution) |
Injectable morphine solution 10 mg/mL | B BRAUN | — | Morphine (Analgesic solution) |
Monofyl® Absorbable Sutures | COVIDIEN | — | Sutures |
Desinclor chlorhexidine | Promedic SA | — | Antiseptic solution |
Microscopy DMi8 | Leica Mycrosystems | — | fluorescence microscope |
Hera Cell 150 Incubator | Thermo Scientific | 51026282 | Incubator |