This protocol introduces a light-spot assay to investigate Drosophila larval phototactic behavior. In this assay, a light spot is generated as light stimulation, and the process of larval light avoidance is recorded by an infrared light-based imaging system.
The larvae of Drosophila melanogaster show obvious light-avoiding behavior during the foraging stage. Drosophila larval phototaxis can be used as a model to study animal avoidance behavior. This protocol introduces a light-spot assay to investigate larval phototactic behavior. The experimental set-up includes two main parts: a visual stimulation system that generates the light spot, and an infrared light-based imaging system that records the process of larval light avoidance. This assay allows tracking of the behavior of larva before entering, during encountering, and after leaving the light spot. Details of larval movement including deceleration, pause, head casting, and turning can be captured and analyzed using this method.
The larvae of Drosophila melanogaster show obvious light-avoiding behavior during the foraging stage. Drosophila larval phototaxis has been under investigation, especially in the past 50 years1,2,3,4,5,6,7,8. In recent years, despite the fact that 1) many neurons mediating larval light avoidance have been identified4,5,9,10,11,12 and 2) the complete connectome of larval visual system at the resolution of synapses has been established13, the neural mechanisms underlying larval phototaxis remain largely unclear.
A number of behavioral assays have been used in studying larval phototaxis. They can be largely divided into two classes: one involving spatial light gradients and the other involving temporal light gradients. For spatial light gradient assays, the arena is divided into equal number of sections in light and dark. The arena can be divided into light and dark halves2,4 or light and dark quadrants14,15, or can even be separated into alternate light and dark squares like on a checkerboard7. Usually, agar plates are used for spatial light gradient assay, but tubes that are divided into alternate light and dark sections can also be used10,14.
In older version of assays, light illumination generally originates from below the larvae. However, illumination in newer versions largely originates from above, since larval eyes (e.g., the Bolwig's organs that are sensitive to low or medium light intensities16) are contained in the opaque cephalopharyngeal skeleton with openings towards the upper front. This makes larvae more sensitive to light from upper front directions than from below behind directions7. For temporal light gradient assays, the light intensity is spatially uniform in the arena, but the intensity changes over time. In addition to temporal square wave light (i.e., flashing on/off or strong/weak light3,7), temporally varying light that conforms to a linear ramp in intensity is also used8 to measure the sensitivity of larvae to a temporally changing light stimulus.
A third type of phototaxis assay is the directional light scape navigation, which involves illumination from above at an angle of 45°7. Before the work of Kane et al.7, only coarse parameters such as the number of larvae in light and dark regions, frequency of turning, and trail length were calculated in larval phototaxis assays. Since the work of this same group, with the analysis of high temporal resolution video record for larval phototaxis, detailed dynamics of larval movement during phototaxis (i.e., instant speeds of different parts of larval body, heading direction, turning angle and corresponding angular velocity) have been analyzed7. Thus, more details of larval phototaxis behavior have been able to be discovered. In these assays, larvae are tested in groups so that group effects are not excluded.
This protocol introduces a light-spot assay for the investigation of larval behavioral responses to individual light stimulation. The main experimental set-up consists of a visual stimulation system and infrared light-based imaging system. In the visual stimulation system, an LED light source generates a round 2 cm-diameter light spot on an agar plate, where the larva is tested. The light intensity can be adjusted using an LED driver. The imaging system includes an infrared camera that captures the behavior of the larva in addition to three 850 nm infrared LEDs that provide illumination for the camera. The lens of the camera is covered by an 850 nm band-pass filter to block light from the visual stimulation system from entering the camera, while the infrared light is allowed to enter the camera. Thus, interference of visual stimulation on imaging is prevented. In this assay, the behavioral details of the fast responses of individual larvae within a period including before, during, and after entering light are recorded and analyzed.
1. Preparation of Drosophila larvae
2. Preparation of agar plates
3. Set-up of visual stimulation system
4. Set-up of the imaging system
5. Setting parameters of imaging
6. Video recording of light avoidance behavior
7. Data analysis
According to the protocol, the light spot assay was used to investigate light avoidance behavior of third instar larva that were raised at 25 °C on standard medium in a room with a 12 h/12 h light/dark cycle. A single w1118 larva was tested using the light spot assay at 25.5 °C. The average light intensity of the light spot generated by a 460 nm LED was 0.59 µW/cm2. The whole process of larval entering and exiting the light spot was recorded and analyzed using SOS software and custom written scripts12,17. Time curves of tail speed, body bending angle, and angular speed of body bending of a representative larva are shown in Figure 2 and Movie 1.
To investigate the effects of octopaminergic neurons on larval light avoidance, third instar larvae with octopaminergic neurons inhibited by expressing tetanus toxin (UAS-TNTG) with a Tdc2-Gal4 driver were tested with the light-spot assay. As shown in Figure 3, the size of the larval head cast (maximal body bending angle) was significantly reduced compared to the parental controls, indicating that the Tdc2-Gal4 neurons are necessary for a normal larval light response.
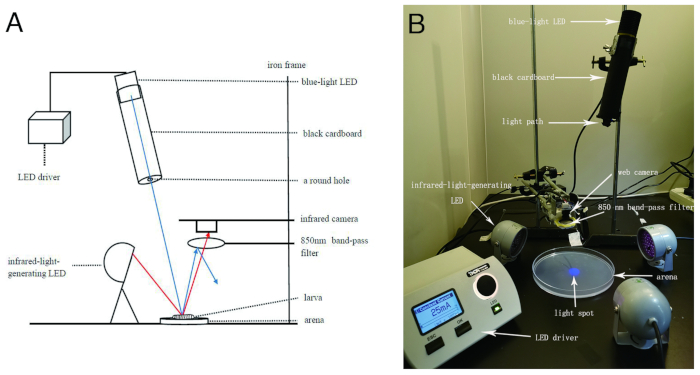
Figure 1: Experimental set-up. (A) Schematic representation of the set-up for the light spot-based larval fast phototaxis assay. The blue lines represent the paths of visible light used as visual stimulation, and the red lines represent the paths of infrared light. Arrows indicate the direction of the light. The 850 nm band-pass filter allows infrared light to pass, but it blocks visible light. (B) An image of the set-up for the light spot assay. It should be noted that the image was taken under light conditions for better visualization. Please click here to view a larger version of this figure.
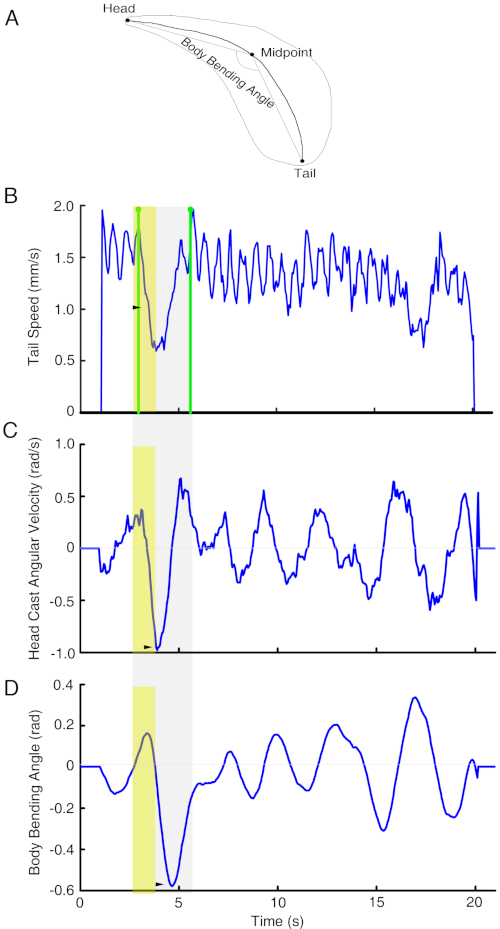
Figure 2: Quantitative description of the reaction of a larva when entering a light spot. (A) A diagram showing the parameters used in measuring larval body movement. The contour of a larva is shown in thin line. The thick line shows the skeleton of thinned larval body contour. The two ends and midpoint of skeleton line are assigned as positions of larval head, midpoint and tail. The angle between the line from the head to midpoint and the line from midpoint to tail is the body bending angle. The speed of the change of body bending angle over time is defined as angular velocity of larval head cast. Represented here are tail speed (B, tailspeed), head cast angular velocity (C, headomega), and body bending angle (D, headtheta) of a w1118 larva that enters and leaves a light spot. Green lines mark the timepoint that the larval head entered and left the light spot. The time window of a strong deceleration period is in yellow. Arrow heads point to deceleration periods and related peaks in head cast angular velocity and body bending angle. The behavioral process is shown in Movie 1. This figure has been modified from Gong et al.12. Please click here to view a larger version of this figure.
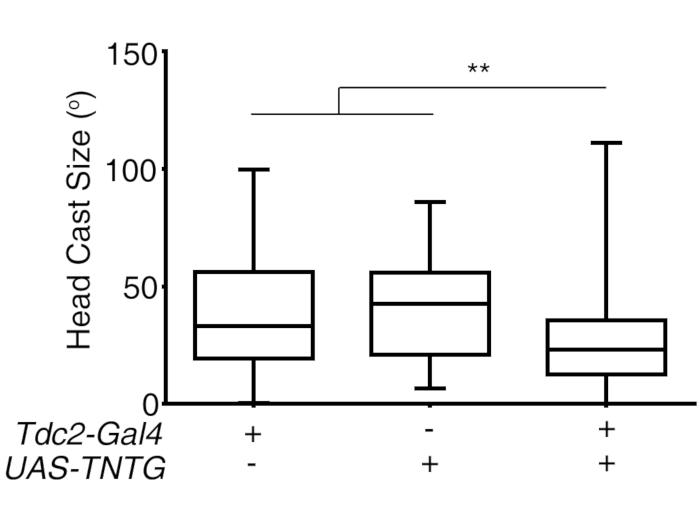
Figure 3: Inhibiting Tdc2-Gal4 labeled neurons using tetanus toxin TNTG reduces the size of larval head cast in response to light spot entrance. **, P < 0.01, n = 81, 52, 92; Kruskal-Wallis test followed by post hoc Dunn's multiple comparison test was used. This figure has been modified from Gong et al.12. Please click here to view a larger version of this figure.
Movie 1: A w1118 larva enters and leaves a light spot in the light spot assay. Light spot with edge smoothed is in white. The track of larval head is shown. Corresponding curves of larval tailspeed, headtheta, and headomega are played simultaneously. This movie has been modified from Gong et al.12. Please click here to view this video. (Right-click to download.)
This protocol presents the light spot assay to test the ability of Drosophila larvae to escape from light. This assay allows tracking of the behavior of larvae before entering, during encountering, and after leaving a light spot. Details of larval movement can be captured and analyzed. The light spot assay is very simple and possesses strong practicability. The cost of the whole device is not high. In the experiment, LED light is used as the light source. It can be replaced with light sources of different wavelengths, if required. The light intensity can also be adjusted by the LED drive. The lowest light intensity in the spot can reach 1.80 pW/mm2 (cold white light). Even at such a low light intensity, larvae still can sense the light and show light-avoiding behaviors11.
It should be noted that the concentration of the agar plate is controlled between 0.8% and 1.0%. If the concentration is too high, scattering of light on the agar plate can be serious, and the size of light spot recognized in the video is exaggerated. Therefore, the brightness of the spot should not be too high. Since larvae in a light spot are hardly visible, if visible light is used for illumination, it is necessary to use infrared light to illuminate the larva and add an 850 nm band-pass filter on the camera to prevent the light spot signals from entering the camera. The video of larval response to light spots can be synthesized later based on the larva-only and light-spot-only videos.
The light spot assay possesses three main virtues: 1) the process of larval light avoidance can be monitored and analyzed in detail; 2) larval light response is tested only once, so that the possible involvement of light adaptation can be excluded; and 3) possible effects on light response from other larvae can be excluded. One obvious disadvantage of this assay is that it is low throughput, since only one larva is tested at a time. Although this assay is used here mainly at low intensities of light11,12, it can also apply to larval avoidance in strong light that can excite class IV DA neurons that tile the surface of body walls16.
Our experimental device can also be used for optogenetics. The 850 nm band-pass filter can block the excitation light, as it does for the light spot signal, so that the camera can record larval behaviors before, during, and after red light stimulation clearly. Specifically, when 620 nm red light is used in combination with Chrimson for optogenetic stimulation, the low halves of infrared light LEDs need to be masked, and the direction of red light should be well-controlled to image the larvae clearly. Meanwhile, moderate levels of noisy signals originating from red light in the image can be used to judge the timing of on/off stimulation. In short, the light spot assay provides an addition method to monitor and analyze detailed spatial and temporal properties of the rapid larval light avoidance behavior.
The authors have nothing to disclose.
This work is supported by natural science foundation of China (31671074) and Fundamental Research Funds for the Zhejiang Provincial Universities (2019XZZX003-12).
850 nm ± 3 nm infrared-light-generating LED | Thorlabs, USA | PM100A | Compatible Sensors: Photodiode and Thermal Optical Power Rangea: 100 pW to 200 W Available Sensor Wavelength Rangea: 185 nm-25 μm Display Refresh Rate: 20 Hz Bandwidtha: DC-100 kHz Photodiode Sensor Rangeb: 50 nA-5 mA Thermopile Sensor Rangeb: 1 mV-1 V |
AC to DC converter | Thorlabs, USA | S120VC | Aperture Size: Ø9.5 mm Wavelength Range: 200-1100 nm Power Range: 50 nW-50 mW Detector Type: Si Photodiode (UV Extended) Linearity: ±0.5% Measurement Uncertaintyc: ±3% (440-980 nm), ±5% (280-439 nm), ±7% (200-279 nm, 981-1100 nm) |
band-pass filter | Thorlabs, USA | DC2100 | LED Current Range: 0-2 A LED Current Resolution: 1 mA LED Current Accuracy: ±20 mA LED Forward Voltage: 24 V Modulation Frequency Range: 0-100 kHz Sine Wave Modulation: Arbitrary |
Collimated LED blue light | ELP, China | USBFHD01M | Max. Resolution: 1920X1080 F6.0 mm Sensor: 1/2.7" CMOS OV2710 |
Compact power meter console | Ocean Optics, USA | USB2000+(RAD) | Dimensions: 89.1 mm x 63.3 mm x 34.4 mm Weight: 190 g Detector: Sony ILX511B (2048-element linear silicon CCD array) Wavelength range: 200-850 nm Integration time: 1 ms – 65 seconds (20 seconds typical) Dynamic range: 8.5 x 10^7 (system); 1300:1 for a single acquisition Signal-to-noise ratio: 250:1 (full signal) Dark noise: 50 RMS counts Grating: 2 (250 – 800 nm) Slit: SLIT-50 Detector collection lens: L2 Order-sorting: OFLV-200-850 Optical resolution: ~2.0 nm FWHM Stray light: <0.05% at 600 nm; <0.10% at 435 nm Fiber optic connector: SMA 905 to 0.22 numerical aperture single-strand fiber |
High-Power LED Driver | Minhongshi, China | MHS-48XY | Working voltage: DC12V Central wavelength: 850nm |
high-resolution web camera | Thorlabs, USA | MWWHL4 | Color: Warm White Correlated Color Temperature: 3000 K Test Current for Typical LED Power: 1000 mA Maximum Current (CW): 1000 mA Bandwidth (FWHM): N/A Electrical Power: 3000 mW Viewing Angle (Full Angle): 120˚ Emitter Size: 1 mm x 1 mm Typical Lifetime: >50 000 h Operating Temperature (Non-Condensing): 0 to 40 °C Storage Temperature: -40 to 70 °C Risk Groupa: RG1 – Low Risk Group |
LED Warm White | Mega-9, China | BP850/22K | Ø25.4(+0~-0.1) mm Bandwidth: 22±3nm Peak transmittance:80% Central wavelength: 850nm±3nm |
Spectrometer | Noel Danjou | Amcap9.22 | AMCap is a still and video capture application with advanced preview and recording features. It is a Desktop application designed for computers running Windows 7 SP1 or later. Most Video-for-Windowsand DirectShow-compatible devices are supported whether they are cheap webcams or advanced video capture cards. |
Standard photodiode power sensor | Super Dragon, China | YGY-122000 | Input: AC 100-240V~50/60Hz 0.8A Output: DC 12V 2A |
Thermal power sensor | Thorlabs, USA | M470L3-C1 | Color: Blue Nominal Wavelengtha: 470 nm Bandwidth (FWHM): 25 nm Maximum Current (CW): 1000 mA Forward Voltage: 3.2 V Electrical Power (Max): 3200 mW Emitter Size: 1 mm x 1 mm Typical Lifetime: 100 000 h Operating Temperature (Non-Condensing): 0 to 40 °C Storage Temperature: -40 to 70 °C Risk Groupb: RG2 – Moderate Risk Group |
Thermal power sensor | Thorlabs, USA | S401C | Wavelength range: 190 nm-20 μm Optical power range:10 μW-1 W(3 Wb) Input aperture size: Ø10 mm Active detector area: 10 mm x 10 mm Max optical power density: 500 W/cm2 (Avg.) Linearity: ±0.5% |