Tree surveys are important to evaluate biodiversity in forests and elucidate the structure and health of woodland areas. The point-centered quarter sampling method is a common technique used to quantify woodland composition.
Woodlands are an important natural resource, and help maintain the environment, while having an impact on the health and quality of life of human populations. A good understanding of the composition of forests is essential to maintaining this resource. If a forest is very diverse, it can minimize the impact from species-specific pests or disease. If invasive trees dominate the understory, this may indicate future displacement of native trees.
Point-centered quarter sampling is one commonly used method in forest communities. It is used to gather information on the density, frequency, and coverage of tree species found in a forest. Data collected via this method provide the ability to estimate how often a tree species occurs, how common species are relative to others, and the sizes of trees, which can give an estimation of age of the tree, and the space they occupy in the ecosystem.
The point-centered method has advantages over other tree survey types. It is more efficient than standard plot analysis because it requires only a small sampling across the woodland, as opposed to surveying all present trees. Though less labor intensive, it has been shown to provide comparable results.
This video will illustrate how to carry out a point-centered quarter sample, how to calculate related tree data, and how to analyze the findings of a point-centered quarter tree survey.
The point-centered quarter tree survey method produces three major quantitative measures for a specific tree species: Relative Density, Relative Frequency, and Relative Basal Area. These three values are then added together to give an “Importance Value” of that species, which can be converted into a “Relative Importance Value.” This value gives a numerical quantification of the prevalence and abundance of a tree species within the forest.
Point-centered quarter method uses a tree measurement called Diameter at Breast Height, or DBH. This is measured at 4.5 ft above existing grade. After a survey location has been selected a transect is established, a point in the forest along that transect is chosen, and the area around it separated into four quarters. In each quarter, the nearest tree with a DBH of greater than 40 cm is identified. This collection is considered the large tree sample.
Next, in each quarter, the nearest tree with a DBH of greater than 2.5 cm, but below 40 cm is identified. These are labeled the small tree sample. Identifying a large tree and small tree in each quadrant allows comparison of the high, canopy forming overstory vegetation to the lower level understory growth.
Using these simple measurements, Basal Area and Importance Value of each tree species can be calculated. The Basal Area is the cross-sectional area of a single tree at DBH. Calculating the total basal area of all trees of a species is a more accurate way to understand species density, and is used instead of number of trees per site to take into account the size of the trees.
The Importance Value of each species is calculated to estimate the relative dominance of a particular species in a forest community. It takes into account how commonly a species occurs across the forest, total number of individuals of the species, and the total amount of forest area that the species occupies.
Now that we are familiar with the importance of tree surveys and the principles of point-centered quarter surveys, let’s take a look at how these are carried out in the field.
Once a woodland site has been identified, establish a 150 m transect in the forest. This can begin anywhere in the woodland, but should preferably be away from the forest edge to minimize border effects from external sources, such as roads.
Place a stake every 50 m along the transect. Each stake represents the center of four compass directions that divide the sampling site into four quarters. These can be numbered by location from one end if desired.
In each quarter, the distance is measured from the stake to the nearest tree, of any species, larger than 40 cm in diameter. Only one large tree per quarter should be measured, so a total of 16 trees are recorded in the large tree category. Record the distance to the stake in centimeters for each.
At each measured tree, note if the leaves are arranged in an alternate, whorled, or opposite arrangement. Next, collect a leaf sample for each of the measured trees.
Place the leaf samples on herbarium paper and label according to collection site, then place in a plant press for later identification.
For each sample tree, using field measurement tape, record the DBH. If using specific DBH tape, read the diameter directly. With regular measuring tape, measure the tree circumference, then calculate the diameter using the formula.
Next, repeat these measurements for each quadrant, at each segment of the transect for the nearest tree less than 40 cm and greater than 2.5 cm in diameter. Record these in a separate category, labeled as small trees.
Back at the laboratory, calculate the mean point-to-tree distance, density, and basal area for each species. This information can then be used to generate the Importance Value. First, using a tree identification guide or ID key, identify each of the trees measured in both the large and small tree categories.
Calculate the mean point-to-tree distance for the entire sample of large and small trees. This is the mean value for the distance of the tree group to the transect point.
Next, calculate the average density, or number of trees per hectare for both the large tree and small tree groups using the equation shown. Record the number of individuals of each tree species per group, then determine density by species for both the large tree and small tree group.
Convert the diameter measurements into areas for all trees sampled. Calculate the mean basal area for each species by calculating the average. The basal area of a species is the average basal area of that species times its density. Next, for each species, calculate the Relative Basal Area.
Determine the frequency at which each species occurs in each group. This is determined by comparing the number of points at which that species occurred out of the 4 points sampled. For example, if an American elm is found at all four points of a quadrant, frequency would equal 1. If a Silver Maple is found at 2 of 4 points, frequency would be equal to 0.5 Now, determine the relative frequency of each species, for each group.
The Importance Value of a species can now be calculated. Add the relative density to relative frequency plus relative basal area. Finally, determine the Relative Importance Value for each species.
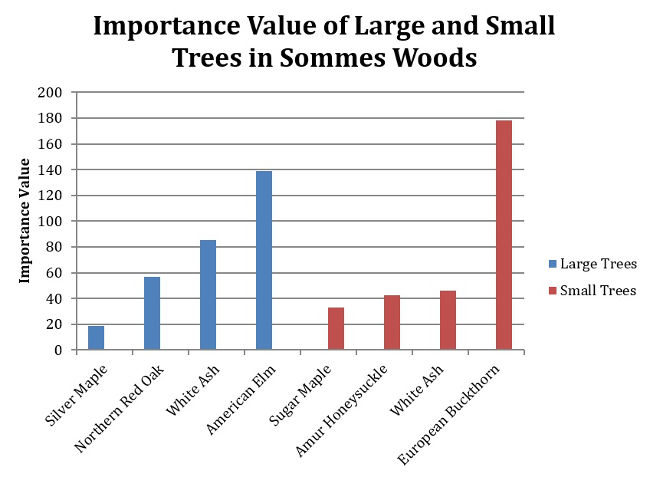
To summarize, input these data into a graph that depicts the Importance Value for each species on the Y-axis, arranged in order of increasing importance, and the species name on the X-axis. The data should be presented as one bar for large trees and one bar for small trees.
The importance value of a species can reach a maximum of 300 in a survey where only one tree species is observed. High Importance Value does not necessarily mean a species is important to the health of the forest. Instead, it is merely an indication that the species is currently dominant in the forest structure.
Tree surveys are used to inform scientists or land managers on a variety of important topics. The point-centered quarter method may be applied in a variety of information gathering scenarios.
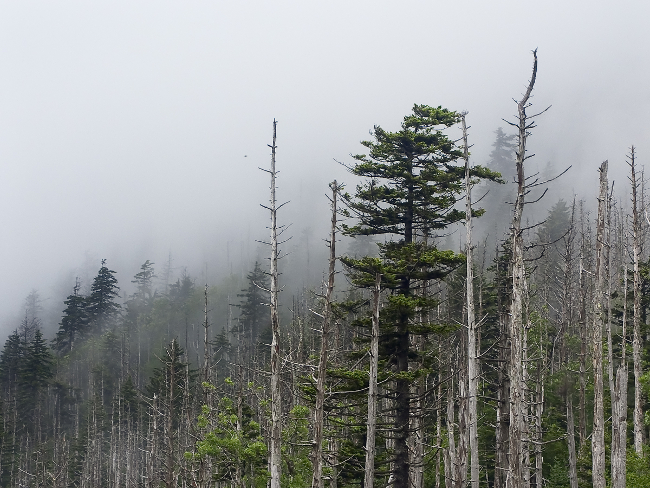
A community may benefit from a tree inventory to determine a need for a forestry program if there is a high frequency of dead or diseased trees in local woodland. Such trees can prove a health risk from falling branches, or an infection risk to others. Finding many dead or diseased trees in a forest would raise concerns for environmental scientists, and may be early indicators of poor environmental conditions including acid rain or ozone pollution.
Knowing species diversity in a forest can help land managers develop planting strategies. They may be informed to set guidelines to limit or eliminate planting of common trees while adding in new or uncommon beneficial species to maintain diversity. Data from a tree survey may also allow managers to calculate the worth of the services specific tree species provide, such as air pollution control or carbon capture and storage, and tailor planting strategies based upon these data.
You’ve just watched JoVE’s introduction to Tree Surveying using the point-centered quarter method. You should now understand the importance of tree surveys, how to carry out a point-centered quarter survey, and how to calculate forest structure based on your survey measurements. Thanks for watching!