Aprendizagem Estatística Visual
English
Share
Overview
Fonte: Laboratório de Jonathan Flombaum – Universidade Johns Hopkins
O ambiente visual contém enormes quantidades de informações envolvendo as relações entre objetos no espaço e no tempo; certos objetos são mais propensos a aparecer nas proximidades de outros objetos. Aprender essas regularidades pode suportar uma ampla gama de processamento visual, incluindo o reconhecimento de objetos. Sem surpresa, então, os humanos parecem aprender essas regularidades automaticamente, rapidamente e sem consciência. O nome para este tipo de aprendizado implícito é aprendizado estatístico visual. No laboratório, é estudado com um paradigma de codificação incidental: os participantes observam um fluxo de objetos absurdos e completam uma tarefa de cobertura, tarefa não relacionada à estrutura estatística subjacente no córrego. Mas a estrutura estatística está presente e, após um curto período de exposição — tão curto quanto 10 minutos em alguns experimentos — um teste de familiaridade revela a extensão do aprendizado pelos participantes.
Este vídeo demonstrará métodos padrão para induzir e testar o aprendizado estatístico visual.
Procedure
Results
Because each familiarity test includes one triplet and one foil (a randomly generated non-triplet), chance performance overall is 50%. Score each trial in terms of whether the participant chose the triplet or the foil as more familiar, and selecting triplets more than half of the time constitutes a demonstration of statistical learning. After testing 10-20 participants, average together the rate of choosing the familiar triplet among all the participants. A simple bar graph is a good way to visualize the main effect (Figure 3).
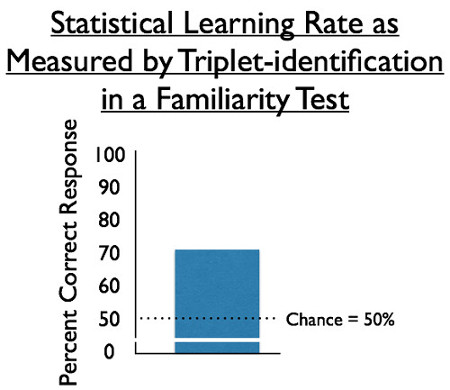
Figure 3. Statistical learning rate as measured by triplet identification in a familiarity test. 50% is chance performance, equal familiarity with both triplets and foils.
Applications and Summary
Visual statistical learning has been utilized as a starting point for investigating a variety of issues in learning, perception, and memory. These include the influence and necessity of attention for learning, the brain areas involved in implicit visual memory and object recognition, as well as differences and similarities in learning about spatial vs. temporal structure. Visual statistical learning is also thought to be an example of a broader class of statistical learning mechanisms, including auditory statistical, which is thought to support early language learning in infants and children because the sounds and letters in a language tend to appear with highly reliable statistical relationships.
Transcript
Learning regularities-the statistical structures of objects in our external world-is an important part of visual processing.
Objects in our visual environment occur in the dimensions of space and time. Certain objects are more likely to appear near others, like a coffee cup next to a computer.
Such occurrences provide regularities that support predictable object recognition, in which humans learn automatically and quickly, without conscious awareness.
This video demonstrates how to setup and conduct a visual statistical learning experiment using an incidental encoding paradigm, as well as how to analyze the data and interpret the results.
In this experiment, the stimuli-sets of nonsense objects grouped into triplets-are displayed on the center of a computer screen, one at a time, for 250 ms each.
To establish regularities-the statistical structure-the objects within a triplet are always shown in the same sequence, but the order of triplets is presented at random.
Thus, the transitional probability between elements of a given triplet is always 1, whereas the transitional probabilities between unrelated elements are considerably lower.
In order to unknowingly expose participants to the object sequences, a cover task is used with colored objects. In this case, participants are asked to make a response when the objects are gray and to withhold when the objects randomly appear red.
After the cover task is completed, participants are given a familiarity task to test the extent of encoding the previous nonsense objects. During each familiarity trial, previously viewed triplets are randomly presented along with newly generated triplets, referred to as foils.
Now, participants are asked to identify which set is more familiar. The dependent variable then is the number of times participants correctly identify the prior triplets as most familiar, rather than the foils.
If no learning occurs during the initial encoding phase, the actual and foil triplets would be picked the same number of times. On the other hand, if learning occurred, the actual triplets will be picked more frequently than the foils.
Before the participant arrives, verify that the stimuli and coding parameters to be used have been generated.
To begin the experiment, greet the participant in the lab and explain the general procedures that will be used for the task.
Have the participant sit comfortably in front of the computer monitor and keyboard. Explain that when a gray object appears on the screen they should press the ‘J’ key, and when red objects appear they should withhold responses.
Once the participant understands the task rules, start the first portion of the experiment, the incidental encoding phase. Expose the participants to the object sequences for 10 min.
After the short exposure period, explain that there is one more task to complete in a 5 min period. Instruct the participant that they will now see two sets of triplets and should press the 1-key or the 2-key to indicate which grouping looks more familiar. Tell them that they should guess if they don’t recognize either.
After confirming that the participant is ready to begin, start the 30 familiarity trials.
To analyze the data in the familiarity phase, score each trial where the participant chose the familiar triplet as correct and the foil triplet as incorrect.
To visualize the results, graph the mean of the percent correct responses across participants. Because chance performance is 50%, note that visual statistical learning occurred, as participants correctly identified the familiar objects around 70% of the time.
Now that you are familiar with the methods of inducing and testing visual statistical learning, let’s take a look at other ways experimental psychologists use statistics to investigate learning.
The paradigm can be translated into broader classes of sensory learning mechanisms that include the auditory domain. For example, infants and children use auditory statistics in early language formation because the sounds and letters in a language tend to appear with highly reliable statistical relationships.
In another experiment, researchers investigated how the associations between letters and colors can be unknowingly or implicitly learned. Over several days, participants read texts that were customized to have four distinctly colored letters.
When asked to identify the color of letters presented on a screen, participants were faster and more accurate for letter-color pairs that were the same as in the customized text. This suggests that the statistical structure of the colored letters was implicitly learned.
You’ve just watched JoVE’s introduction to visual statistical learning. Now you should have a good understanding of how to setup and perform the experiment, as well as analyze and assess the results.
Thanks for watching!