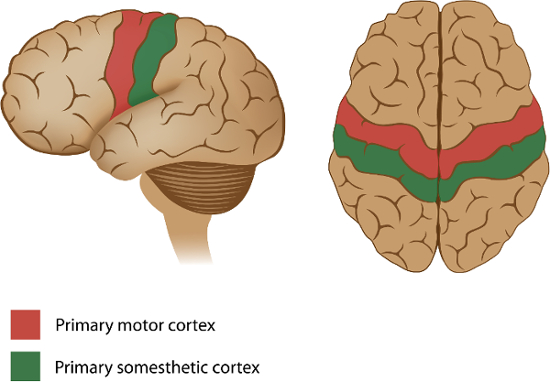
Motor information is organized according to anatomical divisions in the primary motor cortex, creating a topographical map in the brain.
Located in the precentral gyrus, cortical representations of the body are organized into a motor homunculus—”little man”—and are arranged in an inverted manner, such that the areas that control the toes are found in the medial wall and the tongue is located near the lateral sulcus.
Furthermore, body parts that require finer voluntary motor control, such as the hands and their associated digits, have larger representations in the cortex, compared to anatomical features that don’t require such precise manipulation—like the hip.
The homunculus is also lateralized, with neurons in the left primary motor cortex—shown here—controlling the right side of the body, and vice versa. Thus, when an individual moves their right hip, there is increased cortical activation on their left precentral gyrus within a discrete region.
This video details an experiment that uses modern functional neuroimaging to demonstrate the body-mapped organization of the human primary motor cortex, including how to collect and analyze brain activity when participants move their hands or feet.
In this experiment, brain activity is measured using functional magnetic resonance imaging, abbreviated as fMRI, while participants are repetitively cued to move different body parts—like the digits on their left or right hands.
This technique relies on changes in blood oxygenation levels, referred to as the BOLD—Blood-Oxygenation-Level-Dependent—response. For an in-depth look at the principles behind the method, please refer to another video in JOVE’s SciEd Essentials of Neuroscience Collection, fMRI: Functional Magnetic Resonance Imaging.
In the context presented here, when a body part, such as the left foot, is flexing back and forth, oxygenated cerebral blood flow—supplied by arteries in the brain—increases to neural regions that are active during this movement, like the primary motor cortex.
However, this hemodynamic response occurs more slowly than the actual physical motion, which warrants that actions be separated with periods of rest.
Thus, each body movement is precisely timed to distinguish the four conditions from one another: left hand, left foot, right hand, and right foot.
For example, participants in a fMRI machine are asked to start gesturing their left hand when one appears on the left side of a presentation screen.
The required hand movement is actually complex, and involves touching the thumb to each finger, in order, starting with the pointer. Then, the participant must repeat these actions in the opposite direction, starting with the pinky.
Movement is stopped when the cue—in this instance, the picture of the left hand—disappears from the screen.
Likewise, when they see a foot on the right, they are instructed to move their right foot by pushing it down repeatedly, until the image disappears.
Here, the dependent variable is the intensity of the BOLD response after a movement from the hand or foot, which can then be localized to specific brain regions.
For a left hand movement, brain activation is primarily expected on the right dorsolateral surface of the precentral gyrus. In contrast, for a right hand movement, brain activation is anticipated on the left dorsolateral surface. These results would align with the lateralized motor homunculus.
Prior to the experiment, recruit participants who are right-handed, have normal or corrected-to-normal vision, do not have any metallic implants in their body, or suffer from claustrophobia on account of experimental control and safety concerns.
Have them fill out pre-scan paperwork, which includes questions related to health and safety issues during the session, such as consent for a radiologist to look at their images in the case of incidental findings, as well as detailing the risks and benefits of the study.
Ask the participant to also remove all metal objects from their body—including watches, phones, wallets, keys, belts, and coins—to prepare for entering into the scanning room.
Next, explain the task rules: the appendage they need to move—in this case their foot—will appear as a visual cue on the corresponding side of the screen. Demonstrate how they should move their foot by repeatedly pressing it down, as if pushing on an imaginary pedal.
When a hand cue appears, they must touch the thumb to each finger of the same hand in order and then repeat this sequence in reverse.
Now, bring the participant into the imaging room. Provide earplugs to protect their ears from loud noises and earphones so that they can hear any additional communication during the session. Have them lie down on the bed with their head in the coil and secure it with foam pads to avoid excess movement and blur during the scan.
Above the participants’ eyes, place a mirror that reflects a screen at the back of the scanner bore. Then, give them a squeeze ball to use in case of emergency. Also remind them that it is very important to stay as still as possible the entire time.
After guiding the participant inside the machine, first collect high-resolution, anatomical images. To begin the functional portion, synchronize the stimulus presentation with the start of the scanner.
Present the visual cues via a laptop connected to a projector, each for 12 s, followed by 12 s of resting baseline. Alternate between the four conditions: left hand, right hand, left foot, and right foot—repeating each four times within 6.5 min.
Once the scan is completed, direct the participant out of the room. Debrief them and provide compensation for their participation in the study.
As the first step of the analysis, preprocess the data by performing motion correction to reduce artifacts, temporal filtering to remove signal drifts, and spatial smoothing to increase the signal-to-noise ratio.
Using these data, create a model of the expected hemodynamic response for each task condition. Then, fit the data to this model, resulting in a statistical map for each subject, where the value at each voxel—a 3D pixel of volume—represents the extent to which that voxel was involved in the task condition.
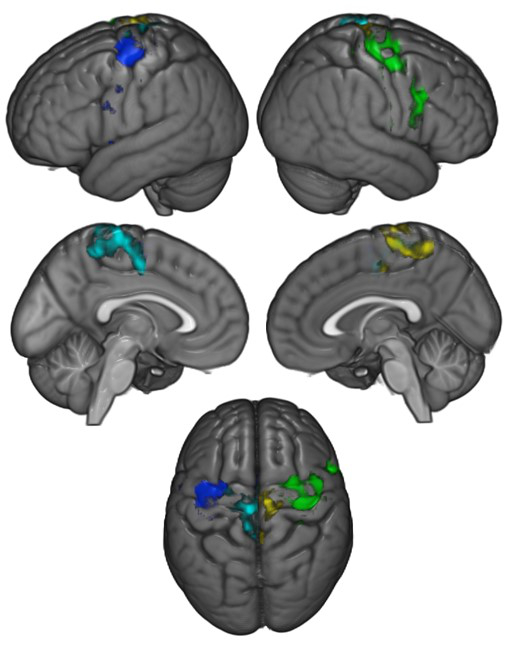
Register the participant’s brain to a standard atlas in order to combine data across each participant. Then, combine all statistical maps across participants for a group level analysis. Note that changes in blood flow are represented by different colors on the surface of the brain.
Movements of the right hand, shown in blue, produced the greatest activation on the left lateral surface of the precentral gyrus, whereas engaging the left hand, represented in green, produced the greatest activation on the right lateral surface.
Additionally, flexing the right foot, indicated by light blue, produced activation on the left medial surface, while the greatest activation for left foot movements, in yellow, were on the right medial surface.
These results suggest that motor actions can be localized to discrete regions of the primary motor cortex in both hemispheres, supporting the motor homunculus.
Now that you are familiar with executing an fMRI experiment to observe the organization of the primary motor cortex, let’s consider how the brain manages movement after damage, or after the attachment of prosthetic limbs.
Damage to the left precentral gyrus, such as from a stroke, can lead to difficulty in moving the right side of the body.
As you’ve learned in this video, the specific parts that are impacted depend upon the extent of injury: impairments could be small and affect a single finger, or large enough to influence all of the digits and the entire arm.
While the representations seem straightforward, the primary motor cortex does not work alone, as it’s just a segment within a wider network of regions that are involved in the selection, planning, and coordination of movement. Thus, localizing damage may not be as easy as it seems.
One potential therapeutic approach for improving limb function in amputees involves brain-computer interfaces. This technically advanced method is based on electromyographic, or EMG signals—the electrical communication between motor neurons and muscle movements.
Researchers are developing ways to integrate EMG recordings with limb prostheses to more seamlessly control motor behaviors, like standing, or even walking up a ramp.
You’ve just watched JoVE’s introduction to motor maps. Now you should have a good understanding of how to design and conduct the fMRI experiment, and finally how to analyze and interpret the brain activation results.
Thanks for watching!