화소 기반 형태법으로 회백질 차이 측정: 음악 두뇌
English
Share
Overview
출처: 조나스 T. 카플란과 사라 I. 짐벨의 연구소 – 서던 캘리포니아 대학
경험은 뇌를 형성합니다. 우리의 뇌는 학습의 결과로 다르다는 것을 잘 이해합니다. 많은 경험 관련 변경은 개별 적인 뉴런의 행동에 있는 신경 화학적인 조정에 의해 예를 들면, 현미경 수준에서 자신을 드러내는 동안, 우리는 또한 거시적인 수준에서 두뇌의 구조에 해부학적인 변경을 검토할 수 있습니다. 이러한 변화의 한 가지 유명한 예는 도시의 복잡한 경로를 배우는 것과 함께 항해 메모리에 역할을하는 것으로 알려진 뇌 구조인 해마에서 더 큰 양을 보여주는 런던 택시 운전사의 경우에서 비롯됩니다. 1
뇌 해부학을 검사하는 많은 전통적인 방법은 크기를 측정하기 위해 관심있는 해부학 적 영역의 근면 한 추적을 필요로한다. 그러나, 현대 신경 이미징 기술을 사용 하 여, 우리는 지금 자동화 된 알고리즘을 사용 하 여 사람들의 그룹에 걸쳐 뇌의 해부학을 비교할 수 있습니다. 이러한 기술은 인간의 신경 해부학자가 작업에 가져올 수있는 정교한 지식의 자신을 이용하지 않지만, 그들은 빠르고 해부학의 매우 작은 차이에 민감합니다. 뇌의 구조적 자기 공명 이미지에서 각 체적 픽셀 또는 복셀의 강도는 해당 영역에서 회색 물질의 밀도와 관련이 있습니다. 예를 들어, T1 가중 MRI 스캔에서 매우 밝은 복셀은 백색 물질 섬유 번들이있는 위치에서 발견되며 어두운 복셀은 뉴런의 세포 체가 있는 회색 물질에 해당합니다. 복셀에 의해 복셀 기초에 뇌 구조를 정량화하고 비교하는 기술은 복셀 기반 의 morphometry, 또는 VBM이라고합니다. 2 VBM에서는 먼저 모든 뇌를 공통 공간에 등록하여 해부학의 총 차이를 부드럽게 합니다. 그런 다음 복셀의 강도 값을 비교하여 회색 물질 밀도의 지역화된 작은 규모 차이를 식별합니다.
이 실험에서는 뮤지션의 뇌와 비음악가의 두뇌를 비교하여 VBM 기술을 시연할 것입니다. 뮤지션들은 강렬한 모터, 비주얼 및 어쿠스틱 교육에 참여합니다. 음악 훈련을 통해 간 사람들의 뇌는 기능적이고 하지 않은 사람들과 다른 여러 소스에서 증거가있다. 여기, 우리는 가서와 Shlaug3 및 버뮤데즈 외를따릅니다. 4 VBM을 사용하여 음악가의 뇌에서 이러한 구조적 차이를 식별합니다.
Procedure
Results
The VBM analysis revealed significant localized increases in gray matter density in musicians' brains compared with non-musician controls. These differences were found in the superior temporal lobes on both sides. The largest, most significant cluster was on the right side and includes the posterior portion of Heschl's gyrus (Figure 2). Heschl's gyrus is the location of the primary auditory cortex, and the surrounding cortices are involved in complex auditory processing. Thus, these results are consistent with previous findings of morphological differences between musicians and non-musicians in auditory brain regions.
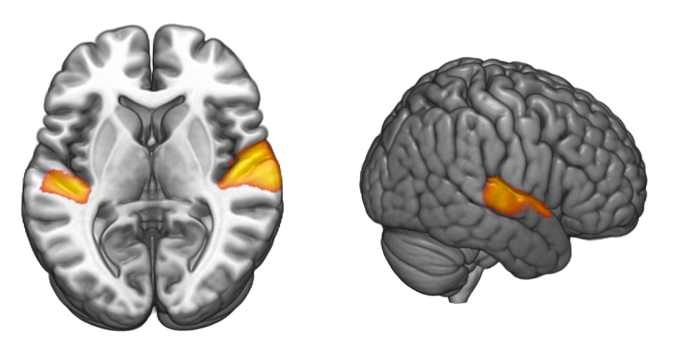
Figure 2: Gray matter differences between groups. Musicians showed significantly higher gray matter density in the superior temporal lobe on both sides, with the greatest differences on the right side. This region includes part of Heschl's gyrus, the primary auditory cortex.
Applications and Summary
The VBM technique has the potential to demonstrate localized differences in gray matter between groups of people, or in association with a measurement that varies across a group of people. In addition to finding structural differences that relate to different forms of training, this technique may reveal anatomical differences that are associated with wide ranging neuropsychological conditions such as depression,5 dyslexia,6 or schizophrenia.7
It is important to note that there are multiple explanations for the existence of between-group differences in brain anatomy. For example, in the case of musicians, there could be a self-selection bias. We may find such differences if people with a certain brain anatomy are more likely to become musicians. In order to establish that structural differences between groups of people are the result of experience, the most definitive way is to employ a longitudinal study that follows people over time.
References
- Maguire, E.A., et al. Navigation-related structural change in the hippocampi of taxi drivers. Proc Natl Acad Sci U S A 97, 4398-4403 (2000).
- Ashburner, J. & Friston, K.J. Voxel-based morphometry–the methods. Neuroimage 11, 805-821 (2000).
- Gaser, C. & Schlaug, G. Brain structures differ between musicians and non-musicians. J Neurosci 23, 9240-9245 (2003).
- Bermudez, P., Lerch, J.P., Evans, A.C. & Zatorre, R.J. Neuroanatomical correlates of musicianship as revealed by cortical thickness and voxel-based morphometry. Cereb Cortex 19, 1583-1596 (2009).
- Bora, E., Fornito, A., Pantelis, C. & Yucel, M. Gray matter abnormalities in Major Depressive Disorder: a meta-analysis of voxel based morphometry studies. J Affect Disord 138, 9-18 (2012).
- Richlan, F., Kronbichler, M. & Wimmer, H. Structural abnormalities in the dyslexic brain: a meta-analysis of voxel-based morphometry studies. Hum Brain Mapp 34, 3055-3065 (2013).
- Zhang, T. & Davatzikos, C. Optimally-Discriminative Voxel-Based Morphometry significantly increases the ability to detect group differences in schizophrenia, mild cognitive impairment, and Alzheimer's disease. Neuroimage 79, 94-110 (2013).
Transcript
Our brains are shaped by experiences, resulting in changes in cortical volume.
For instance, certain proficiencies, like learning and mastering a second language, have been shown to increase the density of gray matter, where cell bodies reside, particularly in structures such as the frontal lobe.
Before modern advances, to measure a particular area’s size, scientists would have to painstakingly trace the region of interest—a very tedious task. Now, more sensitive neuroimaging techniques—known as voxel-based morphometry, VBM—exist to capture small volumetric differences in neuroanatomy.
Based on previous work of Gaser and Shlaug, as well as Bermudez and colleagues, this video demonstrates how to collect structural magnetic resonance images and use VBM to identify the intensity values of voxels in the brains of individuals with different experiences—expert musicians compared to those with very limited training—as well as in other cases of expertise, such as chess playing.
In this experiment, two groups of participants—formally trained musicians and controls with no such training—are asked to lie in an MRI scanner while structural images of their brains are collected.
Particular regions can then be defined using an automated approach, based on the intensity of volumetric pixels, called voxels. For instance, very bright clusters indicate the location of white-matter fiber bundles, while darker voxels correspond to areas with dense gray matter.
Following this segmentation for each brain, the images are transformed—registered to a standard atlas, which is a common space to allow for between-subject comparisons.
Often times, this registration process can stretch out an image, which makes some structures seem like they have more gray matter than they really do.
Therefore, the template must be multiplied by a measure of how much warping has been done, called a Jacobian determinant, to compensate for the repeated stretching, and then all gross differences in anatomy are smoothed out.
After the transformations are applied, the dependent variable is calculated as the differences in gray matter density between musicians’ brains compared to non-musician controls.
Due to the increased use of complex auditory processing in skillful musicians, it is expected that this group will show increased gray matter density in auditory brain regions, such as the superior temporal lobe and Heschl’s gyrus, compared to the control group.
Prior to the experiment, recruit 40 musicians who actively practice any instrument 1 hr a day and have at least 10 years of formal musical training, as well as 40 non-musician controls who have little to no proper training.
On the day of their scan, greet each participant in the laboratory and verify that they meet the safety requirements as they complete the necessary consent forms.
Please refer to another fMRI project in this collection for more details on how to prepare individuals to enter the scanning room and scanner bore.
Now, instruct the participant to lie still in the scanner, and begin scanning the whole brain by collecting a high-resolution, T1-weighted anatomical sequence such as Magnetization Prepared-Rapid Gradient Echo with 1 mm isotropic voxels.
Following the image-collection protocol, dismiss the participant and start the analysis.
To begin preprocessing, isolate the brain from the skull for each scan and check the quality of the stripping.
For this study, create a specific gray matter template by first segmenting each subject’s brain into white and gray matter and cerebral spinal fluid, CSF, based on the intensity of each voxel. Note, the software automatically distinguishes bright voxels as white matter, dark voxels as gray matter, and areas within the ventricles as CSF.
Perform a linear affine transformation with 12° of freedom, to register each subject’s brain to a standard atlas space. Warp each subject’s gray matter image into this space, and average them all together.
Next, mirror this left to right, and once again, average the images together to produce the initial gray matter template.
Then, perform a non-linear transformation to re-register each subject’s brain to the gray matter figure, and average these together. Create a mirrored copy of this new image, and once again average the two together to produce a final, study-specific, gray matter template.
Now register each subject’s brain to the last gray matter figure using a non-linear transformation, and multiply by a Jacobian measure of how much warping has been done to compensate for the amount each brain structure has been stretched to fit the template space.
Subsequently, smooth the data using a Gaussian kernel with a Full-Width Half Maximum of 10 mm to increase the overlap of similar brain voxels across all subjects.
With preprocessing completed, model each group of brains with a separate regressor. Compute a contrast that compares the two groups to generate statistical maps that quantify the likelihood of differences at each voxel.
Finally, perform a multiple comparisons correction technique, such as a False Discovery Rate with a q value of 0.01, to control for the thousands of simultaneous statistical tests performed. This value will estimate the rate of false positives above a threshold of 1%.
Here, the VBM analysis revealed significant bilateral increases in gray matter density in the superior temporal lobe of the musicians’ brains compared to the controls. The greatest difference was shown on the right side, and this included the posterior portion of Heschl’s gyrus, the location of the primary auditory cortex.
Now that you are familiar with how to use VBM to study neuroanatomy, let’s look how researchers use this technique to study structural differences in other populations.
While many tasks involving intense training and experience are associated with increases in gray matter volume, this enlargement is not always the case for all types of learned skill-sets, like in the brain of an experienced chess player.
When compared to controls, gray matter volume was reduced in the occipito-temporal junction, an area important for object recognition. Such findings result in an interesting anomaly that may help scientists further understand how cortical volume relates to performance in demanding tasks.
Individuals who are blind from birth often have smaller gray matter volume in their visual cortex compared to controls. Interestingly, through the use of VBM, researchers have discovered significant enlargement in areas of the brain not responsible for vision, such as the auditory cortex, which was twice the size found in sighted controls.
These structural differences may serve as an anatomical foundation to explain why other senses are heightened in blind individuals.
Furthermore, structural MRI and VBM analysis on medication-naïve patients with major depressive disorder also indicate differences in gray matter volumes compared to controls.
Scientists found that these patients had decreased gray matter volume in the frontal cortex and insula, which may explain why depressed patients have difficulty with cognitive control over negative feelings toward themselves and others.
You’ve just watched JoVE’s video on voxel-based morphometry. Now you should have a good understanding of how to collect anatomical images using MRI as well as how to analyze and interpret differences in gray matter intensity in regions of the auditory cortex. You should have also learned that not all areas of expertise lead to increases in cortical density.
Thanks for watching!