Resonancia Magnética Cardíaca
English
Share
Overview
Fuente: Frederick W. Damen y Craig J. Goergen, Weldon School of Biomedical Engineering, Purdue University, West Lafayette, Indiana
En este video, se demuestra que la resonancia magnética de campo alto y pequeño diámetro (RM) con monitoreo fisiológico adquiere bucles cine cerrados del sistema cardiovascular murino. Este procedimiento proporciona una base para evaluar la función ventricular izquierda, visualizar las redes vasculares y cuantificar el movimiento de los órganos debido a la respiración. Las modalidades de imágenes cardiovasculares de animales pequeños comparables incluyen ultrasonido de alta frecuencia y tomografía microcomputada (TC); sin embargo, cada modalidad está asociada con compensaciones que deben considerarse. Mientras que el ultrasonido proporciona una alta resolución espacial y temporal, los artefactos de imagen son comunes. Por ejemplo, el tejido denso (es decir, el esternón y las costillas) puede limitar la profundidad de penetración de imágenes, y la señal hiperecoica en la interfaz entre el gas y el líquido (es decir, la pleura que rodea los pulmones) puede desenfocar el contraste en el tejido cercano. Micro-CT en contraste no sufre de tantos artefactos en el plano, pero tiene menor resolución temporal y contraste limitado de tejido blando. Además, micro-CT utiliza radiación de rayos X y a menudo requiere el uso de agentes de contraste para visualizar la vasculatura, ambos de los cuales se sabe que causan efectos secundarios a dosis altas, incluyendo daño por radiación y lesión renal. La RMN cardiovascular proporciona un buen compromiso entre estas técnicas al negar la necesidad de radiación ionizante y proporcionar al usuario la capacidad de crear imágenes sin agentes de contraste (aunque los agentes de contraste se utilizan a menudo para la RMN).
Estos datos se adquirieron con una secuencia de resonancia magnética Fast Low Angle SHot (FLASH) que fue cerrada fuera de los picos R en el ciclo cardíaco y mesetas espiratorias en la respiración. Estos eventos fisiológicos fueron monitoreados a través de electrodos subcutáneos y una almohada sensible a la presión que estaba asegurada contra el abdomen. Para garantizar que el ratón se calentó correctamente, se insertó una sonda de temperatura rectal que se utilizó para controlar la salida de un ventilador de calefacción seguro para RMN. Una vez que el animal fue insertado en el orificio del escáner de RMN y se ejecutaron secuencias de navegación para confirmar el posicionamiento, se prescribieron los planos de imágenes FLASH cerrados y se adquirieron los datos. En general, la RMN de campo alto es una poderosa herramienta de investigación que puede proporcionar contraste de tejido blando para el estudio de modelos de enfermedades animales pequeñas.
Principles
Procedure
Results
Figure 1 shows a cine loop of a short-axis view of the left ventricle, which is directly perpendicular to the base-apex axis of the heart and at a position that includes the papillary muscles.
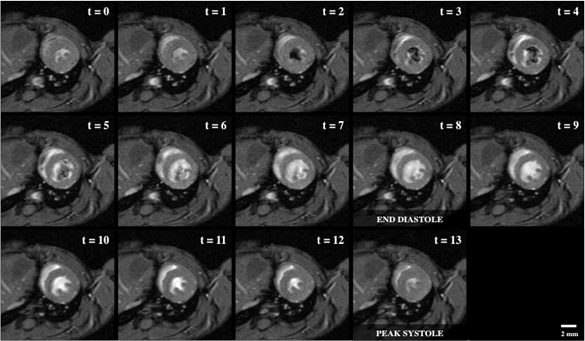
Figure 1: Bright blood cine imaging of a mouse heart with 14 short-axis view snapshots across the cardiac cycle, including end diastole (t = 8) and peak systole (t = 13). The regions of dropout signal within the lumen of the left ventricle indicates fast blood moving, which was originally out of plane and not tagged by the RF wave excitation.
The second representative image shows a 4-chamber view of the heart with bright-blood inflow through the mitral and tricuspid valves, which then flows out through the aortic and pulmonary valves, respectively.
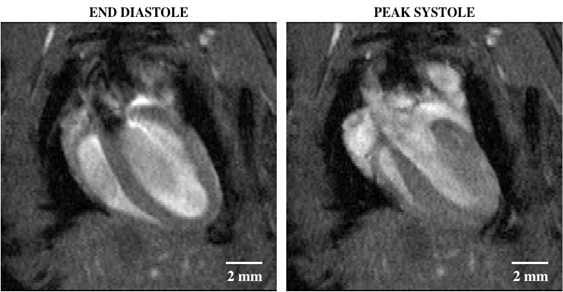
Figure 2: Bright blood cine imaging of a mouse heart with a four-chamber view showing end diastole (left) and peak systole (right). The regions of dropout signal within the lumen of the left ventricle indicates fast blood moving, which was originally out of plane and not tagged by the RF wave excitation.
Finally, a third representative result is a maximum intensity projection (MIP) that shows how the multiple slices can be spatially combined to visualize the cardiovascular system of the whole mouse body.
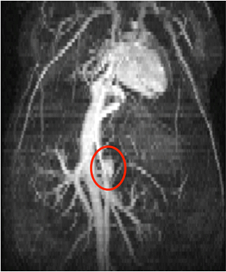
Figure 3: Maximum intensity projection of a three-dimensional stack of time-synced two-dimensional bright blood images, showing the thoracic and abdominal regions of a mouse. The heart, inferior vena cava, and small abdominal aortic aneurysm (red circle) can be seen from this view.
Applications and Summary
Here, cardiac MRI is used in conjunction with cardiac- and respiration-gating to acquire cine loop data of the murine heart. While the heart was the focus of demonstration, additional regions of the cardiovascular system can be imaged following the same methodology. Even though MRI does not suffer from the same artifacts commonly seen with other imaging modalities, there is a noticeable trade-off with spatial resolution achieved per acquisition duration. This trade-off is of concern when the mouse cannot withstand longer durations of anesthesia, such as in severe disease models. Still, MRI has the advantage of visualizing the underlying tissue without the risk of ionizing radiation damage inherent to micro-CT. Using MRI techniques, an in vivo assessment of the cardiovascular can be performed, laying the foundation for longitudinal studies of both disease progression and associated therapy response in small animal models.
As an extension of the described technique, this technology can be used to compare the kinematics of healthy versus diseased hearts. Murine models of cardiac dysfunction can be far more controlled than those found in the clinic, allowing researchers to identify specific factors contributing to heart disease as well as study the remodeling process after mechanical injury. Furthermore, a comparable research endeavor can be performed with a vascular focus such as that with abdominal aortic aneurysm (AAA) formation. Given that blood gives a high intensity signal under the described methods, the contrast can be exploited to assess the expansion of a AAA and measure changes to the vessel's biomechanical properties. Finally, studies looking at vascularization of the brain can be conducted to compare angiogenic responses to traumatic brain injury or stroke. Ideally, as with most pre-clinical imaging, techniques such as high field cardiovascular MRI can further our understanding of human disease processes as well as spark innovation towards the next generation of diagnostic technology.
Transcript
High-field small-bore magnetic resonance imaging, or cardiac MRI, assesses cardiovascular function without the use of ionizing radiation or contrast agents.
Comparable cardiovascular imaging modalities include high frequency ultrasound, which emits a beam of acoustic waves from a transducer and records the echoes created as the waves reflect to generate live images. It provides high spatial and temporal resolution images; however, imaging artifacts can be observed due to the limited penetration depth in dense tissue.
Another imaging technique is micro-CT, which takes a series of X-ray projections to create 3D cross sections. It has a lower temporal resolution and limited soft tissue contrast, and often requires the use of contrast agents to visualize vascular structures. These are known to cause radiation damage and renal failure at high doses.
Alternatively, MRI uses strong electromagnets to image tissues in the body based on their magnetic properties. In cardiac MRI, conventional MRI sequences are gated off of R peaks in the cardiac cycle and expiratory plateaus in respiration to assess cardiovascular function.
This video will illustrate how to gather MRI data with a triggering fast low angle shot, or FLASH MRI sequence. This technique provides high quality soft tissue contrast for the study of small animal disease models.
Magnetic resonance imaging is a technique that uses the paramagnetic properties of tissue to visualize soft tissue contrast. The bore of an MRI machine is conventionally wrapped using a solenoid coil that provides a constant homogeneous magnetic field, B-zero, when an electric current is applied.
In high-field mirroring imaging, a 7-Tesla magnetic field strength can be employed, approximately 140,000 times that of Earth’s magnetic field, and more than double the common clinical 3-Tesla and 1.5-Tesla scanner field strengths. This homogeneous magnetic field causes the hydrogen protons inherent to almost all living tissues to align their axes of rotation. These spins can then be tipped using radiofrequency, or RF waves, to a certain angle relative to the axis of rotation, also known as the flip angle.
As the protons then attempt to relax back to their original orientation, the component of their spin perpendicular to their main axis induces a detectable electrical signal, resulting in an image. Furthermore, magnetic gradients can be applied that perturb the main magnetic field and allow for spatially isolated RF excitations to localize the received signal. Specific to the methods described in this video is the FLASH sequence, which uses low flip angle RF excitations that are rapidly repeated to induce a steady state pattern in the proton motion. The repetition time is much shorter than the typical proton relaxation time.
When unexcited hydrogen, such as that in blood, enters the imaging frame, a relatively high signal is produced. This allows the cardiovascular system to be imaged rapidly and provide stable snapshots within the cardiac cycle. Through triggering the FLASH sequence with physiologic signals, images of the cardiovascular system can be acquired that highlight cardiac, vascular, and respiratory motion.
Having reviewed the main principles of cardiac MRI, let us now walk through the step-by-step procedure to prepare and image an animal.
First, identify the mouse to be imaged, then transfer the mouse to the knockdown chamber. Then, anesthetize the animal using isoflurane and confirm knockdown using a toe-pinch technique. Next, open the isoflurane flow to the nose cone in the MRI room and close the isoflurane flow to the knockdown chamber. This primes the longer tubing with anesthetic.
Ensure that all personnel are MR safe, then transfer the mouse to the imaging stage and secure the nose cone around the animal. Position the mouse such that its heart is approximately aligned with a center of the RF coil. Next, reconfirm knockdown using the toe-pinch technique. Then, insert the three electrocardiogram leads subcutaneously. Place one lead each to the left and right of the heart and one at the base of the left hind limb.
Insert the rectal thermometer probe using a sterile probe sheath and lubricant. Then, place a pillow respiration sensor on the epigastric regions of the abdomen, and secure it in place using cardboard to acquire pressure sensitive signaling.
Confirm that all physiological signals are being acquired through the monitoring software outside the scanner room. Next, set up the heating module and fan to begin warming the airflow to the mouse. Secure the air tubing in place such that the warm air blows towards the mouse, starting just past the tip of its tail. Finally, place the RF coil over the mouse and make sure all cables and tubing are secure.
Let us now review the step-by-step protocol to perform cardiac MRI on the anesthetized mouse.
First, tune and match the RF coil outside the bore of the magnet to ensure maximum signal detection. This is indicated by a narrow valley at zero hertz for each component of the RF coil. Next, slowly insert the imaging stage into the bore of the magnet. Ensure that the mouse is positioned directly in the center of the bore and the gradient coil has equal spacing along all radial directions. This position ensures a homogeneous main magnetic field.
Next, run a navigation scan to locate the mouse within the scanner. Confirm if some segment of the heart is visualized within all three planes, namely axial, sagittal, and coronal. Then, set the parameters for the FLASH sequence and select the external triggering to be on. On the monitoring software, configure the external triggers such that the MRI sequences are serially run only on R-peaks in cardiac cycles during stable respiration in the expiratory phase.
Next, prescribe the initial FLASH sequence by setting the parameters and positioning an imaging plane rectangle in the coronal view. Then press continue to run it such that the slice plane follows the axis from the apex of the heart through the aortic valve. This initial cine loop will provide a two-chamber view of the heart.
Then, while referencing the results from the two-chamber view, prescribe and run a new FLASH sequence along the apex aortic valve axis to visualize a four-chamber view.
Finally, prescribe a short axis slice that is perpendicular to the apex aortic valve axis approximately halfway through the heart. The papillary muscles should be distinctly visible within the cine loop output at this location. Once imaging is completed, transfer acquired data to an appropriate location for analysis, then retract the imaging stage from the bore of the magnet and remove the gradient coil and all probes from the animal before transferring the animal from the scanner bed.
Now that we’ve obtained a cardiac MRI in a mouse, let us review the results of the scans. This figure shows the cine loop of a short axis view of the left ventricle, directly perpendicular to the base apex axis of the heart and at a position that includes the papillary muscles.
Here, we see the blood cine imaging of a mouse heart with 14 short axis view snapshots across the cardiac cycle, including end diastole and peak systole. The regions of dropout signal within the lumen of the left ventricle indicates fast blood moving, which was originally out of plane and not tagged by the RF wave excitation.
This image shows a four-chamber view of the heart with bright blood inflow through the mitral and tricuspid valves, and then out through the aortic and pulmonary valves, respectively.
Finally, here is a maximum intensity projection that shows how multiple slices can be spatially combined to visualize the cardiovascular system of the whole mouse. The figure shows a 3-dimensional stack of time-synced, bright, 2-dimensional blood images showing the thoracic and abdominal regions of a mouse.
Let us now look at some other applications of this MRI technique. As an extension of the described technique, we can use this technology to compare the kinematics of healthy versus diseased hearts. Murine models of cardiac dysfunction can be far more controlled than those found in the clinic. This allows researchers to identify specific factors contributing to heart disease as well as study the remodeling process after injury.
A comparable research endeavor can be performed with a vascular focus, such as that with abdominal aortic aneurysm formation. Blood gives a high intensity signal using the high-field small-bore MRI method described here. This increase in contrast can be exploited to assess the expansion of an abdominal aortic aneurysm and measure changes to the vessel’s biomechanical properties.
You’ve just watched JoVE’s introduction to cardiovascular magnetic resonance imaging.
You should now know how to perform cardiac imaging and how to acquire cine loop data of the murine heart using standard bright blood FLASH MRI sequences synced with cardiac and respiration signals. Finally, you should also know how to identify cardiac structures in these images. Thanks for watching!