The Enzyme-linked Immunospot, or ELISPOT, assay is a method to analyze the immune response to a pathogen or cell damage. It allows for quantification of the activation of different immune cells by detecting specific proteins they secrete. For example, ELISPOT is commonly used for measuring T-cell responses upon exposure to a foreign antigen by detecting secreted cytokines.
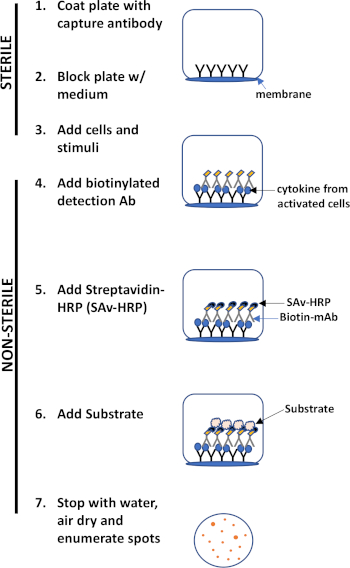
For a cytokine-based ELISPOT assay, the process begins with the coating of an ELISPOT microplate with a capture antibody, which is specific to the target cytokine. After the antibody coating, T-cells are added to the wells and stimulated by an external agent, like anti-CD3 antibody, for example. The cells then secrete the target cytokine, which immediately gets immobilized by the capture antibody. Since the protein is captured instantly post-secretion from live cells, without dilution or degradation, this assay has a high accuracy. After the target cytokine is immobilized, a detection antibody is added, which also binds to the captured cytokine.
The ELISPOT technique can also be used to quantify memory B-cells after an infection or vaccination by analyzing their production of specific antibodies. In an antibody-based ELISPOT, a specific antigen is used instead of an antibody for either the capture step, where the antigen will be bound to the plate, or at the detection step, where the antigen detects the target antibody post-capture. In all variations of the process, for T-cells or B-cells, the detection antibody or antigen is biotinylated, which allows it to bind to a streptavidin-conjugated detection enzyme, such as horseradish peroxidase. Then, upon addition of the peroxidase’s substrate, AEC, a dark, insoluble precipitate is produced. This precipitate marks the location of the captured protein, and each secretory cell results in a visible spot, which can be quantified using an ELISPOT reader or a microscope. The size of the spots is a relative estimate of the amount of protein secreted from each cell. This assay can detect immune responses from single cells, even in relatively small subpopulations of secretory cells, making it useful for studying immune responses at the cellular level.
In this video, you will learn how to perform an ELISPOT assay and then quantify the spots representing the secretory cells.
Throughout the experiment, ensure sterile conditions by working in a laminar flow hood and wearing gloves.
All calculations in this protocol are based on the volume needed for one 96-well plate.
First, dilute the anti-cytokine capture antibody. To do this, transfer 10 milliliters of buffer into a sterile 15 milliliter conical tube. Then, use a pipette to add 10 microliters of one milligram per milliliter of monoclonal antibody to the buffer to create a solution with a final concentration of one microgram per milliliter. Next, pour the capture antibody solution into a sterile reservoir and, using a multichannel pipette, distribute 100 microliters into each well of a 96-well ELISPOT plate.
Cover the plate with a plate cover, seal it to prevent evaporation, and incubate overnight at four degrees Celsius. The next day, uncover the ELISPOT plate in the laminar flow hood. Quickly invert the plate onto sterile wipes to remove the capture antibody solution from each well. Next, use a multichannel pipette to add 200 microliters of cell culture medium to each well. This step will block non-specific binding during the assay. Replace the plate cover and incubate in a 37 degrees Celsius incubator for two hours.
While the plate is incubating, prepare a 2X mitogen solution by adding one microliter of PMA and 20 microliters of ionomycin to 10 milliliters of cell culture medium to achieve a final concentration of 15 nanograms per milliliter PMA and one micromolar ionomycin.
Cellular suspensions of mouse splenocytes should also be prepared at this time in a sterile hood. Using a microscope and hemocytometer, measure the concentration of cells and adjust the total volume until a stock concentration of two million cells per milliliter is reached.
After incubation is complete, quickly invert the plate onto sterile wipes to remove the cell culture medium from each well. Next, add 200 microliters of the prepared cellular suspension stock solution to the wells in the top row of the ELISPOT plate. Set up the experiment in triplicate, so that each cell type tested will be plated in a set of three grouped columns. Below this, add 100 microliters of plain cell culture medium to the next five rows of the plate, below the rows containing cellular stock solution.
Next, perform a serial dilution by pipetting 100 microliters of the cell suspension from the top row into the row directly below, gently pipetting the solution up and down to evenly distribute the cells. Repeat this process for the remaining rows, moving 100 microliters from the previous row to the row below at each step, continuing until the fifth row has been serially diluted. Leave the sixth row with cell culture medium only, to serve as a control. To stimulate the cells in the experimental wells of the plate, add 100 microliters of the prepared mitogen solution to the cellular suspensions in each well of rows one through five. Be sure to leave the sixth row, which will serve as the control, unstimulated. Replace the lid and incubate the plate at 37 degrees Celsius and 5% CO2 for 24 to 48 hours.
Prepare the diluted biotinylated anti-cytokine detecting antibody. First, prepare 50 milliliters of assay diluent by adding 5 milliliters of 10% fetal bovine serum to 45 milliliters of PBS. Next, dilute the detecting antibody to a concentration of 2 micrograms per milliliter in assay diluent. Also, prepare 20 to 25 milliliters of wash buffer at this time, by mixing .05% Tween-20 and PBS.
After the incubation is complete, uncap the plate and quickly invert it to remove all liquid from the wells. Wash the plate by adding about 200 microliters of wash buffer to each well. Expel this liquid by quickly inverting and flicking the plate over a sink. Repeat this process four more times for a total of five washes. Next, add 100 microliters of the diluted detection antibody solution to each well, replace the lid, and incubate at room temperature for two hours. After incubation, expel the detection antibody solution from the wells of the plate by inverting and flicking the plate over the sink.
As before, wash the plate five times with wash buffer, expelling the liquid between each wash. After the final wash, prepare the streptavidin- horseradish peroxidase solution by diluting it according to the manufacturer’s instructions. Next, with the wells of the plate empty, add 100 microliters of diluted streptavidin- horseradish peroxidase solution to each well. Place the lid back onto the plate and incubate at room temperature for two hours.
After the incubation, no more than 15 minutes before use, activate pre-made AEC substrate solution. Discard the contents of the wells and wash the plate five times with wash buffer, as before. Then, immediately add 100 microliters of prepared AEC substrate solution into each well. Leave the plate at room temperature to develop for approximately 10 to 20 minutes, while monitoring spot development. These spots will appear as small, darkened circles on the surface of the wells. Then, stop the reaction by rinsing the plate with water and flicking it over the sink. Blot the plate on paper towels and allow to air dry overnight or until completely dry. Removing the plastic tray under the plate will facilitate drying. After drying, the spots are ready to be counted with an automated plate reader.
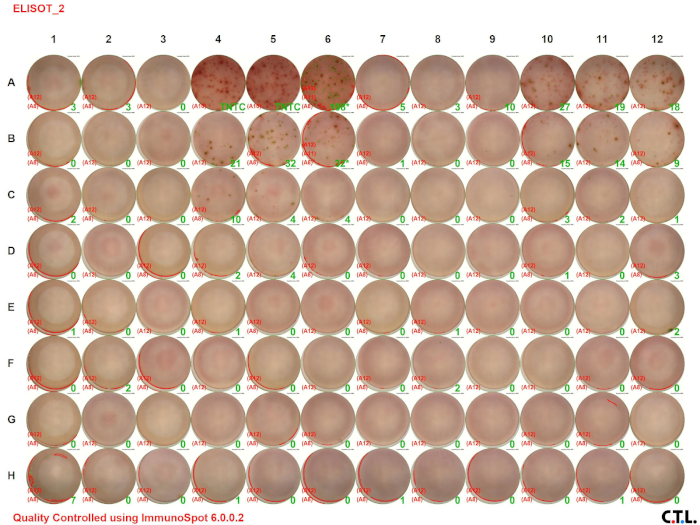
Here, the CTL ImmunoSpot reader is used, but this protocol can be adapted for any reader. Then, open the CTL program and click on Scan Count. Push eject for the tray to extend from the machine. Then, remove the plastic adapter and align row A on the ELISPOT plate and adapter. Choose a file name and location for the file to be saved and load the plate and adapter onto the tray. Click Load on the software and close the door on the side of the machine. Then, press Start After Counting. Ensure that the file is saved and then open the Quality Control QC software to analyze the data and count the number of spots. Export this data as an Excel file. Once analysis is complete, click Eject to retrieve the plate.
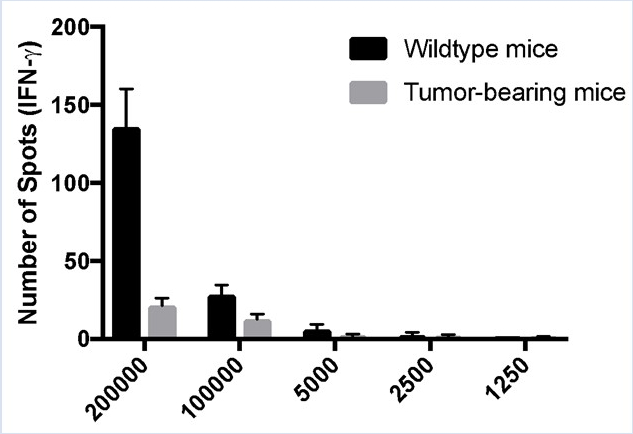
In this experiment, cells from wild type and tumor-bearing mice were plated and analyzed for IFN gamma. Notice that the number of spots decreases with decreasing cell concentration. Typically, ELISPOT data are presented as the number of spot counts per number of cells plated. In this example, the number of spots were displayed in a bar graph, with each respective cellular concentration listed on the x-axis. Notice that the number of spots indicates the number of activated cells per total number of cells in a given population.