Microscopia de imunofluorescência: Coloração por imunofluorescência de secções de tecido embebidos em parafina
English
Share
Overview
Fonte: Thomas Chaffee1, Thomas S. Griffith2,3,4, e Kathryn L. Schwertfeger1,3,4
1 Departamento de Medicina de Laboratório e Patologia, Universidade de Minnesota, Minneapolis, MN 55455
2 Departamento de Urologia, Universidade de Minnesota, Minneapolis, MN 55455
3 Centro de Câncer Maçônico, Universidade de Minnesota, Minneapolis, MN 55455
4 Center for Imunology, University of Minnesota, Minneapolis, MN 55455
Análises patológicas de seções teciduais podem ser utilizadas para obter uma melhor compreensão da estrutura tecidual normal e contribuir para a compreensão dos mecanismos da doença. Biópsias teciduais, seja de pacientes ou de modelos in vivo experimentais, são frequentemente preservadas por fixação em formalina ou paraformaldeído e incorporação em cera de parafina. Isso permite que o armazenamento a longo prazo e os tecidos sejam seccionados. Os tecidos são cortados em seções finas (5 μm) usando um microtome e as seções são aderidas a lâminas de vidro. As seções teciduais podem ser manchadas com anticorpos, que permitem a detecção de proteínas específicas dentro das seções teciduais. A coloração com anticorpos conjugados a fluoroforos (também conhecidos como fluorochromes) – compostos que emitem luz em comprimentos de onda específicos quando excitados por um laser – é conhecida como imunofluorescência. A capacidade de detectar proteínas dentro de uma seção pode fornecer informações como heterogeneidade do tipo celular dentro do tecido, ativação de vias específicas de sinalização e expressão de biomarcadores. Dependendo dos fluoroforos utilizados e do tipo de microscópio disponível para análise, podem ser utilizadas múltiplas cores, o que permite a análise multiplexada dos alvos.
O protocolo a seguir descreve as etapas básicas envolvidas na coloração da imunofluorescência das seções de tecido incorporado parafina. É importante notar que este protocolo não incluirá detalhes sobre a fixação de tecido, processo de incorporação de parafina ou secção dos tecidos. Uma vez que os tecidos são seccionados e colocados em lâminas de vidro, eles são reidratados através de uma série de incubações de etanol classificado (EtOH). As seções são incubadas com um reagente bloqueador para reduzir a ligação não específica de anticorpos à seção tecidual. As seções são então incubadas com um anticorpo primário que pode ou não ser rotulado diretamente com um fluoróforo. Se o anticorpo primário não for rotulado diretamente, as seções são então incubadas com um anticorpo secundário rotulado com um fluoróforo. Diferentes anticorpos podem exigir diferentes condições de coloração, assim estão incluídas sugestões de otimização de anticorpos. Após a lavagem para remover todos os anticorpos desvinculados, os slides são montados com mídia contendo DAPI para rotular fluorescentemente o núcleo. Uma vez que a mídia de montagem secou, os slides podem ser imagens usando um microscópio com lasers que podem detectar os diferentes fluoroforos.
Procedure
Results
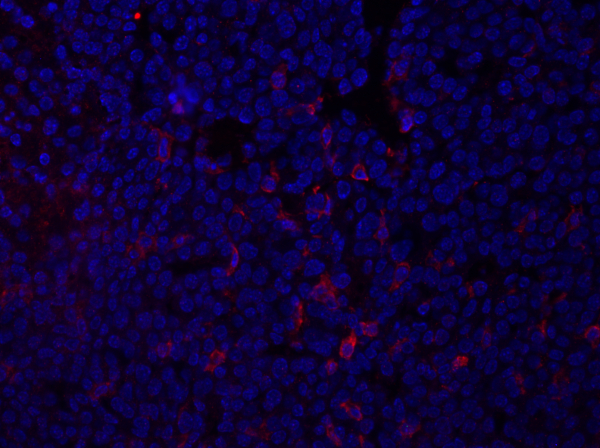
Figure 1: F4/80 staining of a mammary tumor section. Following fixation, a mouse mammary tumor was sectioned and stained with anti-F4/80 and mounted using a DAPI-containing mounting media. Staining is shown by cell surface F4/80 staining in red. Please click here to view a larger version of this figure.
The data obtained from the imaging will provide information regarding the intensity and localization of expression of the protein-of-interest within the tissue section. Depending upon the protein being examined, these data could also provide information regarding the frequency of specific cell populations within the tissue section. This can be quantified by counting the number of positively stained cells and comparing with total cell population.
Applications and Summary
Immunofluorescence allows for the investigation of protein expression and localization within the context of a tissue section. This technique can be used to understand how tissues change in the context of disease by examining protein localization or cell number in normal and diseased tissues. Changes in localization or in expression patterns can be determined and linked to specific attributes of the samples.
References
- Im K, Mareninov S., Diaz MFP, Yong WH. An Introduction to Performing Immunofluorescence Staining. Yong W. (eds) Biobanking. Methods in Molecular Biology. 1897, Humana Press, New York, NY (2019)
- Ramos-Vara JA. Principles and Methods of Immunohistochemistry. Gautier JC. (eds) Drug Safety Evaluation. Methods in Molecular Biology. 1641, Humana Press, New York, NY (2017)
- Donaldson JG. Immunofluorescence Staining. Current protocols in Cell Biology. 69 (1):1 4.3.1-4.3.7. (2015)
Transcript
The function of a protein in a cell is largely dependent on its proper localization within the cell. Immunofluorescence microscopy is a method by which a protein can be visualized inside cells using fluorescent dyes. A fluorescent dye is a fluorophore, that is a molecule that absorbs light energy at a specific wavelength by a process called excitation, and then immediately releases the energy at a different wavelength, known as emission.
Fluorescent dyes are conjugated to a target-specific antibody and introduced into cultured cells or tissue by immunostaining. When this primary antibody binds to the protein of interest, the protein gets labeled with the fluorescent dye. Alternatively, the fluorescent dye can be conjugated to a secondary antibody, instead of the primary antibody, and the secondary antibody binds to the protein primary antibody complex to label the target. After that, the sample is sealed in an antifade mounting medium to preserve the fluorescence labeling and is then ready for imaging on a fluorescence microscope.
A fluorescence microscope is equipped with a powerful light source. The light beam first passes through an excitation filter, which allows only the light at the excitation wavelength to pass through. The excitation light then reaches a specialized mirror, called a dichroic mirror or a beam splitter, which is designed to selectively reflect the excitation wavelength towards an objective lens. The lens then focuses the light onto a small region in the sample. Upon reaching the sample, the light excites the fluorophores, which then emit the light energy at a different wavelength. This light is transmitted back through the objective lens to the dichroic mirror. Since the emission wavelength is different from the excitation wavelength, the dichroic mirror allows the emission light to pass through. Then, it goes through a second filter, called the emission filter, which eliminates light from any other wavelengths that may be present. After that, the light rays now reach the eyepiece or camera, where they present a magnified image created from the emitted light from the specific fluorophores. This image represents the location of the protein of interest within the cell.
DNA binding fluorescent dyes are often used along with immunostaining to label nuclei as a point of reference within the cells. Multiple different fluorophores, with different excitation emission wavelengths, can be used for different proteins within the same sample to compare localization of the proteins.
This video demonstrates the procedure for immunofluorescent staining of a protein of interest in a tissue sample followed by imaging the sample on a fluorescence microscope.
Before beginning the staining process, the sections, which were dehydrated during the embedding process, need to be rehydrated. To do this, first, place the slides into a slide holder and then completely submerge the slides in 100% Xlene isomers. Allow the slides to incubate for three minutes. Then, remove the slides from the container, wipe off any excess Xylene with a paper towel, and place them into a new Xylene bath in a fresh container, for a further three minutes. Repeat this incubation each time in a new container with fresh Xylene and wiping down the slides with paper towels before transferring to the new container, for a total of three incubations. Next, incubate the sections in a series of graded ethanol solutions, starting with 100% ethanol for two minutes. Wipe off the slide rack with a paper towel, and transfer the slides to a new container of 100% ethanol for another two minutes. Continue the cycle of washing, wiping excess ethanol with a paper towel, and transferring the slides to a new bath, following the indicated concentrations of ethanol for the specified time. After the final ethanol wash, shake off the excess solution and incubate the slides in 1X PBS for five minutes.
To begin the staining process, first, circle the sections with a PAP pen to identify the minimal area that the buffers need to cover. Once the sections are clearly marked on the slide, add 100 microliters of blocking buffer to each slide, making sure to cover the entire section surface. After the tissues are covered in blocking buffer, place the slides in a humidified chamber. Leave the slides to incubate for one hour at room temperature.
Following the desired incubation time, remove the blocking buffer by draining it off the slide. Next, dilute the primary antibody in blocking buffer. For a 1:100 dilution, add 990 microliters of blocking buffer to a 1.5 milliliter centrifuge tube, followed by 10 microliters of the primary antibody to the same tube. Label one slide as a control and then add 100 microliters of blocking buffer. This control will help identify any non-specific binding of the secondary antibody. Now, add 100 microliters of primary antibody buffer to the remaining slides. Incubate the sections overnight in a humidified chamber at four degrees celsius, in the dark.
Following the overnight incubation, remove the sections from the chamber and drain the primary antibody off each slide and the blocking buffer from the control. Place the slides into a slide rack and then wash them three times in 1X PBS for ten minutes each. While the slides are washing in 1X PBS, dilute the secondary antibody in blocking buffer. For a 1:200 dilution, add 995 microliters of blocking buffer to a 1.5 milliliter tube, followed by five microliters of the secondary antibody to the same tube. Add the secondary antibody to all of the sections, including the control, and incubate them for one hour in a humidified chamber protected from light. When the timer sounds, remove the slides from the incubator. Drain the secondary antibody off the sections. Once the secondary antibody is removed, place the slides in a slide rack and then completely submerge the slides in 1X PBS for 10 minutes, protected from light. Repeat this wash three times, using fresh 1X PBS for each wash. Following the washes, add two to three drops of mounting media containing DAPI to each slide and place a glass coverslip on the samples. Allow the slides to dry overnight in a dark place before imaging the sections using a fluorescent scope.
During imaging, the details of image capture will depend upon the specific microscope and software available. However, in this particular example, the software Leica Application Suite, Version 3. 8, is used to perform the analysis. Using this program, click on the Acquire tab and in Image Overlay Acquisition mode, enable both DAPI and RFP. Next, adjust the Exposure, Gain, and Gamma for both DAPI and RFP, by taking an initial using the default settings defined by the software, and then optimizing for brightness by modifying the exposure time and the gain, keeping in mind that minimal optimal settings are desirable to avoid image saturation and photobleaching of the samples. Gamma can be modified to optimize darker areas of an image.
Once the settings are adjusted, press the Acquire Overlay button to create overlay images of the DAPI and RFP exposures. This example image, captured using the demonstrated technique, shows a mouse mammary tumor section, stained with the antibody F4/80, which detects an antigen, depicted in red, on macrophages and other myeloid cells. Since DAPI-containing mounting media was used, nuclei are shown in blue. The data from the imaging will provide information regarding the intensity and localization of the protein within the tissue section.
For example, in the image of the tumor stained with F4/80, cell surface staining of this antigen is observed. These data can also provide information regarding the frequency of specific cell populations within the tissue section. This can be quantified by counting the number of positively stained cells, here shown in red, and comparing that with the total cell population, shown in blue, and calculating the frequency using the following equation.