Summary

In vivo Clonal Tracking of Hematopoietic Stem and Progenitor Cells Marked by Five Fluorescent Proteins using Confocal and Multiphoton Microscopy

Published: August 06, 2014
doi:

Summary

Combinatorial 5 fluorescent proteins marking of hematopoietic stem and progenitor cells allows in vivo clonal tracking via confocal and two-photon microscopy, providing insights into bone marrow hematopoietic architecture during regeneration. This method allows non-invasive fate mapping of spectrally-coded HSPCs-derived cells in intact tissues for extensive periods of time following transplantation.

Abstract

We developed and validated a fluorescent marking methodology for clonal tracking of hematopoietic stem and progenitor cells (HSPCs) with high spatial and temporal resolution to study in vivo hematopoiesis using the murine bone marrow transplant experimental model. Genetic combinatorial marking using lentiviral vectors encoding fluorescent proteins (FPs) enabled cell fate mapping through advanced microscopy imaging. Vectors encoding five different FPs: Cerulean, EGFP, Venus, tdTomato, and mCherry were used to concurrently transduce HSPCs, creating a diverse palette of color marked cells. Imaging using confocal/two-photon hybrid microscopy enables simultaneous high resolution assessment of uniquely marked cells and their progeny in conjunction with structural components of the tissues. Volumetric analyses over large areas reveal that spectrally coded HSPC-derived cells can be detected non-invasively in various intact tissues, including the bone marrow (BM), for extensive periods of time following transplantation. Live studies combining video-rate multiphoton and confocal time-lapse imaging in 4D demonstrate the possibility of dynamic cellular and clonal tracking in a quantitative manner.

Introduction

The production of blood cells, termed hematopoiesis, is maintained by a small population of hematopoietic stem and progenitor cells (HSPCs). These cells reside within the bone marrow (BM) in a complex microenvironmental niche consisting of osteoblasts, stromal cells, adipose tissue, and vascular structures, all implicated in the control of self-renewal and differentiation1,2. As intact BM has been traditionally inaccessible to direct observations, the interactions between HSPC and their microenvironment remains largely uncharacterized in vivo. Previously, we established a methodology to visualize the 3D architecture of intact BM using confocal fluorescence and reflection microscopy3. We characterized expansion of EGFP-marked HSPCs in the BM, but the use of only a single FP precluded analysis of regeneration at a clonal level. Very recently we took advantage of the Lentiviral Gene Ontology (LeGO) vectors constitutively expressing fluorescent proteins (FPs) to efficiently mark cells4,5. Co-transduction of HSPC with 3 or 5 vectors generates a diverse palette of combinatorial colors, allowing tracking of multiple individual HSPC clones.

Marked HSPC combined with new imaging technology permitted to trace individual HSPC homing and engraftment in the BM of irradiated mice. LeGO vectors were used to mark HSPC with 3 or 5 different FPs (from Cerulean, eGFP, Venus, tdTomato, and mCherry) and follow their engraftment over time in the BM by confocal and 2-photon microscopy, allowing clear visualization of bone and other matrix structures, and the relation of HSPC clones to components of their microenvironment. HSPC were purified as the lineage negative cells from C57Bl/6 mice BM, transduced with LeGO vectors, and reinfused by tail vein injection into myelo-ablated congenic mice. By monitoring large volumes of the sternum BM tissue we visualized endosteal engraftment occurring early in BM regeneration. Cell clusters with diverse color spectra appeared initially in close proximity to the bone and progressed centrally over time. Interestingly, after more than 3 weeks the marrow consisted of macroscopic clonal clusters, suggesting spread of hematopoiesis derived from individual HSPCs contiguously in the marrow, rather than widespread dissemination of HSPCs via the bloodstream. There was less color diversity at late time points, suggesting difficulty in transducing long-term repopulating cells with multiple vectors.

In addition, HSPCs formed clusters in the spleen, an organ also responsible for hematopoiesis in mice. HPSC-derived individual cells could be resolved in the thymus, lymph nodes, spleen, liver, lung, heart, skin, skeletal muscle, adipose tissue, and kidney as well. The 3D images can be assessed qualitatively and quantitatively to appreciate the distribution of cells with minimal perturbations of the tissues. Finally, we illustrated the feasibility of live dynamic studies in 4D by combining resonant scanning multiphoton and confocal time-lapse imaging. This methodology enables non-invasive high resolution, multidimensional cell-fate tracing of spectrally marked cells populations in their intact 3D architecture, providing a powerful tool in the study of tissue regeneration and pathology.

Protocol

All mice were housed and handled in accordance with the Guide for the Care and Use of Laboratory Animals of the National Institutes of Health, and enrolled in an NHLBI Animal Care and Use Committee–approved protocol. Female B6.SJL-Ptprc(d)Pep3(b)/BoyJ (B6.SJL) and C57Bl/6 mice, 6-12 weeks old, were used as donor and recipient, respectively.

A list of materials, reagents, and equipment is provided in Table 1.

1. LeGO Transduction of Mouse HSPCs and Bone Marrow Transplantation

Perform procedures described below in a certified biosafety level 2 (BSL-2) cabinet (tissue culture hood).

  1. Production of LeGO Vectors Encoding 5FPs
    1. Use the lentiviral “Gene Ontology” (LeGO) vector plasmids, each encoding a different FP from a strong constitutive SFFV promoter, including LeGO-Cer2 (Cerulean), LeGO-G2 (EGFP), LeGO-V2 (Venus), LeGO-T2 (tdTomato), and LeGO-C2 (mCherry) kindly provided by Dr. Boris Fehse (University Medical Center Hamburg-Eppendorf, Hamburg, Germany); now also available from Addgene5-7.
    2. To produce LeGO vectors, seed 5 x 10⁶ 293T cells in 10 cm dishes (use 12 dishes for each vector) 24 hr prior to transfection in 8 ml of I10 media (IMDM supplemented with 10% FCS and glutamine /penicillin /streptomycin).
    3. Transfect the cells with Calcium Phosphate using slightly modified CAPHOS kit recommendations:
      1. For each plate mix 15 µg LeGO vector, 12 µg pCDNA3.HIVgag/pol.4xCTE, 4 µg pRev-TAT, and 1 µg pMD2.G-VSV-G plasmids in presence of 50 µl 2.5 M CaCl2, and add water to yield a 500 µl total volume.
      2. Precipitate DNA plasmids with 500 µl of 2x HeBS (HEPES-Buffered Saline) and incubate for 20 min at room temperature prior to adding to each plate of 293T cells.
      3. Incubate cells for 6 hr in a 37 °C 5% CO2 incubator; remove media and add fresh culture media 6 hr post transfection.
    4. Collect culture supernatants containing lentiviral particles from each plate, daily, for 3 days. Each day following supernatant collection add fresh I10 media to each plate.
      1. Filter through 0.22 µm pores, pool and concentrate supernatants by ultracentrifugation on an SW28 rotor for 2 hr at 71,900 x g and 4 °C.
      2. Resuspend the supernatants in 1 ml of StemSpan media. Aliquot the lentiviral stocks in 200 µl and store at -80 °C.
  2. Titration of Lentiviral Particles
    Determine the titer of LeGO vector particles in collected supernatants via quantitation of transducing units/ml using NIH3T3 cells. Titers allow calculation of the volume of each vector supernatant needed to result in the desired relative multiplicity of infection (MOI) for experimental target cells.
    1. Plate 5 x 10⁴ NIH3T3 cells per well (12-well plate) in 2 ml of I10 media one day before the titration.
    2. Prepare 5-fold serial dilutions of vector supernatants in I10 media supplemented with protamine sulfate (4 mg/ml is 1,000x).
    3. Remove the media from the cells, and replace with 500 µl of supernatant dilutions containing the equivalent of 2, 0.8, 0.32, and 0.128 µl of concentrated virus.
    4. Determine the number (No) of cells present per well at the time of transduction, counting one control well.
    5. 6 hr after transduction, add 2 ml of I10 media and incubate for 3 days at 37 °C, 5% CO2.
    6. Harvest the cells from each well using Trypsin-EDTA, and determine the percentage of fluorescent cells (%FP) via flow cytometry.
    7. Calculate the titer as follow, averaging the titers obtained for each well (dilution) resulting in a %FP between 1 and 50%: Titer (vector particles/ml) = No x %FP/ Volume of vector supernatant (ml). Average the titers obtained for each dilution if the %FP is between 1 and 50%.
  3. Mouse Cell Collection, Purification, Transduction, and Transplantation (schematically shown in Figure 1A adapted from Malide et al.4).
    1. Sacrifice donor mice by an approved procedure. Harvest bone marrow from anterior and posterior limbs: dissect humeri, femurs and tibias, thoroughly remove all muscle, ligaments and excess tissue from bones, cut across the end of each bone as close as possible to the joint, and flush the bone marrow out of the bone using a 27-0 G needle on a syringe containing I10 media.
    2. Pellet the whole bone marrow cells for 10 min at 500 x g, 4 °C and lyse red cells twice with 50 ml ACK buffer. Resuspend cells in 10 ml I10 media.
    3. Purify lineage negative (Lin-) progenitor cells with the MACS lineage depletion kit according to a modified kit protocol:
      1. Use 30 µl of Anti-Biotin MicroBeads instead of 10 µl/ 107 cells; complete the washing steps with I2 media (IMDM supplemented with 2% FCS) instead of buffer.
      2. Insert one washing step between the incubation with Biotin-Antibody Cocktail and the incubation with Anti-Biotin MicroBeads; and equilibrate the column with I10 instead of buffer.
    4. Culture Lin- cells for 48 hr at a starting density of 5 x 10⁵ cells/ml in StemSpan media supplemented with 10 ng/ml murine IL-3, 100 ng/ml murine IL-11, 100 ng/ml human Flt-3 ligand, and 50 ng/ml murine stem cell factor.
    5. Transfer 1 to 4 x 10⁵ cells to 12-well plates coated with RetroNectin and transduce with LeGO supernatants, each at a multiplicity of infection (MOI) of 6-7 to achieve 50% expression efficiency for each FP, in the presence of StemSpan media and cytokines detailed above and 4 µg/ml protamine sulfate.
    6. Transduce cells with each LeGO vector individually as described in step 1.3.5 and mix cells following transduction (termed Mix) or co-transduce cells with all 5 LeGO vector supernatants simultaneously (termed Co). Remove cells 24 hr later, wash once with StemSpan media without cytokines, and resuspend them in StemSpan media without cytokines for transplantation, or transfer them to fresh media with cytokines, and culture for additional 96 hr before confocal microscopy and flow cytometry.
      1. Perform bone marrow transplant by infusing transduced Lin- HSPCs via tail vein injection into 11 Gy single dose pre-irradiated recipients (6-18 hr prior to transplant) recipients, in a volume of 100 µl, at a cell dose per mouse corresponding to 1-4 x 10⁵ Lin- cells originally plated for transduction. In each experiment, transplant an entire cohort of animals with the same population of transduced donor BM cells.
      2. For in vitro characterization of transduced HSPCs, culture the cells for an additional 4-5 days in StemSpan supplemented with cytokines and analyze by flow cytometry for transduction efficiency, and by microscopy for color diversity.
        1. Sacrifice individual mice and retrieve tissues and organs for imaging, at various time points up to 120 days post-transplantation.
          1. Spray with ethanol the fur of the mouse and incise the skin on the ventral side avoiding hair dissemination.
          2. Dissect and excise according to standard procedures the spleen, popliteal lymph nodes, lung, heart, skin, adipose tissue, skeletal muscle, kidney, liver, as well as the head to access to calvaria.
          3. Alternatively, use calvaria or set up a bone window for live imaging repeatedly over time2,8,9 or image superficial organs such as the skin and lymph nodes in the live animal.
        2. Place individual organs in 35 mm number 0 cover glass culture dishes in 50-100 μl PBS for imaging them intact without sectioning, fixation or further processing as described in step 2.5.
        3. For volumetric imaging, keep the organs in in cold PBS until use. For time-lapse imaging proceed immediately to imaging organs in DMEM, 10% FBS containing 20 mM HEPES at 37 °C

2. Confocal and Two-photon Microscopy and Image Analysis

  1. Perform microscopy imaging using a Leica SP5 five channels confocal and multiphoton system equipped with multi-line Argon, diode 561 nm, HeNe 594 nm, and HeNe 633 nm visible lasers. Use in 2-photon mode, a pulsed femtosecond Ti:Sapphire (Ti-Sa) laser, tunable for excitation from 680 to 1,080 nm with dispersion correction. Use in experiments involving red-shifted FPs (tdTomato and mCherry), an optical parametric oscillator (OPO) laser to extend the output wavelength range as far as 1,030-1,300 nm, sequentially or simultaneously with the Ti-Sa laser.
  2. Image various tissues using a HCX-IRAPO-L 25X/0.95 NA water dipping objective (WD = 2.5 mm), a HC-PLAPO-CS 20X/0.70 NA dry objective (WD = 0.6 mm), or HC-PL-IRAPO 40X/1.1 NA water immersion objective (WD = 0.6 mm).
  3. Obtain confocal fluorescence spectra collecting lambda stacks (xyλ) of emitted light in 5 nm-bandwidths of the visible spectrum from BM cells transduced with a single FP LeGO vector as well as of control, not-transplanted BM.
    1. Process images with the Leica LAS-AF v2.4.1 software to create reference spectra of all 5 FPs as well as of autofluorescence (Figure 2A). Using the individual FP spectra and the difference in fluorescence brightness (expressed as % of EGFP) of Cerulean (79%), Venus (156%), tdTomato (283%) and mCherry (47%) set 5 sequential imaging channels as follows: Cerulean (458/468-482 nm), EGFP (488/496-514 nm), Venus (514/523-558 nm), tdTomato (561/579-597 nm), and mCherry (594/618-670 nm) (Figure 2B).
    2. Validate accurate FPs separation, as cells transduced with each individual FP are visible only in the corresponding channel and absent from the rest (Figure 2C). In addition, this defined multi-channel approach creates an unique 5-channels “colorprint” that enables subsequent color analysis and clonal tracking and has the advantage of reducing acquisition times compared to spectral imaging.
  4. Separate fluorescence emission, in 2-photon mode, by high-efficiency custom dichroic mirrors and collect with a four channels non-descanned detector (NDD) as follows: a dichroic mirror at 568 nm followed by a dichroic mirror at 465 nm, followed by a 452/45 nm emission filter for SHG or autofluorescence and Cerulean, a 525/40 nm emission filter for EGFP or Venus, and a 648 nm dichroic mirror and 620/60 nm emission filter for tdTomato or mCherry.
    1. Reveal structural information by two-photon microscopy intrinsic contrast imaging (as described above) of tissue autofluorescence from elastin, NADH, (excited at 780 nm), and second harmonic generated signal (SHG) from bone and fibrillar collagen (excited at 920 nm or 860 nm collected in a back-scattered direction)10,11.
  5. For 3D volume rendering, collect series of x-y-z images (typically 1 x 1 x 4 μm3 voxel size) along the z-axis at 5 μm intervals over a range of depths (150-300 μm) throughout the bone marrow and other tissues, over large regions using the tile function of the software to automatically generate stitched volumes comprising an entire sternum fossae, approximately 2.5 x 1.2 mm2 (x-y) and 300 μm (z) (Figures 2D-2E) and Movie 1.
    1. Image calvarial marrow directly through the skull without sectioning2, 8.
    2. Section sternum along the sagittal plane (bisection) and then transversally at the joint between 2 sternal fosse and image through the cut face3,4,12 (Overview in Figure 1B adapted from Takaku et al3).
  6. For 4D time-lapse imaging, place freshly excised popliteal lymph node, spleen, lung, or calvarial bone samples uncut onto 35 mm number 0 coverglass culture dishes, in 50-100 μl DMEM, 10% FBS containing 20 mM HEPES at 37 °C and use 2-photon Ti-Sa excitation (860 nm) combined with confocal excitation (458 nm, 488 nm, 514 nm, 561 nm, 594 nm) and Leica resonant scanner (8000 Hz/sec), taking z-stacks (~80 μm) at 20 sec intervals for up to 1 hr.
    1. For simultaneous three-color 2P imaging use Ti-Sa tuned at 860 nm simultaneously with the OPO laser (tuned at 1,130 nm for tdTomato; or 1,140 nm mCherry) (Movie 2).
  7. Reconstruction and Analysis of 3D Volumes and 4D time sequences
    1. Use Imaris x64 software version 7.6, or alternative software packages to transform the tiled-stacks of raw images into volume-rendered (3D) data of fluorescent cells inside bone marrow and different tissues and to export them as 3D-rotation movies, as previously described3,4 (Movie 1) step-by-step example:
      1. In Imaris, Open the z-stack image; Select “Surpass” in order to display the 3D volume visualization.
      2. Use “navigate” to turn the volume around 360°.
      3. Select “Animation” to create an animation; use key frames to add selected views, zoom, rotations of the volume; Preview the movie, edit as necessary and save the file in a desired movie format (ex: avi, mov).
    2. For quantitative assessment of the 3D cell and clone frequency, positions, sizes and distribution, further process the z-stacks using the Imaris XT modules which integrate MATLAB applications performing distance measurements (using a distance transformation algorithm) and clusters analysis, as previously described3,4. Transform the sequences of image stacks over time into volume-rendered four-dimensional (4D) movies with Imaris x64 software, and use spot and surface analysis for semiautomated tracking of cell motility in three dimensions using autoregressive motion algorithms.
    3. Perform multispectral analysis of cells as follows: extract the multi-color labeled spots by adding all 5 channels through channel arithmetic of Imaris XT into a new channel; determine for all spots (cells) the mean intensity fluorescence in each of the 5 component channels. Export the values in Excel software to plot graphs displaying the unique” colorprint” i.e. the relative % of each FP in individual cell (Figure 2E graph). Correct the data set for tissue drift, and calculate cell velocity and displacement over time, track lengths, paths, and distances; export values in Excel software to plot graphs. Assemble composite figures with Adobe Photoshop CSS 5 software.

Representative Results

Whole-mount 3D confocal/2-photon microscopy reconstructions of the sternal bone marrow time course revealed the engraftment and expansion of transplanted co-5FPs in a pattern with remarkable characteristics: clones appeared clearly delineated, homogenously marked with wide palette of colors initially and progress over time to preferentially contain cells of mostly one color. Confocal microscopy setup and representative examples of imaging 5FPs-marked HSPC in the sternal bone marrow are illustrated in Figure 2 and Movies 1 and 2.

Whole-mount 3D confocal/2-photon microscopy reconstructions of intact tissues demonstrate the possibility to trace the fate of color marked BM-derived cells for extended time periods in the live tissues. Representative examples of bone-marrow derived cells in hematopoietic and non-hematopoietic organs following transplantation are shown in Figure 3.

Figure 1
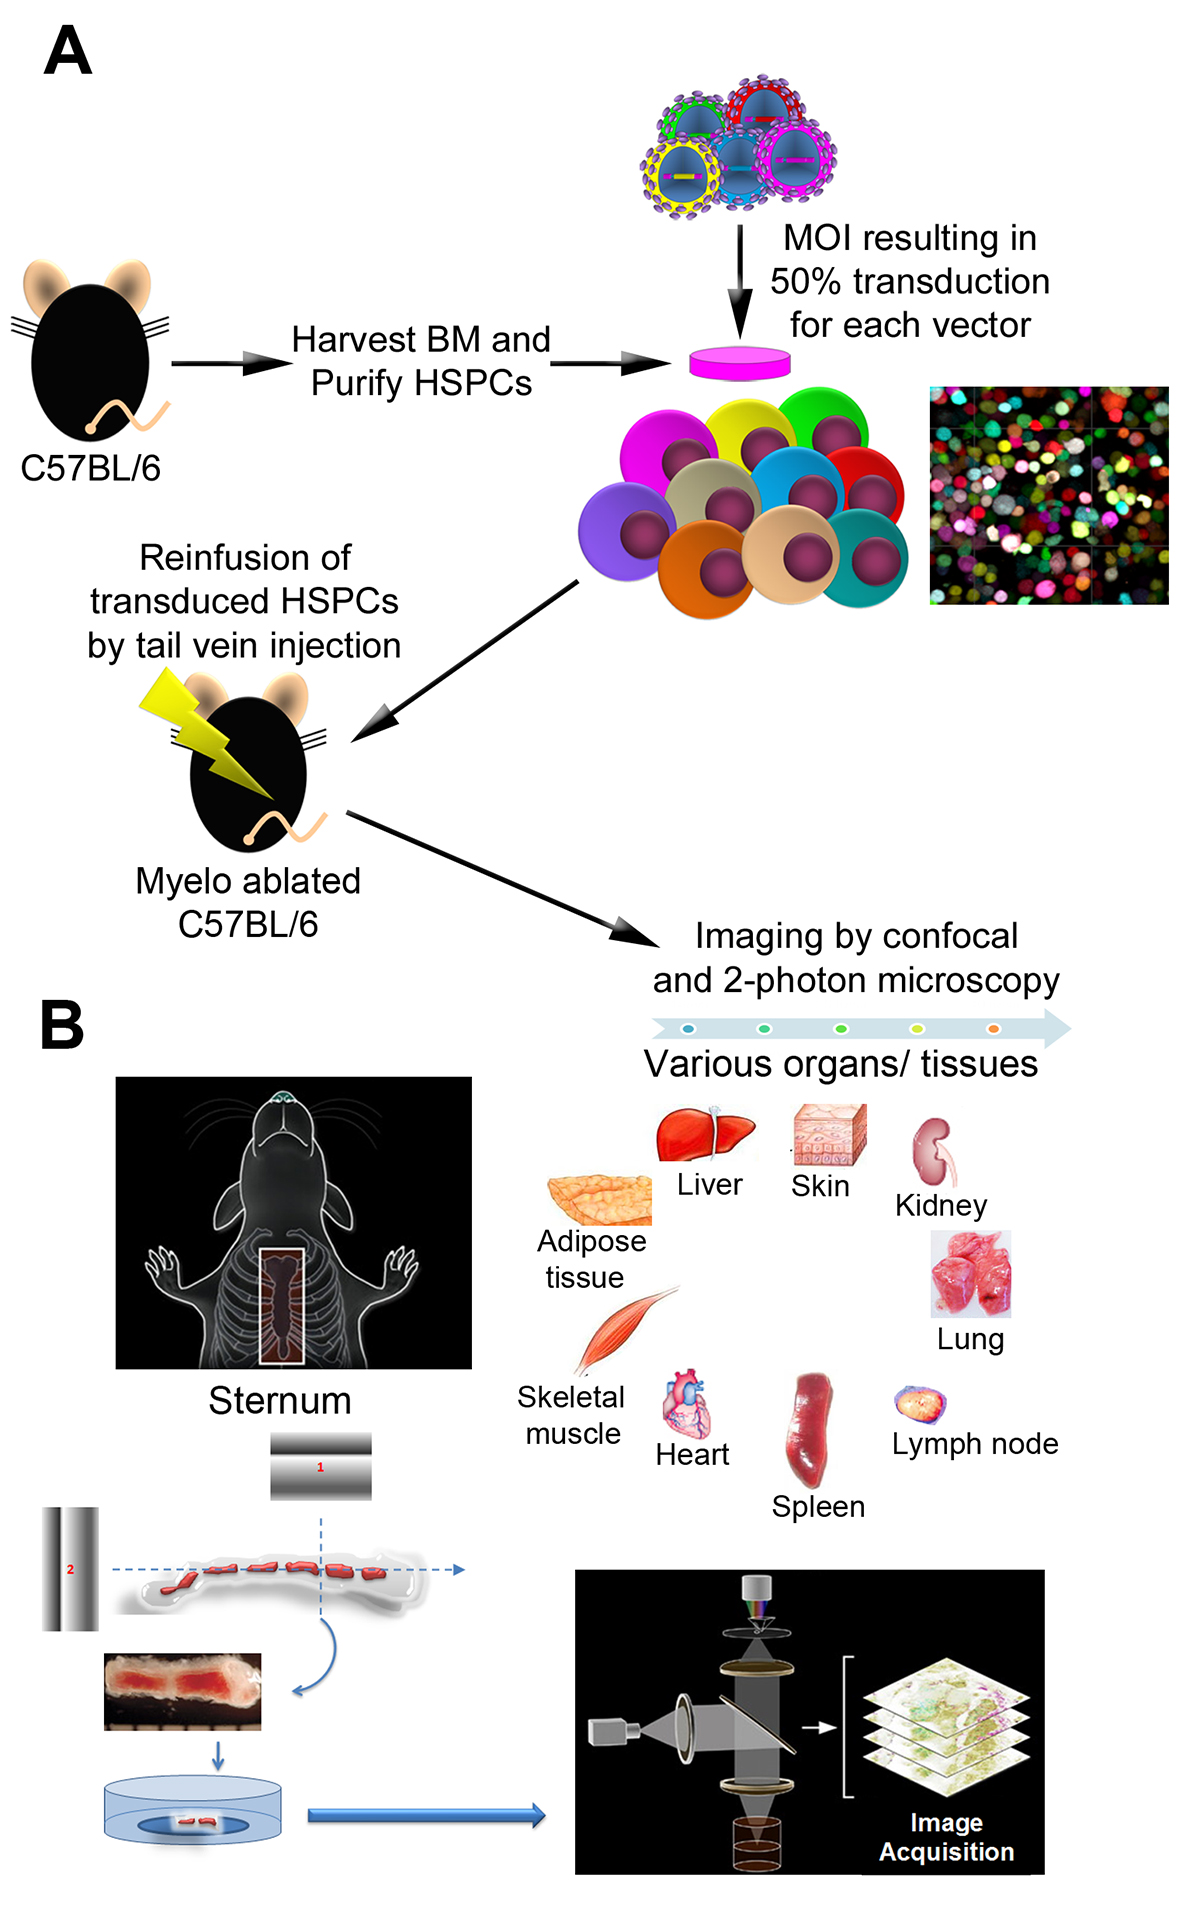
Figure 1. Overview of the experimental procedures. A) The schematic steps illustrate isolation of Lin- BM cells, transduction with LeGO vectors encoding a variety of FPs color variants, and reinfusion of transduced cells into-myelo-ablated mice (bone marrow transplant). B) Bone marrow (sternum, calvaria), as well as various organs/tissues were examined by confocal and two-photon microscopy at different time points following transplant. Panel A is adapted from Figure 1 in Malide et al.4 and Panel B adapted from Figure 1 in Takaku et al3.

Figure 2
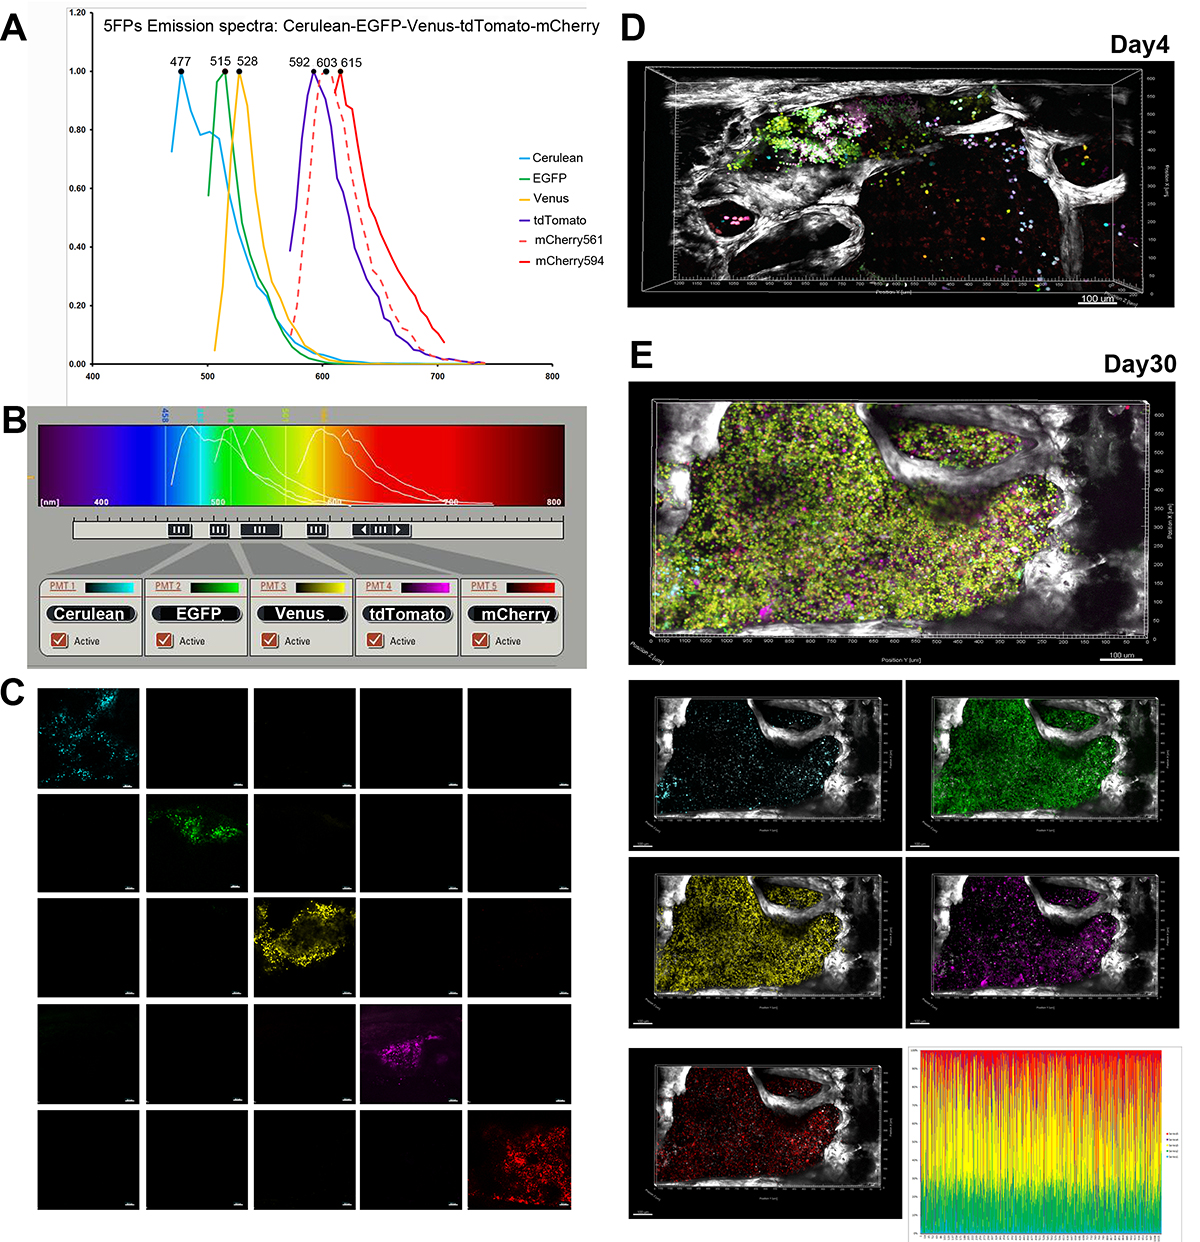
Figure 2. Confocal microscopy setup and representative example for imaging 5FPs-marked HSPC in the bone marrow. A) Spectral (xyλ) imaging used to record reference emission spectra for each FP, illustrated in normalized histograms pseudocolored with cyan (Cerulean), green (EGFP), yellow (Venus), magenta (tdTomato), and red (mCherry): excited by 594 nm- (solid red line) compared to 561 nm- (dashed red line) wavelength. B) Five channels set to image sequentially emission of: Cerulean (468-482 nm), EGFP (496-514 nm), Venus (523-558 nm), tdTomato (579-597 nm) and mCherry (618-670 nm). Panels A and B are adapted from Figure 1 in Malide et al.4 C) Imaging of sternal BM from mice transplanted with transduced with individual FP vectors. Each FP was visible only in the cells transduced with the corresponding vector imaged in the appropriate channel, and absent from the others (no cross-talk). D,E) Engraftment and expansion of transplanted co-5FP marked cells in the bone marrow in vivo. At day 4 post-transplant (D) clusters of cells marked in wide variety of colors were visible close proximity to the bone edge (SHG, white), preferentially located adjacent to the joint between two fossae. By day 30 (E) one large clone of unique color (green – yellow) has expanded to occupy the entire fossae as illustrated in the merged as well as single channels images. FPs content analysis demonstrates homogeneous marking by 2 FPs variants EGFP and Venus.

Figure 3
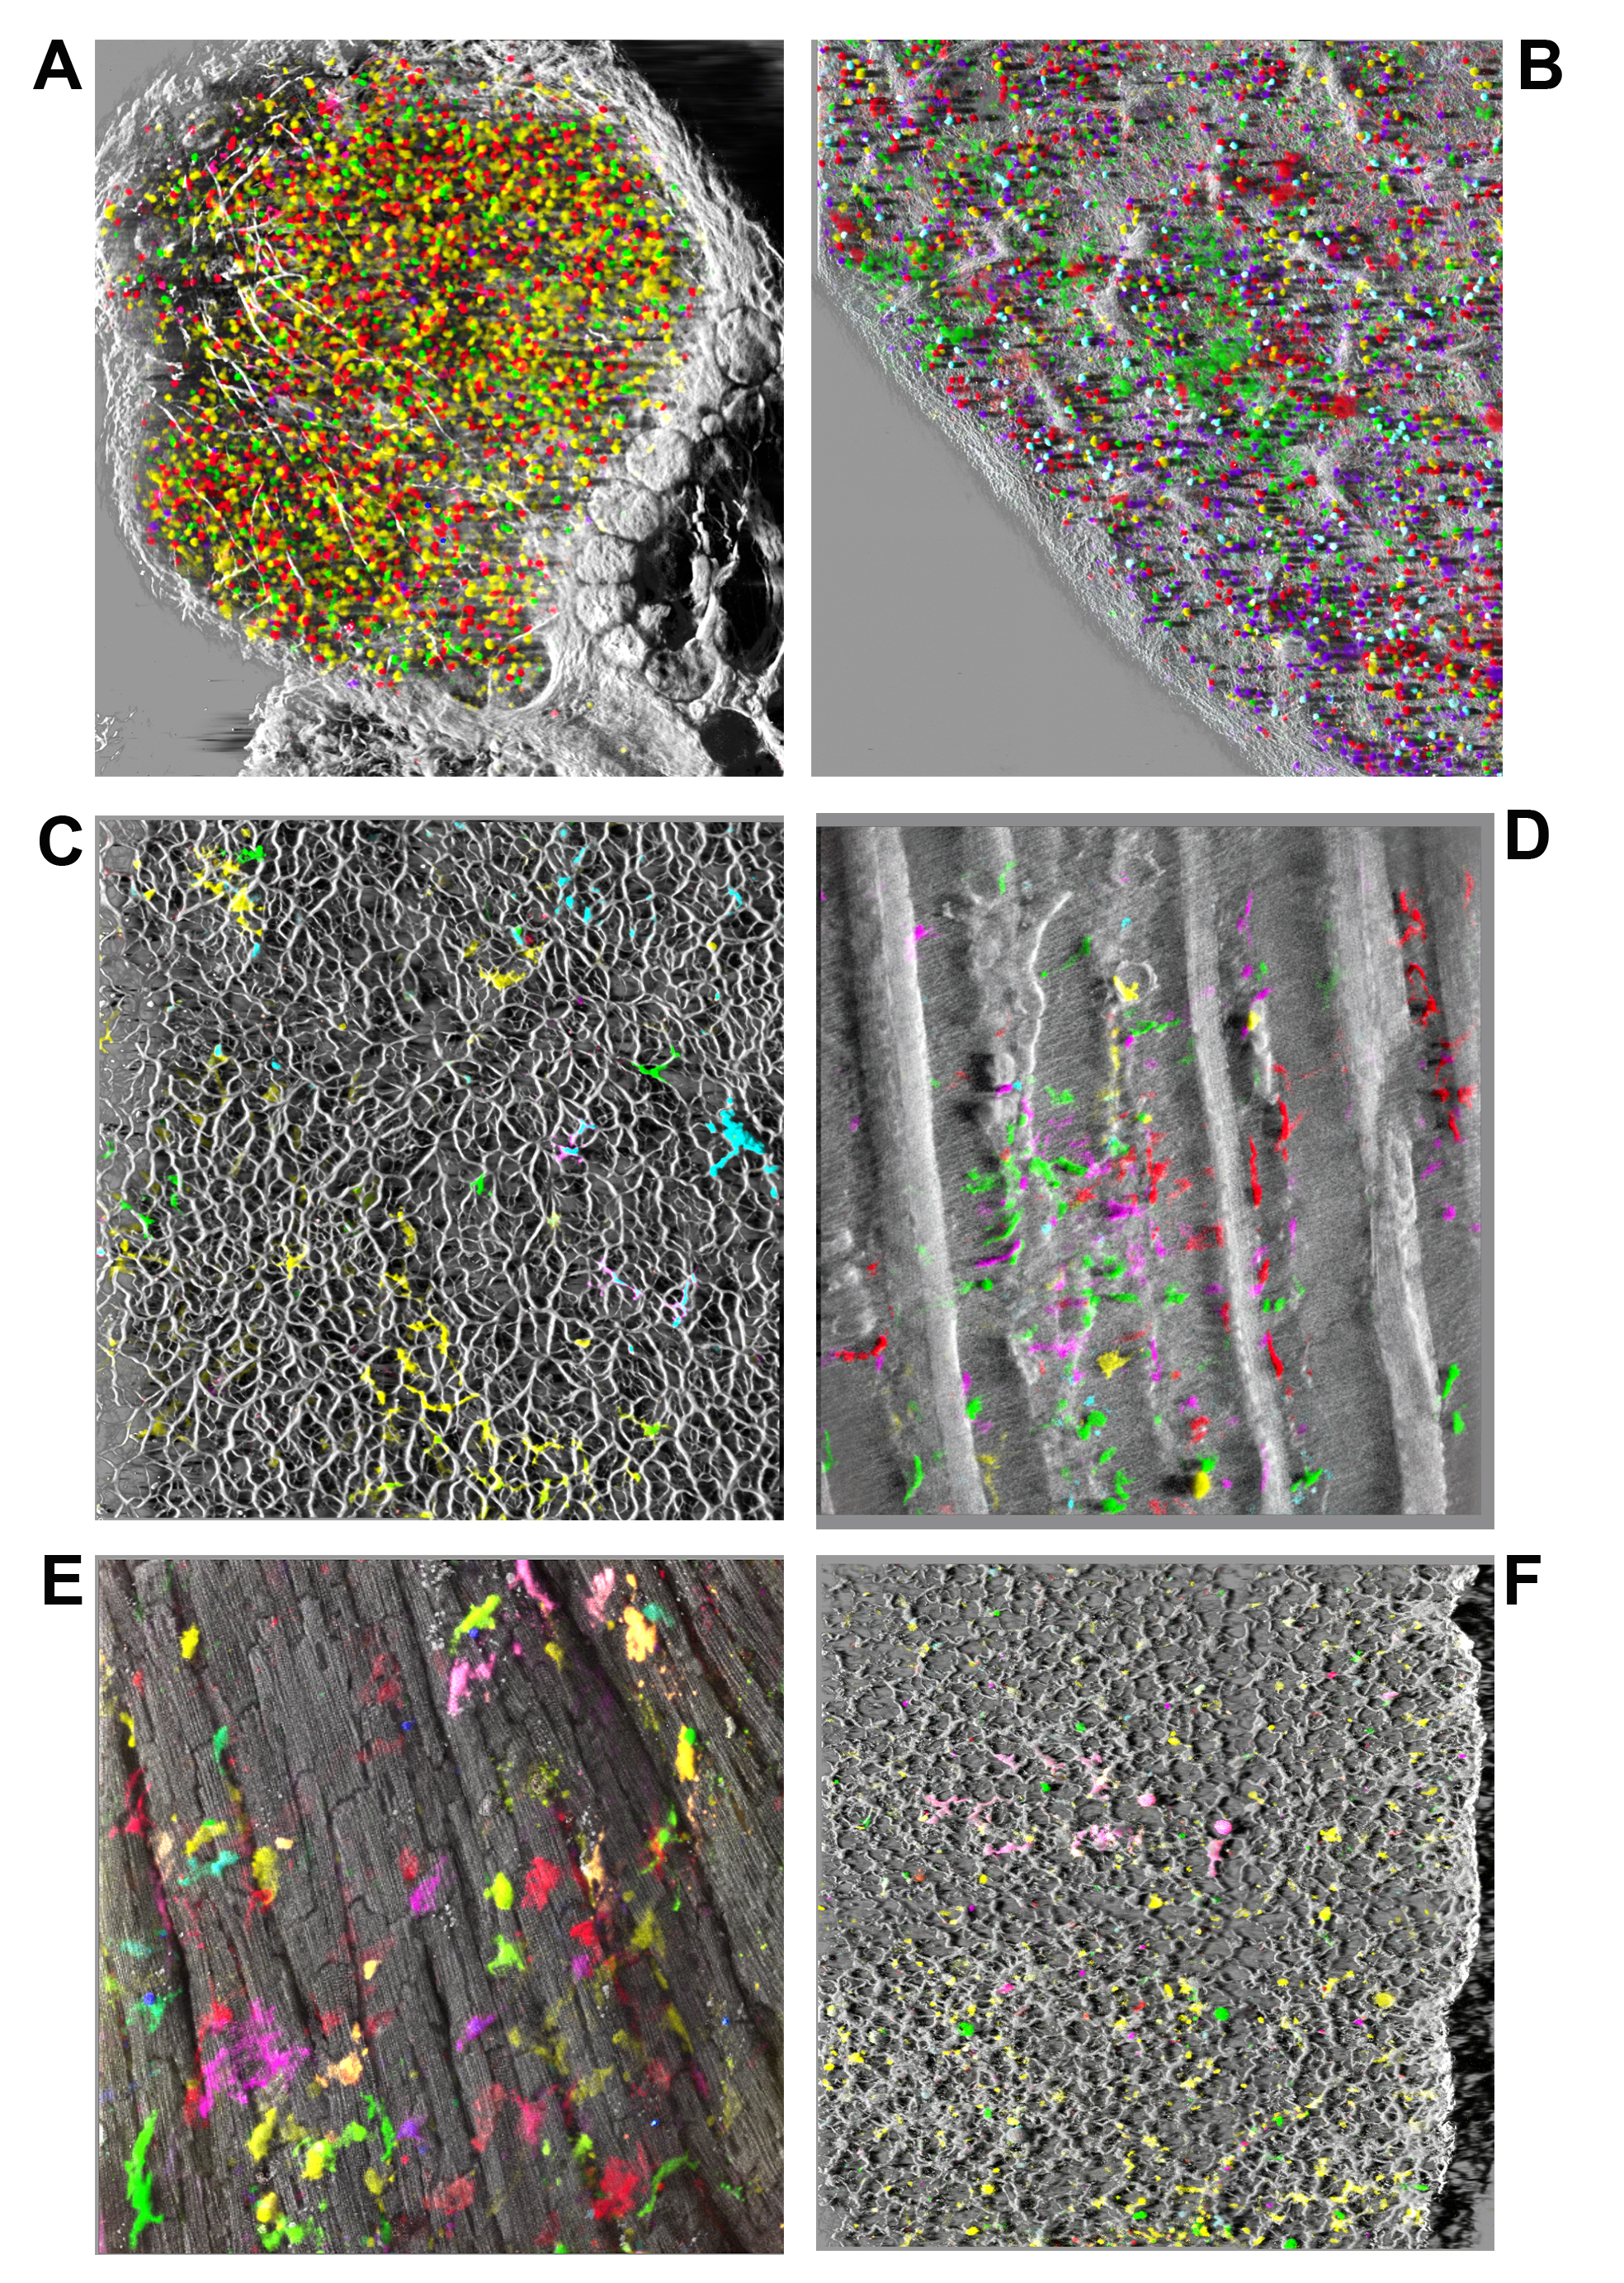
Figure 3. Examples of bone-marrow derived cells in hematopoietic and non-hematopoietic organs following transplantation. Various tissues and organs were imaged intact through depths of 150-200 µm and large surface areas, computationally stitched and rendered in 3D as shadow reconstructions. A) Popliteal lymph node at 120 days post-transplant demonstrates scattered cells mostly marked in yellow (Venus) and red (mCherry) peripherally surrounded by collagen fibers (white, SHG). B) Similarly, the spleen at the same time, displays small clusters and mostly scattered cells of various colors intertwined by collagen fibers network. C) In the liver fluorescent cells with morphology suggestive of stellate cells, or macrophages (Kupffer cells) of various colors were aligned along collagen fibers network (SHG white) delineating hepatic lobular structures. D) In an skin flap imaged from dermal side fluorescent cells of diverse colors and morphologies were seen, most with large size and morphology suggesting Langerhan’s or dendritic-like identity, lying under elastin fibers (autofluorescence at 780 nm, white) and along collagen (SHG at 920 nm, white) muscle fibers and hair follicles. E) In the heart viewed from the epicardial side numerous individual large fluorescent cells with macrophage-like morphology originating from multiple clones based on the diverse colors seen are visible superficially and also interspersed deeper between cardiomyocytes (white) visualized by their intrinsic two-photon autofluorescence (at 780 nm). No FP fluorescent cardiomyocytes were observed. Nearby cells (C-E) of the same color suggest in situ proliferation and short-distance migration. F) In the lung numerous fluorescent cells with a diverse palette of colors were scattered throughout the lace-like structure of collagen fibers (SHG) at all depth levels, with variable morphologies suggesting dendritic cell, macrophage, and type 2 pneumocyte identities.

Movie 1. 3D reconstruction of sternal BM at 4 days post-transplant Co 5FPs. Clusters of cells marked in wide variety of colors were visible in close proximity to the bone edge (SHG, white), preferentially located adjacent to the joint between two fossae. Please click here to view this movie.

Movie 2. 4D time lapse sternal BM two-photon and OPO microscopy at day 39 post transplant Co 3FPs (Cerulean – white, Venus – yellow, tdTomato – magenta) bone (SHG in white). Note several static clones marked in yellow or in yellow-magenta combination adjacent to bone in contrast to highly motile individual myeloid progenitor cells. Please click here to view this movie.

Discussion

We describe here the details of a powerful methodology recently devised for clonal cell tracking, combining the large diversity generated by combinatorial marking with 5FP-encoding LeGO vectors and imaging with tandem confocal and 2-photon microscopy to achieve volumetric and dynamic imaging in live tissues. This extended the use of FP-based color marking by recording confocal spectral identity in 5 “distinct” 8-bits channels. Thus the relative ratio of Cerulean, EGFP, Venus, tdTomato, mCherry within each cell creates a unique “colorprint” for identification of clonal progeny. The multicolor labeling by 5FPs increases the label palette with more diversity, which was shown particularly useful when studying the distribution, contacts, tiled arrangements and competitive interactions among cells or group of cells of the same type in dense tissue samples. Combined with 2-photon excitation of intrinsic structural features of various tissues and organs, we can track color marked clonal cells in their native environment without the need for fixation and physical sectioning. The demonstration that daughter cells derived from individual progenitors retain a distinctive “color-print” despite differentiation and proliferation was demonstrated in our published study, with hundreds of differentiated cells found in individual in vitro colonies (CFU) showing the same “colorprint.”

This approach combines the benefits of single-cell resolved high resolution imaging together with optical sectioning via confocal microscopy. Very large x – y (mm2) regions of the intact dense tissue volume can be examined by generating tiled-images. These high resolution images from optical sections can be used to computationally reconstruct (automatically and “on-the-fly”) complete 3D volumes of great complexity to depths of ~ 30 μm, comprising ~ 20-30 layers of cells, vascular, bone and collagen structures. 3D reconstructions can be used for morphometric non-invasive quantitative analyses of biologic interest. One important caveat to point out is that large volume/high resolution imaging is time-consuming, for instance 1 hr per ~1 mm3 of tissue (one fossae of the sternum), therefore we recommend imaging no more than 1 mouse per experiment per day when bone marrow as well as different tissues need to be examined in detail.

Although it is currently technically impossible to image the sternal bone marrow in the same mouse repeatedly over time, valuable information can be obtained by studying individual mice at different time points from a cohort originally transplanted with the same population of LeGO-transduced Lin- cells. The sternum is an excellent location to study bone marrow regeneration due to its early and complete hematopoietic reconstitution, stability, easy sectioning, reproducibility, and large volume. It is critical to reach close to 50% transduction efficiency of Lin- cells for each individual FP vector, before proceeding with a transplantation and imaging experiment, in order to have sufficient color diversity and FP-expressing cells to make the experiment informative. There will always be a caveat that more than one clone may by chance end up with similar or identical colorprints, particularly if transduction is inefficient and many cells have only one or two insertions. It is also important to be confident that each individual tail vein injection delivered close to 100% of the cell dose.

This proves the feasibility of high-resolution 4D live dynamic studies by combining resonant scanning multiphoton and confocal time-lapse imaging. It allows not only static characterization of various clones but also analysis of kinetic differences among cells marked by same color. Moreover demonstrates video-rate 4D imaging of three FPs labeled samples employing successfully in tandem TiSa and OPO lasers for higher efficiency, less harmful, deeper penetration of live tissue, paving the way for 2-photon intravital imaging. In addition, establishes a valuable option to track cells over prolonged periods (months) overcoming current dye-based limitations. This approach uses commercially available confocal and two-photon laser microscope and automated user-interactive image analysis methods based on a commercially available software package allowing easy implementation in usual microscopy facilities.

Finally, this methodology is not limited to the analysis of HSPCs. Many biologic systems could benefit from the ability to resolve spatiotemporal arrangements of clonally complex cellular and structural elements via multicolor labeling and confocal and 2-photon imaging. Organ regeneration, immune responses, and tumor metastatic patterns could be interrogated, to suggest just a few potential applications.

Disclosures

The authors have nothing to disclose.

Acknowledgements

This work was supported by the Intramural Research Program of the National Heart, Lung, Blood Institute of the National Institutes of Health. We thank Boris Fehse (University Medical Center Hamburg-Eppendorf, Hamburg, Germany) for providing the five LeGO vector plasmids; Christian A. Combs and Neal S. Young (NHLBI, NIH) for discussions, support and encouragement throughout this study, and Andre LaRochelle (NHLBI, NIH) for assistance with tail vein injections.

Materials

Production of viruses
LeGO-Cer2 Addgene 27338 Expression of Cerulean
LeGO-G2 Addgene 25917 Expression of eGFP
LeGO-V2 Addgene 27340 Expression of Venus
LeGO-T2 Addgene 27342 Expression of tdTomato
LeGO-C2 Addgene 27339 Expression of mCherry
Calciumm Phosphate Transfection Kit Sigma CAPHOS-1KT
Tissue culture dish BD Falcon 353003
IMDM Gibco, Life Technology 12440-053
Fetal Bovine Serum Heat Inactivated Sigma F4135-500ML
Pen Strep Glutamine Gibco, Life Technology 10378-016
Centrifuge Tubes Beckman Coulter 326823
SW28 Ultracentrifuge Beckman Coulter L60
Millex Syringe Driven Filter Unite (0.22um) Millipore SLGS033SS
Mouse cell collection, purification, transduction and transplantation
ACK lysing buffer Quality Biologicals Inc. 118-156-101
Lineage Cell Depletion Kit (mouse) Miltenyi Biotec Inc. USA 130-090-858
LS columns + tubes Miltenyi Biotec Inc. USA 130-041-306
Pre-Separation Filters (30um) Miltenyi Biotec Inc. USA 130-041-407
StemSpan SFEM serum-free medium for culture and expansion of hematopoietic cells (500mL) StemCell Technologies Inc  9650
murine IL-11 CF R & D Systems Inc 418-ML-025/CF
recombinant murine SCF RDI Division of Fitzgerald Industries Intl  RDI-2503
recombinant murine IL-3 R & D Systems Inc 403-ML-050
FLT-3 Ligand Miltenyi Biotec Inc. USA 130-096-480
12-well plates, Costar Corning Inc. 3527
Retronectin Takara Bio Inc T100A/B
Protamine Sulfate Sigma P-4020
Confocal and two-photon microscopy
DMEM Lonza 12-614F
1M Hepes Cellgro, Mediatech Inc. 25-060-CI
Glass bottom culture dish P35G-0-20-C MatTek Corporation P35G-0-20-C
Glass bottom culture dish P35G-0-14-C MatTek Corporation P35G-0-14-C
Nunc Lab-Tek Chambered Coverglass #1 Borosilicate coverglass; 4-well Thermo Scientific 155383
Leica TCS SP5 AOBS five channels confocal and multi-photon microscope Leica Microsystems
Chameleon Vision II -TiSaph laser range 680-1080nm Coherent
Chameleon Compact OPO laser range 1030-1350nm Coherent
HCX-IRAPO-L 25x/0.95 NA water dipping objective (WD=2.5 mm) Leica Microsystems
HC-PLAPO-CS 20x/0.70 NA dry objective (WD=0.6 mm) Leica Microsystems
HC-PL-IRAPO 40x/1.1NA water immersion objective (WD=0.6 mm) Leica Microsystems
Imaris software version 7.6 Bitplane

References

  1. Lo Celso, ., C, D. T., Scadden, The haematopoietic stem cell niche at a glance. J Cell Sci. 124, 3529-3535 (2011).
  2. Lo Celso, C., et al. Live-animal tracking of individual haematopoietic stem/progenitor cells in their niche. Nature. 457, 92-96 (2009).
  3. Takaku, T., et al. Hematopoiesis in 3 dimensions human and murine bone marrow architecture visualized by confocal microscopy. Blood. 116, e41-e55 (2010).
  4. Malide, D., Metais, J. Y., Dunbar, C. E. Dynamic clonal analysis of murine hematopoietic stem and progenitor cells marked by 5 fluorescent proteins using confocal and multiphoton microscopy. Blood. 120, e105-e116 (2012).
  5. Weber, K., Mock, U., Petrowitz, B., Bartsch, U., Fehse, B. Lentiviral gene ontology (LeGO) vectors equipped with novel drug-selectable fluorescent proteins new building blocks for cell marking and multi-gene analysis. Gene Ther. 17, 511-520 (2010).
  6. Weber, K., Bartsch, U., Stocking, C., Fehse, B. A multicolor panel of novel lentiviral ‘gene ontology’ (LeGO) vectors for functional gene analysis. Mol Ther. 16, 698-706 (2008).
  7. Weber, K., et al. RGB marking facilitates multicolor clonal cell tracking. Nat Med. 17, 504-509 (2011).
  8. Lo Celso, ., Lin, C. P., Scadden, D. T. In vivo imaging of transplanted hematopoietic stem and progenitor cells in mouse calvarium bone marrow. Nature protocols. 6, 1-14 (2011).
  9. Kohler, A., et al. Altered cellular dynamics and endosteal location of aged early hematopoietic progenitor cells revealed by time-lapse intravital imaging in long bones. Blood. 114, 290-298 (2009).
  10. Campagnola, P. J., et al. Three-dimensional high-resolution second-harmonic generation imaging of endogenous structural proteins in biological tissues. Biophys J. 82, 493-508 (2002).
  11. Weigert, R., Sramkova, M., Parente, L., Amornphimoltham, P., Masedunskas, A. Intravital microscopy a novel tool to study cell biology in living animals. Histochem Cell Biol. 133, 481-491 (2010).
  12. Zhang, Y., et al. Mouse models of MYH9-related disease mutations in nonmuscle myosin II-A. Blood. 119, 238-250 (2012).
check_url/51669?article_type=t

Play Video

Cite This Article
Malide, D., Métais, J., Dunbar, C. E. In vivo Clonal Tracking of Hematopoietic Stem and Progenitor Cells Marked by Five Fluorescent Proteins using Confocal and Multiphoton Microscopy. J. Vis. Exp. (90), e51669, doi:10.3791/51669 (2014).

View Video