1. Two-dimensional (2D) Cell Culture
- Commercially obtain tumor cell line HCC827 (DSMZ). Culture the lung adenocarcinoma cell line HCC827 (EGFR mutated, KRAS wild-type) in RPMI-1640 supplemented with 20% FCS. Change medium every 2 – 3 days. Split the cells twice a week. Cells are used until passage 20 is reached.
- Commercially obtain tumor cell line A549 (DSMZ). Culture the lung carcinoma cell line A549 (EGFR wild-type, KRAS mutated) in RPMI-1640 supplemented with 10% FCS. Perform the culture as stated above. Cells are used until passage 20 is reached.
- Test the cells regularly (every 4 – 6 weeks) for contaminations such as mycoplasma contaminations.
- Culturing A549 or HCC827 cells on glass coverslips
- Place 1 sterile glass coverslip in each well of a 24-well plate using a tweezer.
- Seed 50,000 tumor cells of both cell lines in a volume of 500 µl in the wells with the glass coverslips, respectively.
- Culture the cells until they reach a confluency of 70% under standard culture conditions (37 °C; 5% CO2). During this time, aspirate the old medium using a Pasteur pipette and add 500 µl fresh medium every 2 – 3 days of culture.
2. Generation of Tumor Test Systems on a Biological Collagen Scaffold
- Static Culture Conditions
- Generate the decellularized small-intestine-submucosa + mucosa (SISmuc) and fix it between two metal rings, the so-called cell crowns, as described in a previous publication25.
- Seed 100,000 cells of either HCC827 or A549 cells in a total volume of 500 µl onto the side of the former lumen of the gut fixed in cell crowns.
- Allow tumor cells to adhere for 2 hr at 37 °C, 5% CO2. Add 1 ml medium inside the cell crown and 1 ml outside.
- Culture the tumor model under static conditions at 37 °C, 5% CO2 in the incubator for 14 days. Change culture medium every 2 – 3 days. Therefore, aspirate the medium using a Pasteur pipette and pipette 1 ml fresh RPMI with the appropriate amount of FCS (A549: 10%, HCC827: 20%) inside the cell crown and 1.5 ml of the same medium outside.
- Dynamic Culture Conditions
- Set up the tumor test system with the decellularized matrix inside the cell crowns and cell seeding as described under subsection 2.1.1 to 2.1.3.
- Culture the tumor model under static conditions 37 °C, 5% CO2 in the incubator for 3 days.
- Assemble the autoclaved bioreactor and insert the seeded SISmuc as published previously 25.
- Pipette 45 ml RPMI with the appropriate amount of FCS (A549: 10%, HCC827: 20%) into the flask and connect the needle-free sampling device to the tubing system between the bioreactor and the medium flask.
- Place the bioreactor in the incubator, connect it to the pump and culture the tumor model for additional 14 days with a constant medium flow (3 ml/min) at 37 °C, 5% CO2.
- Change the entire culture medium after 7 days. For that, move the bioreactor from the incubator under a laminar flow hood. Aspirate the medium in the media flask using a Pasteur pipette. Lift up the bioreactor while aspirating to get rid of the medium in the tubing system. Pipette 45 ml fresh medium into the flask. Place the bioreactor back into the incubator and connect it to the pump.
3. Treatment of the Static Tumor Model with Gefitinib
- Culture the tumor model as described in section 2.1.
- At day 11 of culture, prepare RPMI/FCS with 1 µM gefitinib (2.5 ml for each cell crown). Aspirate the old medium from the wells using a Pasteur pipette and add 1 ml of prepared RPMI/FCS/gefitinib inside the cell crown and 1.5 ml of the same medium outside.
NOTE: The thawed gefitinib stock solution can be stored at 4 °C for one week. - Change the medium at day 13 as described under subsection 3.2.
4. Stimulation of the Static Tumor Model with TGF-beta-1 for EMT Induction
- Culture the tumor model as described in section 2.1.
- At day 3 of culture, prepare RPMI/FCS with 2 ng/ml TGF-beta-1 with carrier (2.5 ml for each cell crown). Aspirate the old medium from the wells using a Pasteur pipette and add 1 ml of prepared RPMI/FCS/TGF-beta-1 inside the cell crown and 1.5 ml of the same medium outside. Change medium supplemented with TGF-beta-1 every 2 – 3 days until day 14, as described under 4.2.
5. Read-outs
- Taking Samples for ELISA Measurements
- Take samples from the supernatants of static (section 2.1) and dynamic (section 2.2) culture during treatment with gefitinib (section 3) at days 11-14 of culture as indicated in Figure 2. Additionally, take a sample prior to treatment (T0).
- Under static culture conditions, take 100 µl sample from the inside of the cell crown. Under dynamic culture conditions, screw the syringe on the sampling device and take 1 ml medium out of the bioreactor system. Store all collected supernatants at -80 °C until the ELISA is performed.
- M30-ELISA for Apoptosis Quantification
- To quantify the apoptosis in the supernatants perform the cell death assay according to manufacturer's instructions. Allow all reagents to reach RT before performing the assay.
- Vortex all reagents. Dissolve the wash tablet in 500 ml fresh deionized water. Dilute HRP Conjugate with 9.2 ml of Conjugate Dilution Buffer and mix. Pipette 25 µl of standard or sample per well.
- Add 75 µl of the diluted HRP Conjugate solution per well. Cover the plate and incubate it on a shaker for 4 hr at RT. Wash the plate manually, 5 times with 250 µl of prepared wash solution.
- Add 200 µl of 3,3',5,5'-Tetramethylbenzidine (TMB) substrate to each well. Incubate in darkness at RT for 20 min. Add 50 µl of stop solution to each well. Shake the microplate for 10 sec and leave the microplate for 5 min before reading the absorbance. Determine the absorbance at 450 nm in a microplate reader. Calculate the standard curve and the concentrations in the samples using a suitable program for handling ELISA type data such as Origin.
- Sample Staining
- Fixing, Paraffin-embedding and Section Preparation of the 3D Model
- Fix the seeded SISmuc using 2.5 ml 4% paraformaldehyde (PFA) per cell crown for 2 hr and embed it into paraffin
- Prepare 3 µm tissue sections for staining as published previously 25.
- Fixing of Cells Grown in 2D Culture Conditions
- When 70% confluence is reached, wash cells cultured on glass coverslips in 24-well plate once with PBS and fix them with 500 µl 4% PFA/well for 10 min.
- Remove PFA and store the glass coverslips in the well-plate covered with PBS at 4 °C until staining is performed.
- H&E Staining
- Stain the rehydrated sections with Hematoxylin/Eosin as an overview staining according to standard protocols.
- Immunofluorescent Staining of the 3D Model
- For immunofluorescent staining, perform an antigen retrieval by placing the deparaffinized and rehydrated slides into a steam cooker with preheated citrate buffer (pH 6.0) for 20 min.
NOTE: See table of Material and Equipment's for preparing of citrate buffer. - Transfer the slides to the washing buffer (0.5 M PBS buffer + 0.5% Tween), circle sections with a PAP pen to minimize the required volume for staining solutions and place the slides in a moisture chamber.
- Block tissue sections with 5% serum from the host species of the secondary antibodies used in subsection 5.3.4.6 for 20 min at RT.
- Remove blocking serum by gently tapping the slides to a paper tissue and apply the primary antibody to the encircled sections in a dilution according to the manufacturer's instruction (rabbit anti Ki67 1:100, rabbit anti vimentin 1:100, mouse anti pan-cytokeratin 1:100). Incubate O/N at 4 °C. For double-staining, primary antibodies from different host species must be used.
- Carefully wash off unbound antibody with washing buffer three times for 5 min.
- For detection of specific antigen-antibody bindings, apply secondary antibodies in the dilution 1:400 to the sections and incubate at RT for 1 hr.
- Wash off unbound antibody with washing buffer three times for 5 min.
- Mount the slides with an aqueous medium containing DAPI to counterstain nuclei and let them dry O/N.
- For immunofluorescent staining, perform an antigen retrieval by placing the deparaffinized and rehydrated slides into a steam cooker with preheated citrate buffer (pH 6.0) for 20 min.
- Immunofluorescent Staining of 2D Cultured Cells
- Remove PBS and cover the seeded glass cover slips with 0.2% Triton-X100 in PBS for 5 min for permeabilization. Wash the glass cover slips with washing buffer (0.5 M PBS buffer + 0.5 % Tween) for 5 min.
- Perform steps 5.3.4.3 to 5.3.4.7. Execute all steps in the well-plate on a rocking platform and remove reagents by inverting the plate.
- For mounting, spot a drop of aqueous medium containing DAPI to counterstain nuclei onto an uncoated glass slide and transfer the cover slip to it with the cells facing the mounting medium using forceps. Let it dry before imaging.
- Fixing, Paraffin-embedding and Section Preparation of the 3D Model
- Determination of Proliferation Index
- Perform immunofluorescent staining against Ki67 according to section 5.3.4. or 5.3 5.
- Take fluorescent images of the tissue sections or 2D cultured cells with an inverted microscope. Use different filters for taking images of DAPI stainings and of Ki67 stainings. For the quantification, use 10 images of 3D sections or 5 images of 2D cultures (magnification 20X) of each condition from non-overlapping parts of the specimen.
- Determine number of nuclei and number of nuclei positive for Ki67 in 2D
- Count Ki67 positive nuclei manually using the plugin cell counter of the software Fiji 26. Therefore, open the image and click "Plugins" → "Analyze" → "Cell Counter". Press "Initialize" and select a counter type. Click on each Ki67 positive nucleus. The number of clicks is shown next to the selected counter type.
- For automatic cell counting of the total number of nuclei create a macro using Fiji 27,28. Adjust the macro for every staining and cell line. Following, see an example how to create a macro.
- Start macro recorder. Open a DAPI-image and convert it to 8 bit format by clicking "Image" → "Type" → "8-bit". Click "Enhance contrast", set 'saturated' as "1" and "normalize".
- Set "unsharp mask" to sharpen the image. Use a 'radius' of "1" and a 'mask' of "0.60". Click "auto threshold", choose method "RenyiEntropy" with 'white objects on black background' to binarise the image.
- Click "Plugins" → "BioVoxxel" → "watershed irregular features" with an erosion radius of "5" to separate the cells. Click "Analyze" → "Analyze Particles" and set the 'size' to "0.02-Infinity".
NOTE: The number of particles/cells is shown in the summary table as counts. - Click "Create" to save macro for the analysis of further images.
- Determine number of nuclei and number of nuclei positive for Ki67 in 3D manually as described in subsection 5.4.3.1.
- Calculate the mean proliferation index (PI) according to the following formula:
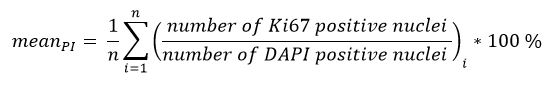
n = number of images (3D: 10, 2D: 5)
6. In Silico Tumor Model Generation and Simulation of Anti-EGFR Therapy in HCC827 Cells
- Network Generation using a Network Analysis Software
- Use different known databases to generate the tumor network based on the important experimental read-out parameters and the mutational background of the HCC827 cell line.
- Open the network analysis software 21 to visualize the network.
- Click "File" → "New" → type 'JoVE_tumor models' → click "OK" to generate a new network. Click "Square Closeup North" → "OK" to visualize the receptor in a double membrane. Click "Generic Protein" to visualize nodes (=proteins) as rectangles → type 'EGFR' → click "OK"; repeat this for each node in the network.
- Label the nodes in the network: Right click → "Change Color & Shape…" → select for nodes EGFR and (EGF-EGFR) color code "255,0,0" (color red); for nodes c-MET and (c-MET) color code "0,255,0" (color green); for gefitinib color code "255,255,0" (color yellow); for PI3K-Inh color code "204,204,204" (color light grey); for MEK-Inh color code "102,102,102" (color dark grey); for all other nodes in the network select color code "255,255,255" (color white).
- Click "Phenotype" to visualize read-out parameters as hexagons → type 'proliferation' → click "OK" → Right click → "Change Color & Shape…" → select color code "255,204,204" (color salmon); repeat this for parameter apoptosis → select color code "255,51,204" (color violet).
- Visualize Edges (= interactions): Click "State Transition" for activations (arrows), Click "Inhibition" for inhibitions (blunted arrows); repeat this for each interaction in the network.
- Click "File" → "Save As…" → type 'JoVE_tumor models.xml' → click "Save" to save the generated signaling network as .xml format.
- In Silico Simulation using SQUAD
NOTE: SQUAD represents the network topology as a discrete logical Boolean system (AND, OR, NOT) and performs a steady state analysis. The steady state analysis reflects the system equilibrium and the responsibility upon signaling stimuli (e.g., drug application or mutation).- Open SQUAD 17 software, Click "Load Network" → upload 'JoVE_tumor models.xml' file. Click "Run analysis":
NOTE: Next, SQUAD applies exponential function to interpolate the Boolean network connectivity, which allows dynamic simulation of the network behavior over time (colored sigmoid activity curves). - Click "Advanced" → "Perturbator" to write a simulation protocol. Simulate anti-EGFR resistance: Click "Edit Protocol"
- Click "perturbation" → use standard "initialstate=SS-4" (steady state 4) → Click "Add" to add 'new Constant Pulse' → Select parameter "state" → Select target "FLIP" → Select time "0" → Select value "0.4" → Click "OK".
- Repeat this: Click "Add" → Select parameter "state" → Select target "c-MET" → Select time "0" → Select value "0.4" → Click "OK"; Click "Add" → Select parameter "state" → Select target "gefitinib" → Select time "0" → Select value "1" → Click "OK".
- Set a state value to active node (EGF-EGFR): Click "activenode" → Click "Edit" → Select state "0.8" → Click "OK"; for all other nodes: Click "Edit" → Select state "0" → Click "OK". Click "OK" to save the protocol.
- Display specific curves: Go to panel "Options" → Select "(EGF-EGFR)", "*(EGF-EGFR)", "*MEK", "caspases", "(c-MET)", "PI3K", "gefitinib", "apoptosis", "proliferation", "MEK-Inh" and "PI3K-Inh" for graphical representation. Click "Initialize" → "Run" to start a complete simulation of the system's response. Click "Reset" to start a new simulation.
- Simulate combined PI3K and MEK inhibitor treatment: Click "Edit Protocol"
- Use same node parameter as described under 6.2.2.1 – 6.2.2.3. Click "perturbation" → Click "Add" to add 'new Constant Pulse' → Select parameter "state" → Select target "PI3K-Inh" → Select time "0" → Select value "1" → Click "OK"; Click "Add" to add 'new Constant Pulse' → Select parameter "state" → Select target "MEK-Inh" → Select time "0" → Select value "1" → Click "OK".
- Click "OK" to save the protocol. Go to panel "Options": Use same nodes for graphical representation as described under 6.2.2.4. Click "Initialize" → "Run" to start a complete simulation of the system's response. Click "Reset" to finish the simulation.
- Open SQUAD 17 software, Click "Load Network" → upload 'JoVE_tumor models.xml' file. Click "Run analysis":
On the basis of the SISmuc scaffold (Figure 2A to C), we established a standardized operating protocol for the generation, stimulation and treatment of a 3D tumor test system (Figure 2D). This model enables the determination of the proliferation index and the quantification of apoptosis using M30-ELISA as shown in Figure 1 and Figure 3, respectively. Figure 3 shows representative H&E staining of A549 and HCC827 models and one representative apoptosis measurement with gefitinib. The here presented model is designed using the example of EGFR-mutated NSCLC which is successfully treated with targeted inhibitors in the clinic. Correspondingly, only the EGFR-mutated HCC827 cells and not the A549 cells respond to EGFR inhibition by the TKI gefitinib in our model as evaluated by the increase of apoptosis. Figure 4 shows one representative staining of our models after stimulation with the EMT inducer TGF-beta-1. Dynamic culture conditions in a flow-bioreactor enhanced tissue generation as shown in Figure 5C and D. Also under dynamic culture conditions gefitinib has a strong effect on EGFR-mutated HCC827 (Figure 5D).
Figure 6 shows the network topology (Figure 6A) and detailed in silico simulations of anti-EGFR therapy resistance in HCC827 cells (Figure 6B, C). The signaling network was generated using known literature databases such as HPRD, KEGG and QIAGEN (Genes & Pathways), resulting in a topology of 42 nodes and 55 edges, visualized with CellDesigner software 26. The simulation of known driver mutation EGFR (in red) and c-MET co-activation (in green, value around 0.7) shows an increased proliferation rate (salmon curve) and a decreased apoptosis rate (violet curve) over time reflecting gefitinib (in yellow) resistance in HCC827 cells going along with an activation of MEK and PI3K (Figure 6B, dark green and cyan). Modelling of combined PI3K and MEK inhibitor (dark and light grey curves) results in a reversion of the anti-EGFR resistance effect, reduces proliferation and induces apoptosis (Figure 6C).
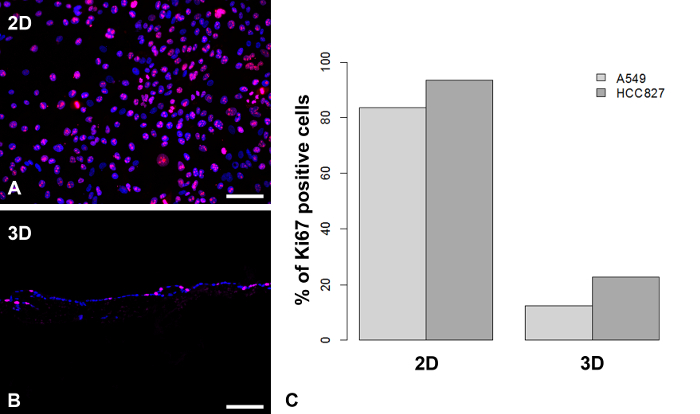
Figure 1. Proliferation Rate is Reduced in 3D Compared to 2D Cell Culture. Ki67-positive HCC827 cells (red in A and B) were stained in 2D cell culture (A) and 3D cell culture on SISmuc (B). HCC827 cells and A549 cells were counted and the proliferation index (percentage of Ki67 positive cells) was determined (C, one representative counting out of five). Scale bars in A and B: 100 µm. Please click here to view a larger version of this figure.
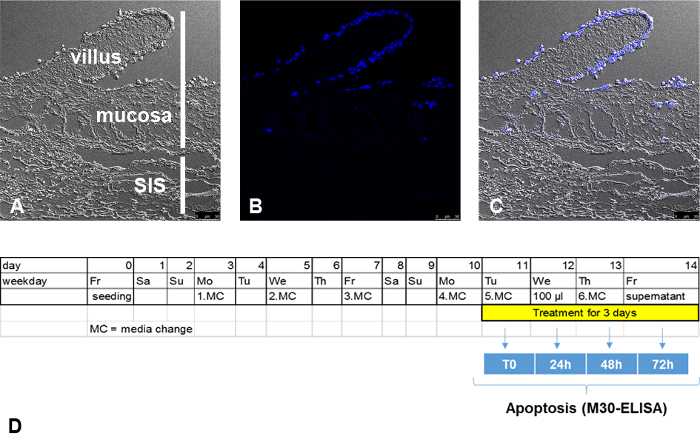
Figure 2. SISmuc Scaffold Morphology and Treatment Schedule with the TKI Gefitinib. Cells are seeded on the SISmuc which consists of small intestine submucosa (SIS) + mucosa (A: brightfield, B: DAPI stained cells on top of the SISmuc, C: overlay of A and B) and is fixed in cell crowns at day 0. The treatment scheme is shown in D: Medium changes (MC) are performed every 2 to 3 days. At day 11 the treatment starts. Supernatants are collected and used for M30-ELISA in order to quantify apoptosis over time (Blue arrows and boxes). Please click here to view a larger version of this figure.
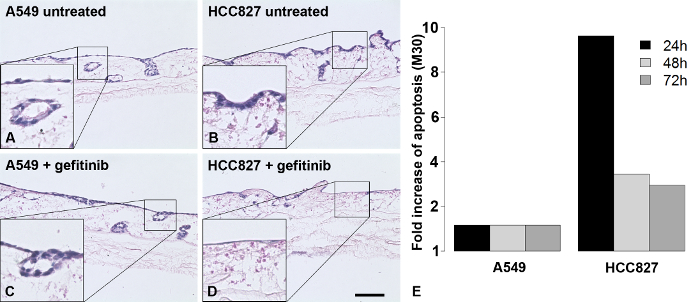
Figure 3. Gefitinib Treatment Changes Cell Growth on the SISmuc and Induces Apoptosis in HCC827, But Not in A549 3D Tumor Models. Without any treatment, both cell lines form a monolayer on the SISmuc (A and B) and also settle former crypt structures. While the growth pattern of A549 cells is not changed after treatment with gefitinib (C), the number of HCC827 cells is reduced accompanied by a change to an elongated cell shape (D). Apoptosis is induced by gefitinib in HCC827 models as seen by M30-ELISA measurements from culture supernatants (E, one representative measurement out of five). Scale bar in D: 100 µm for A to D. Please click here to view a larger version of this figure.
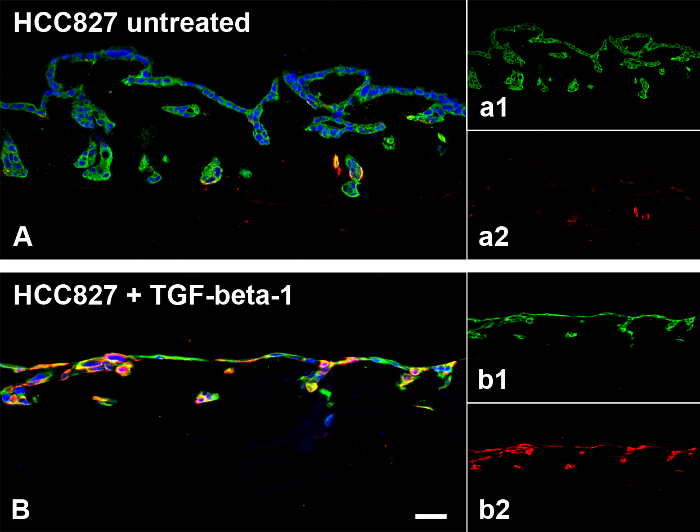
Figure 4. TGF-beta-1 Induces EMT in HCC827 Cells on the SISmuc. HCC827 cells cultured in 3D show overall expression of pan-cytokeratin (PCK) (green in A, a1) but only single cells express vimentin (red in A, a2). After TGF-beta-1 stimulation, cells change their morphology to an elongated shape and the expression of vimentin is strongly increased (red in B, b2), whereas the expression of PCK is maintained (green in B, b1). Scale bar in B: 100 µm for A and B. Please click here to view a larger version of this figure.
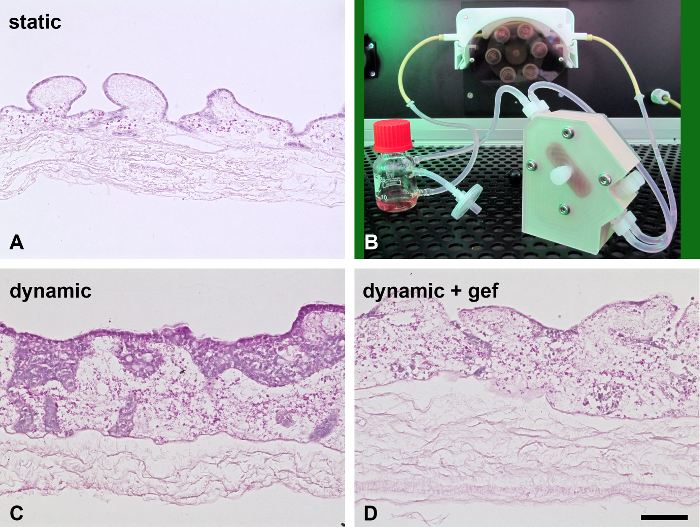
Figure 5. Dynamic Cell Culture Enhances Tissue Generation. When cultured under 3D conditions in a bioreactor (B), the monolayer from the static model (A, H&E staining) changes from a monolayer (A) to a multilayered tissue (C, H&E staining). HCC827 cells show a strong drug response upon gefitinib treatment (D, H&E staining). Scale bar in D: 100 µm for A, C, and D. Please click here to view a larger version of this figure.
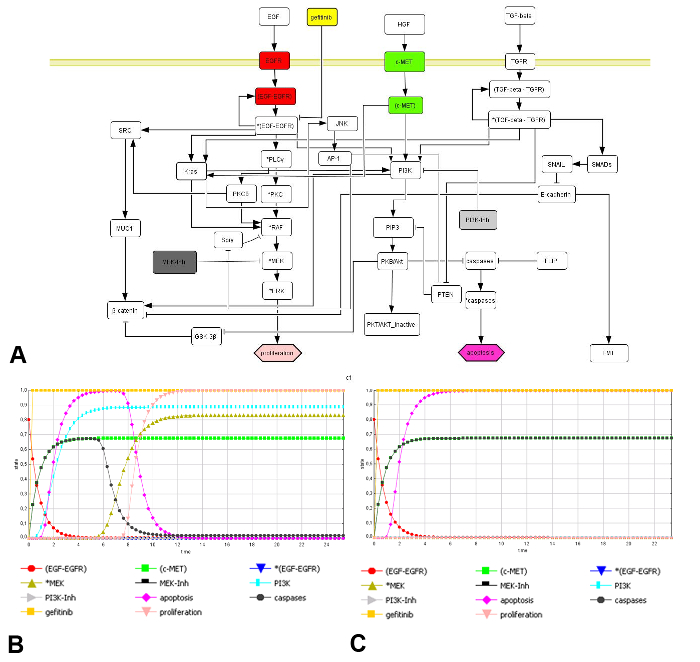
Fig. 6. In Silico Tumor Model Generation and Simulation of Anti-EGFR Therapy Resistance. Network topology of a tumor cell with key signaling nodes in red (EGFR pathway) and green (c-MET) and their downstream nodes. The characteristic tumor read-out parameters proliferation (in salmon) and apoptosis (in violet) are represented as hexagon. Arrows indicate activation, blunted arrows inhibition. Therapeutic targets are represented by dark and light grey rectangles, the inhibition by gefitinib is shown in yellow (A). Dynamical simulation by e-functions (colored curves) interpolate the Boolean network connectivity (AND, OR, NOT). EGFR and c-MET co-expression causes gefitinib resistance as indicated by an increase of proliferation (salmon curve) and a decrease of apoptosis (violet curve) after about arbitrary time point 8 (B). Potential therapy tackles both PI3K and MEK by inhibitors (under yellow curve; same activation, see protocol) (C). Please click here to view a larger version of this figure.
