An Integrated Platform for Genome-wide Mapping of Chromatin States Using High-throughput ChIP-sequencing in Tumor Tissues
Summary
Here, we describe an optimized high-throughput ChIP-sequencing protocol and computational analyses pipeline for the determination of genome-wide chromatin state patterns from frozen tumor tissues and cell lines.
Abstract
Histone modifications constitute a major component of the epigenome and play important regulatory roles in determining the transcriptional status of associated loci. In addition, the presence of specific modifications has been used to determine the position and identity non-coding functional elements such as enhancers. In recent years, chromatin immunoprecipitation followed by next generation sequencing (ChIP-seq) has become a powerful tool in determining the genome-wide profiles of individual histone modifications. However, it has become increasingly clear that the combinatorial patterns of chromatin modifications, referred to as Chromatin States, determine the identity and nature of the associated genomic locus. Therefore, workflows consisting of robust high-throughput (HT) methodologies for profiling a number of histone modification marks, as well as computational analyses pipelines capable of handling myriads of ChIP-Seq profiling datasets, are needed for comprehensive determination of epigenomic states in large number of samples. The HT-ChIP-Seq workflow presented here consists of two modules: 1) an experimental protocol for profiling several histone modifications from small amounts of tumor samples and cell lines in a 96-well format; and 2) a computational data analysis pipeline that combines existing tools to compute both individual mark occupancy and combinatorial chromatin state patterns. Together, these two modules facilitate easy processing of hundreds of ChIP-Seq samples in a fast and efficient manner. The workflow presented here is used to derive chromatin state patterns from 6 histone mark profiles in melanoma tumors and cell lines. Overall, we present a comprehensive ChIP-seq workflow that can be applied to dozens of human tumor samples and cancer cell lines to determine epigenomic aberrations in various malignancies.
Introduction
The majority of mammalian genomes (98 – 99%) are comprised of noncoding sequence, and these nocoding regions contain regulatory elements known to participate in controlling gene expression and chromatin organization1,2. In a normal cell, the specific assembly of genomic DNA into compacted chromatin structure is critical for the spatial organization, regulation and precise timing of various DNA-associated processes3,4,5. In a cancer cell however, chromatin modifications by aberrant epigenetic mechanisms can lead to improper organization of chromatin structure, including access to regulatory elements, chromosomal looping systems, and gene expression patterns6,7,8,9,10.
Despite recent advances, we have limited understanding of epigenetic alterations that are associated with tumor progression or therapeutic response. The epigenome consists of an array of modifications, including histone marks and DNA methylation, which collectively form a dynamic state (referred to as chromatin state) that impinges upon gene expression networks and other processes critical for maintaining cellular identity. Recently, alterations in enhancers have been shown in multiple malignancies by studying H3K27Ac profiles11. Although such studies provide insight into the correlation of isolated epigenetic marks, more than 100 epigenetic modifications have been identified12,13 without clear understanding of their biological roles and interdependence. Furthermore, there are an even larger number of possible combinatorial patterns of these histone and DNA modifications, and it is these combinatorial patterns – not individual modifications – that dictate epigenetic states14. Hence, there is tremendous need to identify alterations in these chromatin states during cancer progression or responses to therapy. Comprehensive knowledge of epigenome alterations in cancers has been lagging in part due to technical (e.g. generation of large-scale data from small amount of clinical material/single cells) and analytical (e.g. algorithms to define combinatorial states) challenges. Therefore, there is critical need for robust high-throughput methods for profiling large number of histone modification marks from clinical material and easy-to-implement computational approaches to predict combinatorial patterns which will facilitate determination of epigenetic states associated with different stages of tumorigenesis and therapeutic resistance. Further, data available from recent epigenome profiling studies15,16,17,18,19,20,21,22,23 in normal tissues and cell lines can be integrated with chromatin profiles of tumors for further insights into epigenome contribution to tumor biology.
Chromatin profiling has become a powerful tool for identifying the global binding patterns of various chromatin modifications15,24. In recent years, ChIP-seq has become the "gold standard" for studying DNA-protein interactions on a global scale25,26,27. For any ChIP-seq experiment, there are critical steps necessary for its success, including tissue processing and disassociation, determing optimal sonication conditions, determing optimal antibody concentration for precipitation, library preparation, post-sequencing data processing, and downstream analysis. Each of these steps contain key quality control checkpoints, and when taken together, are crucial for properly identifying potential targets for functional validation. Through innovation in these steps, several prior studies have developed methodologies to perform ChIP or ChIP-Seq from small amount of tissues28,29,30,31,32. Further, some studies have suggested protocols for high-throughput ChIP experiments followed by PCR based quantitation33,34. Finally, some publically available analysis platforms for ChIP-Seq data are now available such as Easeq35 and Galaxy36. However, an integrated platform for performing ChIP-Seq in a high-throughput fashion in combination with a computational pipeline to perform single mark as well as chromatin state analyses has been lacking.
This protocol describes a complete and comprehensive ChIP-seq workflow for genome-wide mapping of chromatin states in tumor tissues and cell lines, with easy to follow guidelines encompassing all of the steps necessary for a successful experiment. By adopting a high-throughput method previously described by Blecher-Gonen et al.37, this protocol can be performed on dozens of samples in parallel and has been applied successfully on cancer cell lines and human tumors such as melanoma, colon, prostate, and glioblastoma multiforme. We demonstrate the methodology for six core histone modifications that represent key components of the epigenetic regulatory landscape in human melanoma cell lines and tumor samples. These modifications include H3K27ac (enhancers), H3K4me1 (active and poised enhancers), H3K4me3 (promoters), H3K79me2 (transcribed regions), H3K27me3 (polycomb repression), and H3K9me3 (heterochromatic repression). These marks can be used either alone or in combination to identify functionally distinct chromatin states representing both repressive and active domains.
Protocol
All clinical specimens were obtained following the guidelines of Institutional Review Board.
1. Buffer Preparation
- Make 200 mL of TE buffer (10 mM Tris-HCl, 10 mM ethylenediaminetetraacetic acid (EDTA) pH 8.0).
- Make 200 mL of STE buffer (10 mM Tris-HCl, 10 mM EDTA pH 8.0, 140 mM NaCl).
- Make 200 mL of 2.0 M glycine (37.52 g of glycine in 200 mL of water) and heat it to 65 °C.
- Make 200 mL of 5% sodium deoxycholate (DOC) solution (10 g of DOC in 200 mL of water).
- Make 500 mL of ChIP harvest buffer (12 mM Tris-Cl, 0.1x phosphate buffered saline (PBS), 6 mM EDTA, 0.5% sodium dodecyl sulfate (SDS)).
- Make 500 mL of ChIP dilution buffer (10 mM Tris-Cl, 140 mM NaCl, 0.1% DOC, 1% Triton-X, 1 mM EDTA).
- Make 500 mL of RIPA wash buffer (STE, 1% Triton x-100, 0.1% SDS, 0.1% DOC).
- Make 500 mL of RIPA/500 wash buffer (RIPA buffer + 360 mM NaCl).
- Make 500 mL of LiCL wash buffer (TE, 250 mM LiCl, 0.5% NP-40, 0.5% DOC).
- Make 500 mL of Direct Elution buffer: 10 mM Tris-Cl pH 8.0, 5 mM EDTA, 300 mM NaCl, 0.5% SDS.
- Make 50 mL of Antibody Binding/Blocking buffer (PBS + 0.1% TWEEN-20 + 0.2% IgG-free BSA).
2. Tissue/cell Line Processing and Cross-linking
- If tissue is flash frozen, dethaw it on ice prior to dissociation.
- Disassociate 50 mg of tissue (~8 mg per histone modification antibody) manually in 2 mL of Hanks' Balanced Salt Solution (HBSS) using a sterile razor blade. Mince the tissue into 3 to 4 mm pieces for approximately 5 min in a sterile tissue culture dish.
- Transfer the tissue and HBSS solution into a dissociator tube and add another 8 mL of HBSS. Further disassociate the tissue using a dissociator until homogenized.
- For melanoma tumors, place the tubes in a dissociator and run the following cycles each one time in this order: h_tumor_01.01, h_tumor_02.01, h_tumor_03.01 and m_heart_02.01.
- Scrape 21 × 106 cells in 10 mL of medium (~3 × 10⁶ per histone modification and input; it can be lowered to 100,000 cells per mark for rare populations) grown in a standard tissue culture dish and collect them in a 15 mL conical tube.
Note: The media used for representative melanoma cell line WM115 is DMEM supplemented with 10% Fetal Bovine Serum and 5% penicillin/streptomycin. - Crosslink the tissue/cells using a 1% final formaldehyde concentration by adding 200 µL of 16% formaldehyde per 3 mL HBBS for tissue (or 3 mL of medium for cells). Shake the mixture at 10 rpm using a mixer for exactly 10 min at 37 °C.
Caution: Formaldehyde is toxic and should be handled in an appropriate fume hood. - Add 200 µL of 2.0 M glycine per 3 mL of sample and continue shaking at 10 rpm for another 5 min at 37 °C.
NOTE: Glycine acts as a quencher. Make fresh glycine solution every month as the pH pf the solution tends over time. - Spin the samples at 934 x g for 5 min at 4 °C using a benchtop centrifuge. Remove the supernatant, add 5 mL of ice cold PBS, centrifuge the samples again at 934 x g and remove the supernatant.
- Flash freeze the pellet and store it at -80 °C for further processing.
3. Tissue Lysis, Sonication, and Antibody Preparation
- Dissolve 1 protease inhibitor tablet per 10 mL of ChIP harvest buffer.
- Add 300 µL of ChIP harvest buffer with protease inhibitors per 50 mg of tissue and allow 30 min of lysis on ice.
NOTE: Add 300 µL of ChIP harvest buffer with protease inhibitors per 1 X 10⁷ of WM115 melanoma cell lines. - While the cells are lysing, turn on the the waterbath disruptor and associated cooling system and allow temperature to reach 4 °C. Place the sonicator tubes in the waterbath disruptor and sonicate the melanoma tissues for 60 cycles at 30 s on and 30 s off to obtain chromatin fragments of ~200 – 600 base pairs (bp).
NOTE: Sonication time can differ between tissue type and should be adjusted accordingly. This is a critical step and should be optimized in pilot experiment before proceeding to immunoprecipitation. - During sonication, wash 20 µL of protein G magnetic beads per antibody per sample three times using 1000 µL of binding/blocking buffer (PBS + 0.1% TWEEN-20 + 0.2% BSA).
- For ~8 mg of melanoma tissue, incubate 3 µg of each histone antibody in 100 µL of binding/ blocking buffer for 2 h at 4 °C with rotation using a tube revolver. 12 samples for a singular antibody contain 240 µL of beads, 36 µg of antibody and 1200 µL of binding/blocking buffer.
NOTE: For 3 × 10⁶ cells, use 5 µg of each antibody and 30 µL of Protein G magnetic beads per antibody. Antibody and Protein-G beads should be titrated if different amount of tissue is being used. This protocol illustrates immunoprecipitation conditions for the described six histone modifications (Table of Materials), however, antibody concentrations should be optimized for other modifications and transcription factors. - To determine fragment size, remove 20 µL of sonciated chromatin solution and add an elution buffer master mix (room temperature) containing 44 µL of direct elution buffer, 1 µL of RNase (20mg/mL), and 5 µL Proteinase K (20mg/mL) per sample. Incubate the samples in a PCR thermal cycler for at least 2 h at 50 °C. Purify the sample using a PCR purification kit following the manufacturers instructions.
- Ensure chromatin is sufficiently sheared by determining fragment size using a high sensitivity DNA electropherogram instrument before proceeding to step 3.6. Turn on the electropherogram instrument.
- Load 2 µL of high sensitivity buffer reagent into each well of an 8-well optical tube strip. Load 2 µL of high sensitivity ladder into the first well and 2 µL of purified samples in the remaining wells.
- Place optical tube caps on tube stips and vortex the samples at 2000 rpm for 1 min. Open the lid and insert a new high sensitivity screen tape and box of loading tips. Remove the strip caps and load the samples into electropherogram instrument.
- Open analysis software, highlight the first thirteen spaces on the screen tape and press the Start tab in the bottom right corner. Chromatin fragments ranging between ~200 – 1000 bp are suitable for ChIP.
- Transfer the sonicated solution to sterile tubes and spin the tubes at 21,130 x g using a table top centrifuge for 15 min at 4 °C. Transfer the supernatant to new tubes.
- Determine the total volume of the supernatant and remove 10% of the total solution for Input control and store it at 4 °C.
4. Chromatin Immunoprecipitation
- Dissolve 2 protease inhibitor tablets per 20 mL of ChIP dilution buffer.
- After sonication dilute the remaining sample 5 times using ChIP dilution buffer to bring the SDS levels down to 0.1%. Dilute 270 µL of remaining supernatant with 1080 µL of ChIP dilution buffer to obtain a final total volume of 1350 µL.
- When the incubation of antibody and protein G magnetic beads finishes, place the tube on a magnet and remove the supernatant.
- With the tube still sitting on the magnet, wash the beads once by adding 750 µL of ChIP dilution buffer with protease inhibitors.
NOTE: It is important not to disturb the beads or rotate the tubes during this step. - Remove ChIP dilution buffer wash and resuspend the beads in 240 µL of the same ChIP dilution buffer. Aliquot 20 µL of beads into 12 separate tubes, each of which is used for a separate tissue sample.
- Aliquot the sonicated material evenly to protein G beads with specific antibody and tumble using a tube revolver overnight at 4 °C.
5. Washing and Reverse Crosslinking of Immunoprecipitated DNA-protein Complexes
- The next morning after reverse crosslinking, transfer the antibody-protein solution to a 96-well plate and place it on the magnetic stand. Allow the beads to adhere for at least 30 s and remove the supernatant.
- Wash the beads 5 times with 150 µL of ice-cold RIPA wash buffer using a multi-channel pipet. During the wash steps, do not pipet the beads, but move the magnet continuously from right to left for 30 s per wash.
- Wash the samples twice with 150 µL of ice-cold RIPA-500 wash buffer.
- Wash the samples twice with 150 µL of ice-cold LiCl wash buffer.
- Wash the samples once with 150 µL of ice-cold TE wash buffer and remove TE buffer immediately. This step can be omitted for low input applications.
- Add Input control from step 3.7 into fresh wells of the 96-well plate containing the ChIP DNA samples.
- After the washing steps, add an elution buffer master mix (room temperature) containing 44 µL of direct elution buffer, 1 µL of RNase (20mg/mL) and 5 µL Proteinase K (20mg/mL) per ChIP and Input sample for reverse crosslinking.
- Incubate the samples using a PCR thermal cycler for 4 h at 37 °C, 4 h at 50 °C and 8 – 16 h at 65 °C.
6. Purification and Quantification of Precipitated DNA
- The next morning, place the samples back on the magnet and transfer supernatant to a new 96-well PCR plate which contains the immunoprecipitated DNA.
- Add 2.3x paramagnetic beads to solution (115 µL for 50 µL of solution) and carefully pipet up and down 25 times using a multichannel pipet. The solution will become homogenous if properly mixed.
- Incubate the solution at room temperature off the magnet for 4 min. Place the samples back on the magnet and incubate at room temperature for another 4 min. Discard the supernatant.
- While leaving the samples on the magnet, add 150 µL of 70% ethanol (vol/vol) and incubate at room temperature for 30 s without disturbing the beads.
- Remove the ethanol and repeat the wash. Allow the paramagnetic beads to air dry on the magnet for 5 min.
NOTE: Remove all the ethanol after the second wash as remaining ethanol will interfere with purification. - Remove the samples from the magnet and add 30 µL of 10 mM Tris-Cl pH 8.0. Mix by pipetting 25 times and incubate the samples at room temperature off the magnet for 4 min.
- Place the samples back on the magnet and incubate at room temperature for another 4 min. Transfer 20 µL of each sample to a new 96-well plate for library preparation. Store the remaining 10 µL of ChIP DNA in case of any potential issues with generation of the libraries.
- At this stage, quantify ChIP DNA before library preparation. The DNA concentration is measured with high-sensitivity DNA reagents. Determine the size distribution of precipitated DNA using a high sensitivity DNA electropherogram instrument proceeding to step 7.1.
7. Library Generation using the NEBNext Ultra II DNA Library Preparation Kit
- Generate libraries for NGS sequencing using DNA Library Preparation following the recommended protocol from the manufacturer. All the reactions are performed in 96-well plates and incubations are performed in a PCR thermal cycler with the lid temperature set > 100 °C and the volume set at 50 µL.
- For indexes, Multiplex Oligos for NGS platform are used. Perform a total of 10x cycles for PCR amplification using the following settings: initial denaturation at 98 °C for 30 s, denaturation at 98 °C for 10 s, annealing/extension at 65 °C for 30 s (10x cycles), final extension 65 °C for 5 min and hold at 4°C.
NOTE: Table 1 contains the primers used for PCR amplification. - After PCR amplification, remove the samples and bring total volume to 100 µL using nuclease-free water. Perform double-sided paramagnetic size selection (0.55x/0.8x) by first adding 55 µL of beads and mix by pipetting 25 times. Incubate the samples at room temperature off the magnet for 4 min.
- Place the samples back on a magnet and incubate at room temperature for another 4 min. This step is used to retain large fragments on the beads that are unsuitable for sequencing.
- Transfer the supernatant to a new 96-well PCR plate. Do not discard supernatant as this contains partially purified DNA.
- Add another 25 µL of paramagnetic beads and mix by pipetting 25 times and incubate at room temperature off the magnet for 4 min.
- Place samples back on the magnet and incubate at room temperature for another 4 min and discard the supernatant. This step is used to retain fragments of ~200 to 600 bp that will be used for finalized libraries.
- While leaving the samples on the magnet, add 150 µL of 70% ethanol (v/v) and allow incubating for 30 s without disturbing the beads (do not move while on the magnet). Remove the ethanol and repeat the wash a second time.
- Allow the paramagnetic beads to air dry on the magnet for 5 min. Remove all ethanol after the second wash as remaining ethanol will interfere with purification.
- Remove the samples from the magnet and add 25 µL of 10 mM Tris-Cl pH 8.0. Mix by pipetting 25 times and incubate at room temperature off the magnet for 4 min. Place the samples back on the magnet and incubate at room temperature for another 4 min.
- Quantify libraries using a high sensitivity DNA electropherogram instrument before multiplexing to ensure sizes are suitable for sequencing. Completed libraries range between 200 – 600 bp and are devoid of all primer dimers.
NOTE: If necessary, another 0.7x paramagnetic bead purification is performed to remove unwanted primer dimers that are present at ~130 bp. - Pool the quantified DNA based on unique index primers according to concentration. For a pool containing six samples with concentrations between 1 ng/µL and 6ng/µL, the distribution is 15 µL of the lowest sample and 2.5 µL of the highest sample. This is done to ensure read counts will be evenly distributed on each lane of the flow cell.
8. Post ChIP-seq Data Processing
- A pipeline based on snakemake38,39 is used to process of all of the following steps in a single command. Importantly, each of these steps are discussed individually with associated commands.
- Determine quality of raw fastq sequencing reads using FastQC (http://www.bioinformatics.babraham.ac.uk/projects/fastqc/): Open unix terminal and change directory (cd) to the folder containing the raw fastq files for each of the six histone modifications. In the unix terminal type, fastqc *fastq.gz and press [RETURN]. This will run quality control metrics on all the fastq files in the folder.
- Align quality reads to the reference genome and remove duplicates before compression to bam files. This is performed using bowtie version 1.1.239, SAMBLASTER version 0.1.2140, and SAMTOOLS version 1.3.141: In the unix terminal type, bowtie -m 1 -n 1 –best –strata -S -q /path_to/hg19 histone1.fastq.gz | samblaster -removeDups | samtools view -Sb – >histone1.bam and press [RETURN].
NOTE: path_to indicates the folder containing the hg19 human genome assembly. This will change depending on the organism of interest. - Sort bam files using SAMTOOLS with the following command: In the unix terminal type, samtools sort histone1.bam -m 2G -@ 5 -T histone1.temp -o histone1.sorted and press [RETURN].
- Index bam files using SAMTOOLS with the following command: In the unix terminal type, samtools index histone1.sorted.bam histone1.sorted.bam.bai and press [RETURN].
- Determine uniquely mapped and unaligned reads using SAMTOOLS flagstat with the following command: In the unix terminal type, samtools flagstat histone1.sorted.bam and press [RETURN].
- Normalize bam files per read counts by performing random sampling with the following command: In the unix terminal type, sambamba view -f bam -subsampling-seed=3 -s 0.X histone1.sorted.bam | samtools sort -m 2G -@ 5 -T histone1.downsample.temp -o histone1.downsample.sorted.bam and press [RETURN].
- Index the bam files again using SAMTOOLS with the following command: In the unix terminal type, samtools index histone.downsample.sorted.bam histone.downsample.sorted.bam.bai and press [RETURN].
- To visualize ChIP-seq libraries on a genome browser (i.e. UCSC or IGV), generate bigwig files using deepTools version 2.4.040 by scaling the bam files to reads per kilobase per million (RPKM). This can be performed using the following commands:
- For standard bigwig files: In the unix terminal type, bamCoverage -b histone1. downsample.sorted.bam –normalizeUsingRPKM –binSize 30 –smoothLength 300 –extendReads 200 -o histone1.bw and press {RETURN].
- For input subtracted bigwig files: In the unix terminal type, bamCompare –bamfile1 histone1.downsample.sorted.bam –bamfile2 input1.downsample.sorted.bam –normalizeUsingRPKM –ratio subtract –binSize 30 –smoothLength 300 –extendReads 200 -o histone1.subtracted.bw and press [RETURN].
- Identify ChIP-seq signal enrichment over "Input" background using Model based analysis of ChIP-seq (MACS) version 1.4.225,26 and version 2.1.0. Use macs1 for "point source" factors H3K4me3, H3K4me1 and H3K27ac and macs2 for "broad source" factors H3K79me2, H3K27me3 and H3K9me3. This is performed using the following commands:
- For Point Source: In the unix terminal type, macs14 -t histone1.downsample.sorted.bam -c input1.downsample.sorted.bam -g hs -f BAM -p 1e-5 –nomodel –keep-dup all -n histone1.file and press [RETURN].
- For Broad Source: In the unix terminal type, macs2 callpeak -t histone1.downsample.sorted.bam -c input1.downsample.sorted.bam -g hs -f BAM -p 1e-6 –broad –broad-cutoff 1e-6 –keep-dup all –nomodel -n histone1.file and press [RETURN].
- Use ChromHMM24 to identify combinatorial chromatin state patterns based on the histone modifications studied using the following commands:
- In the unix terminal type, cd /path_to/ChromHMM_folder and press [RETURN].
- Once in the ChromHMM directory type, java -mx2G -jar ChromHMM.jar BinarizeBam -b 1000 hg19.txt /path_to/bam_directory /path_to/CellMarkFile.txt /path_to/BinarizeBam_output and press [RETURN].
- Type, java -mx2G -jar ChromHMM.jar LearnModel -b 1000 /path_to/BinarizeBam /path_to/output_directory 15 hg19 and press [RETURN].
Representative Results
This protocol allows the immunoprecipitation from frozen tumor tissues and cell lines that can be performed on dozens of samples in parallel using a high-throughput method (Figure 1A). Chromatin fragments should range between ~200 – 1000 bps for optimal immunoprecipitation. We have noted that the time needed to achieve same shearing length differs for different tissue and cell types. The success of ChIP from small amounts of tissue depends on keeping the lysate cold at all times especially during sonication. Purified ChIP-DN Ashould be quantified before proceeding to library preparation (Figure 2A). Completed libraries suitable for multiplexing and NGS should range between ~200 – 600 bp and be devoid of any primer dimers (Figure 2B). Upon post-sequencing, there are many quality control metrics that should be met before proceeding to further steps of the pipeline, such as MACS peak-calling or ChromHMM analysis (Figure 3). Many of these metrics can be determined using programs such as FastQC and MultiQC. Quality fastq reads are aligned to the human genome at a rate of ~50 – 80% with a maximum of one mismatch. A recommended sequencing depth is ~10 – 15 million uniquely mapped reads for "point source" factors and ~20 – 30 million uniquely mapped reads for "broad source" factors27,41,42,43. Sorted and indexed BAM files are used to generate bigwig files that can be visualized using a genome browser such as IGV or UCSC. ChIP samples should be enriched over input DNA and each histone modification should display a distinct profile representing a specific component of the epigenetic landscape (Figure 4A). It is possible that in some tissues there will be higher levels of background noise which can obscure the ChIP-seq signal. If this occurs, it is recommended to generate input subtracted bigwig files and re-visualize on a genome browser. To determine chromatin state profiles, we utilize ChromHMM algorithm24. ChromHMM uses a multivariate Hidden Markov Model to identify the most prominent re-occurring combinatorial and spatial chromatin patterns based on the histone modifications studied (Figure 5). Using these six modifications ChromHMM identifies functionally distinct chromatin states representing both repressive and active domains, such as polycomb repression (State 1), heterochromatic repression (State 5), active transcription (State 8 and 9) and active enhancers (State 13 and 14). The output from ChromHMM includes segmented bed files for each state that can further be used for downstream analysis.
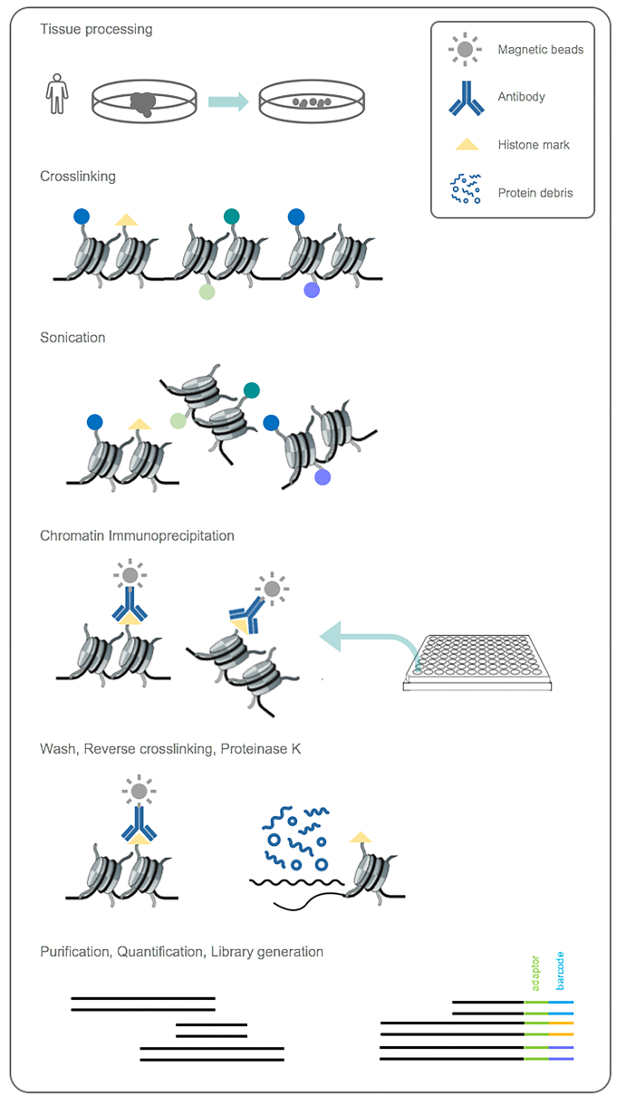
Figure 1: Work-flow for ChIP module. Biopsied tumor tissue is first disassociated and cross-linked to capture protein-DNA interactions. Tissue is then sonicated to obtain chromatin fragments suitable for immunoprecipitation and histone-DNA complexes are precipitated using the six indicated antibodies. Samples are washed, cross-links are reversed and ChIP-DNA is purified and quantified. Libraries are generated from purified DNA and multiplexed according to unique indexes. Please click here to view a larger version of this figure.
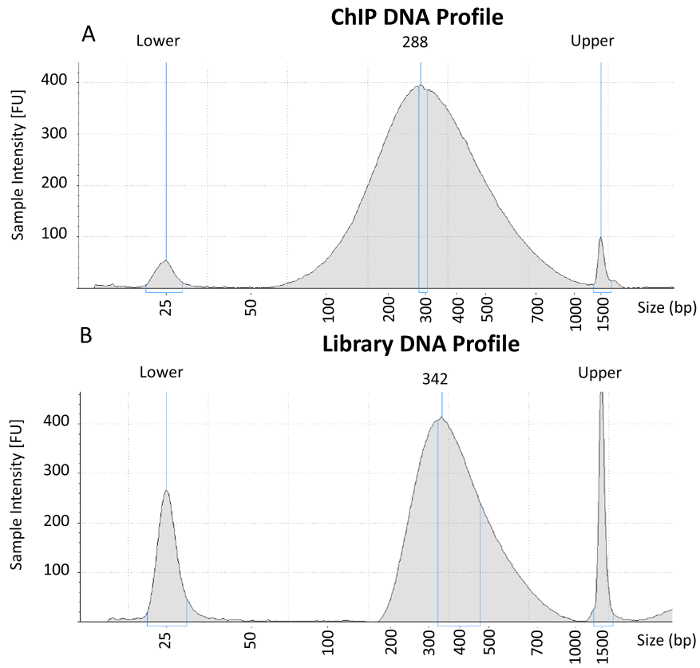
Figure 2: Electropherogram analysis of purified ChIP-DNA and completed library preparation. (A) Representative electropherogram from purified ChIP-DNA containing chromatin fragments ~200 – 600 bp that is suitable for library preparation. (B) Representative electropherogram from a completed library after amplification and double-sided paramagnetic size selection that is suitable for multiplexing and NGS. Please click here to view a larger version of this figure.
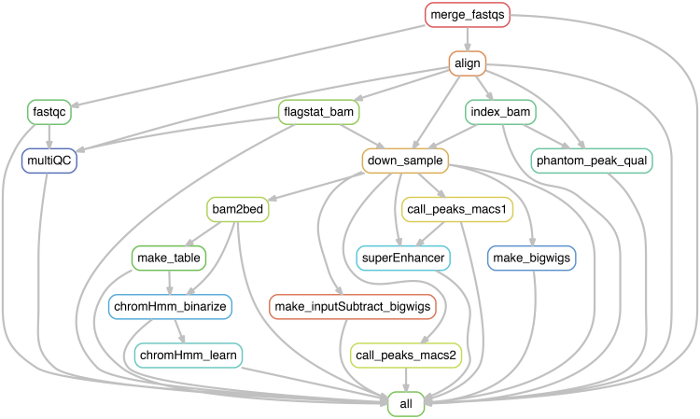
Figure 3: Work-flow for ChIP-seq data processing module. Work-flow displaying critical steps for ChIP-seq data processing and preparation for downstream analysis. The pipeline used in this protocol was generated using snakemake, however, each of these steps can also be performed individually as described. Please click here to view a larger version of this figure.
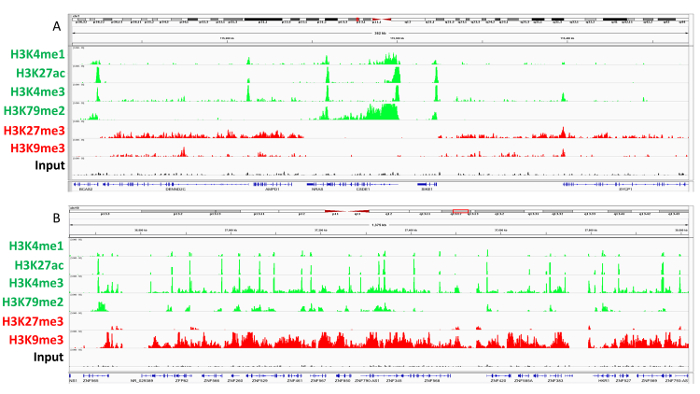
Figure 4: Genome browser view of histone modification ChIP-seq tracks. A) ChIP-seq tracks generated by deeptools displaying active and repressed regions surrounding the NRAS locus in a representative melanoma tumor sample. Genes such as NRAS, CSDE1 are SIKE1 are associated with all active histone modifications (H3K27ac, H3K4me3 and H3K4me1) and active transcription (H3K79me2), whereas flanking genes AMPD1, DENND2C, and SYCP1 contain polycomb repressive mark H3K27me3 and do not contain active transcription. B) ChIP-seq tracks generated by deeptools displaying poised heterochromatin across ZNF genes in representative melanoma tumor sample. Please click here to view a larger version of this figure.
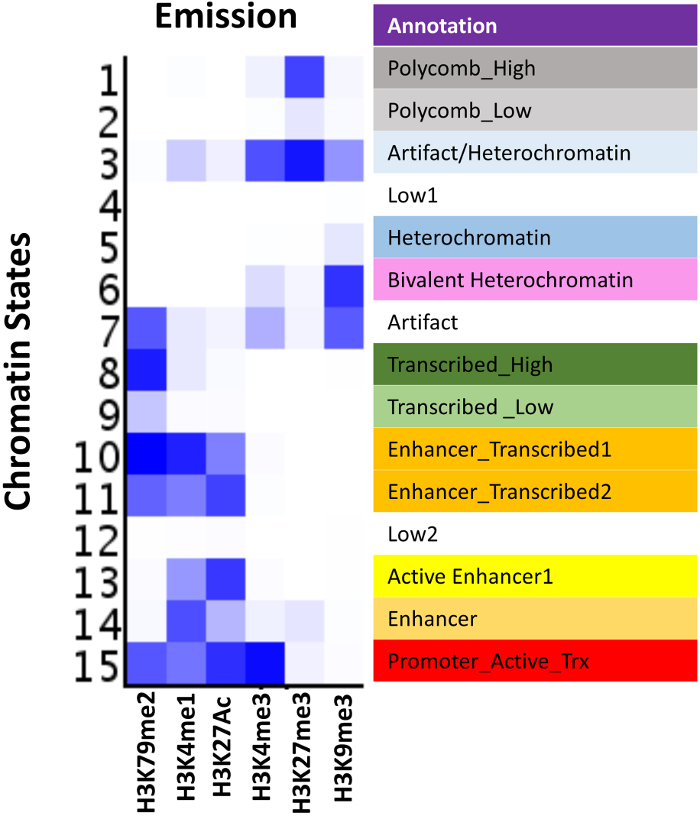
Figure 5: ChromHMM model based on melanoma tumor samples. Emission profile from a 15-State LearnModel based on the six histone modifications studied. ChromHMM identifies functionally distinct chromatin states representing both repressive and active domains, such as polycomb repression (State 1), heterochromatic repression (State 5), active transcription (State 8 and 9) and active enhancers (State13 and 14). Please click here to view a larger version of this figure.
Discussion
This protocol describes a complete and comprehensive high-throughput ChIP-seq module for genome-wide mapping of chromatin states in human tumor tissues and cell lines. In any ChIP-seq protocol, one of the most important steps is antibody specificity. Here, this method illustrates immunoprecipitation conditions for the described six histone modifications, all of which are ChIP-grade and have been previously validated in our and other laboratories42,44,45. While the same antibody concentrations have been successfully applied to various other tumor types, it is critical to determine antibody specificity if studying different factors of interest27.
Another key aspect for a successful experiment includes the optimization of sonication conditions. Sonication time can vary both between sample and tissue type and has to be adjusted accordingly. For proper optimization, a trial run is performed for each sample by incrementally increasing the sonication time and continuously checking fragment size. For the initial ChIP-experiment chromatin fragments should range between ~200 – 1000 bp for optimal immunoprecipitation, and purified ChIP-DNA should be quantified before proceeding to library preparation. This fragment size ensures optimal generation and retention of amplified DNA (~200 to 600 bp) that will be used for multiplexing and NGS. If performing these experiments in a high-throughput manner, a good starting point for multiplexing is to pool ~8 samples per lane for sequencing. While this amount of samples may produce a shallow sequencing depth, it is useful for testing antibody quality before proceeding. One of the bottlenecks of pooling multiple samples is unequal coverage post sequencing. Usually a fluoremetric method based quantitation is used, however, many-a-times it is not equivalent to sequencing-ready molecules in each library. The best method for quantitation of library DNA is to utilize qPCR using standards made-of pre-determined sequencing-ready DNA molecules.
Another critical step in ChIP-Seq dataset analysis is post-sequencing data processing. Importantly, before proceeding to any aspect of downstream analysis there are various quality control metrics that should be met first. Programs such as FastQC will provide information regarding the quality of raw fastq sequencing reads in the form of pass or fail testing. While the fastq reads should pass most of the metrics, some of the more important tests include Basic Statistics, Per sequence base quality, Per sequence quality scores, and Adaptor Contamination. FastQC-processed reads are aligned to the human genome and should map at a rate of ~50 – 80% with a maximum of one mismatch. Rates lower than 50% may indicate issues in ChIP, library preparation or sequencing and can include contamination, low quality ChIP-DNA or over-amplification during PCR. During conversion of SAM to BAM files, duplicate reads should first be flagged and then subsequently removed using SAMBLASTER before proceeding to down sampling. While some level of duplication is normal during PCR, high levels of duplication are usually indicative of low quality ChIP-DNA, or possibly a problem with library preparation. The outputs from FastQC, bowtie, and samblaster (combined in flagstat) can all be piped into MultiQC which provides a complete interactive summary of all the quality control results. MultiQC displays quality control metrics from the output files of fastqc, bowtie, and samblaster providing information regarding basic statistics, alignment percentages, and PCR duplication rates respectively.
After down-sampling normalization, the next and probably most important step, is data visualization using a genome browser such as IGV or UCSC. Each histone modification represents a key component of the epigenetic regulatory landscape, including H3K27ac (enhancers), H3K4me1 (active and poised enhancers), H3K4me3 (promoters), H3K79me2 (transcribed regions), H3K27me3 (polycomb repression), and H3K9me3 (heterochromatic repression). By using these marks either alone or in combination, these histones can identify active, poised or repressed enhancers and promoters, as well as the transcriptional status of coding regions. This was demonstrated using ChromHMM, in which functionally distinct chromatin states representing both repressive and active domains were identified. These states were defined by singular marks, such as polycomb repression (H3K27me3), hetrochromatic repression (H3K9me3), and active transcription (H3K79me2), as well as combinatorial marks, such as active enhancers (H3K4me1 and H3K27ac) and transcribed enhancers (H3K4me1, H3K27ac and H3K79me2).
The presented integrated platform is well-suited for determination of occupancy of histones or transcription factors from tissues samples. We have successfully utilized this protocol for determination of occupancy of the aforementioned six marks from biopsy-size melanoma samples. However, we have still not determined the lowest amount of tissue required for successful ChIP-Seq applications because it is depenedent on the tissue type as well as available antibody. Furthermore, although we routinely utilize this protocol on fresh, flash frozen and OCT frozen samples, we have not optimized this protocol for FFPE tissues. Some recent studies have reported protocols for such tissues46,47 and the proposed changes there can be incorporated in the framework of this platform to test whether the presented platform will be useful from FFPE tissues. We believe this will be highly useful in determination of chromatin state patterns from clinical material obtained from patients under clinical trials. Overall, this protocol describes a complete and comprehensive ChIP-seq module for genome-wide mapping of chromatin states in human tumor tissues, with easy to follow instructions encompassing all of the necessary components for a successful experiment.
Disclosures
The authors have nothing to disclose.
Acknowledgements
We thank Marcus Coyle, Curtis Gumbs, SMF core at MDACC for sequencing support. The work described in this article was supported by grants from the NIH grant (CA016672) to SMF Core and NCI awards (1K99CA160578 and R00CA160578) to K. R.
Materials
| ChIP-grade H3K4me1 antibody | Abcam | ab8895 | |
| ChIP-grade H3K27ac antibody | Abcam | ab4729 | |
| ChIP-grade H3K4me3 antibody | Abcam | ab8580 | |
| ChIP-grade H3K79me2 antibody | Abcam | ab3594 | |
| ChIP-grade H3K27me3 antibody | Abcam | ab6002 | |
| ChIP-grade H3K9me3 antibody | Abcam | ab8898 | |
| 1M Tris HCl, pH 8.0 | Teknova | T1080 | |
| EDTA | Sigma-Aldrich | E9884 | |
| NaCl | Sigma-Aldrich | S7653 | |
| Glycine | Sigma-Aldrich | G8898 | |
| Sodium deoxycholate | Sigma-Aldrich | 30970 | |
| DPBS | Sigma – Life Sciences | D8537-500ML | |
| SDS | Sigma-Aldrich | 74255 | |
| Triton-X | Sigma-Aldrich | X100-100ML | |
| LiCl | Sigma-Aldrich | 746460 | |
| NP-40 | Calbiochem | 492016-100ML | |
| 1% TWEEN-20 | Fisher Bioreagents | BP337-500 | |
| BSA – IgG-free | Sigma – Life Sciences | A2058-5G | |
| HBSS | Gibo | 14025092 | |
| GentleMACS C tube | GentleMACS | 120-008-466 | disassociation tube |
| 16% Formaldehyde | Peierce | 28906 | |
| miniProtease inhibitor | Roche Diagnostics | 11836153001 | protease inhibitor tablets |
| Dynabeads Protein G | Invitrogen | 10009D | |
| Bioruptor NGS tubes 0.65 mL | Diagenode | C30010011 | sonication tubes |
| DynaMag – 96 Side Skirted | Invitrogen | 120.27 | 96-well magnetic stand |
| TE buffer | Promega | V6231 | |
| RNase A | Invitrogen | 12091021 | |
| Proteinase K | Invitrogen | 100005393 | |
| AMPure XP beads | Beckman Coulter | A63882 | paramagnetic beads |
| Ethanol | Sigma-Aldrich | E7023 | |
| Qubit ds DNA High Sensitivity Assay Kit | Invitrogen | Q32854 | high sensitivity DNA reagents |
| NEBNext Ultra II DNA Library Prep Kit | New England BioLabs | E7645L | DNA Library Prep Kit |
| Nuclease-free water | Ambion | AM9932 | |
| High sensitivity D1000 ScreenTape | Agilent Technologies | 5067-5584 | high sensitivity DNA reagents |
| High sensitivity D1000 reagents | Agilent Technologies | 5067-5585 | high sensitivity DNA reagents |
| Multiplex Oligos (Index primers- Set 1) | New England BioLabs | E7335L | Multiplex Oligos |
| Multiplex Oligos (Index primers- Set 2) | New England BioLabs | E7500L | Multiplex Oligos |
| TapeStation 4200 | Agilent Technologies | G2991AA | high sensitivity DNA electropherogram instrument |
| Bioruptor Pico sonication device | Diagenode | B01060001 | water bath disruputor |
| Mixer | Nutator | 421105 | |
| Bio-Rad C1000 Touch Thermal Cycler | Bio-Rad | 1851196 | PCR Thermal cycler |
| Water Bath | Fisher Scientific | 2322 | |
| Multichannel Pipet | Denville | 1003123 | |
| Tube Revolver | Thermo-Scientific | 88881001 | |
| 96-Well Skirted Plate | Eppendorf | 47744-110 | |
| Allegra X-12R Centrifuge | Beckman Coulter | A99464 | benchtop centrifuge |
| Centrifuge 5424 | Eppendorf | 22620461 | tabletop centrifuge |
| Optical tube strips (8x Strip) | Agilent Technologies | 401428 | |
| Optical tube strip caps (8x strip) | Agilent Technologies | 401425 | |
| Loading Tips, 10 Pk | Agilent Technologies | 5067-5599 | |
| IKA MS3 vortex | IKA | 3617000 | vortex |
References
- Rao, S. S., et al. A 3D map of the human genome at kilobase resolution reveals principles of chromatin looping. Cell. 159 (7), 1665-1680 (2014).
- Hnisz, D., Day, D. S., Young, R. A. Insulated Neighborhoods: Structural and Functional Units of Mammalian Gene Control. Cell. 167 (5), 1188-1200 (2016).
- Dixon, J. R., et al. Topological domains in mammalian genomes identified by analysis of chromatin interactions. Nature. 485 (7398), 376-380 (2012).
- Sanyal, A., Lajoie, B. R., Jain, G., Dekker, J. The long-range interaction landscape of gene promoters. Nature. 489 (7414), 109-113 (2012).
- Wang, X., et al. SMARCB1-mediated SWI/SNF complex function is essential for enhancer regulation. Nat Genet. 49 (2), 289-295 (2017).
- Hnisz, D., et al. Activation of proto-oncogenes by disruption of chromosome neighborhoods. Science. 351 (6280), 1454-1458 (2016).
- Jäger, R., et al. Capture Hi-C identifies the chromatin interactome of colorectal cancer risk loci. Nat Commun. 6, 6178 (2015).
- Krijger, P. H., de Laat, W. Regulation of disease-associated gene expression in the 3D genome. Nat Rev Mol Cell Biol. 17 (12), 771-782 (2016).
- Mansour, M. R., et al. Oncogene regulation. An oncogenic super-enhancer formed through somatic mutation of a noncoding intergenic element. Science. 346 (6215), 1373-1377 (2014).
- Weischenfeldt, J., et al. Pan-cancer analysis of somatic copy-number alterations implicates IRS4 and IGF2 in enhancer hijacking. Nat Genet. 49 (1), 65-74 (2017).
- Herz, H. M., Hu, D., Shilatifard, A. Enhancer malfunction in cancer. Mol Cell. 53 (6), 859-866 (2014).
- Kouzarides, T. Chromatin modifications and their function. Cell. 128 (4), 693-705 (2007).
- Tan, M., et al. Identification of 67 histone marks and histone lysine crotonylation as a new type of histone modification. Cell. 146 (6), 1016-1028 (2011).
- Strahl, B. D., Allis, C. D. The language of covalent histone modifications. Nature. 403 (6765), 41-45 (2000).
- Ernst, J., et al. Mapping and analysis of chromatin state dynamics in nine human cell types. Nature. 473 (7345), 43-49 (2011).
- Consortium, E. P., et al. An integrated encyclopedia of DNA elements in the human genome. Nature. 489 (7414), 57-74 (2012).
- Rivera, C. M., Ren, B. Mapping human epigenomes. Cell. 155 (1), 39-55 (2013).
- Stergachis, A. B., et al. Developmental fate and cellular maturity encoded in human regulatory DNA landscapes. Cell. 154 (4), 888-903 (2013).
- Xie, W., et al. Epigenomic analysis of multilineage differentiation of human embryonic stem cells. Cell. 153 (5), 1134-1148 (2013).
- Chen, L., et al. Transcriptional diversity during lineage commitment of human blood progenitors. Science. 345 (6204), 1251033 (2014).
- Saeed, S., et al. Epigenetic programming of monocyte-to-macrophage differentiation and trained innate immunity. Science. 345 (6204), 1251086 (2014).
- Bernstein, B. E., et al. The NIH Roadmap Epigenomics Mapping Consortium. Nat Biotechnol. 28 (10), 1045-1048 (2010).
- Roadmap Epigenomics, C., et al. Integrative analysis of 111 reference human epigenomes. Nature. 518 (7539), 317-330 (2015).
- Ernst, J., Kellis, M. ChromHMM: automating chromatin-state discovery and characterization. Nat Methods. 9 (3), 215-216 (2012).
- Feng, J., Liu, T., Qin, B., Zhang, Y., Liu, X. S. Identifying ChIP-seq enrichment using MACS. Nat Protoc. 7 (9), 1728-1740 (2012).
- Zhang, Y., et al. Model-based analysis of ChIP-Seq (MACS). Genome Biol. 9 (9), R137 (2008).
- Landt, S. G., et al. ChIP-seq guidelines and practices of the ENCODE and modENCODE consortia. Genome Res. 22 (9), 1813-1831 (2012).
- O’Neill, L. P., VerMilyea, M. D., Turner, B. M. Epigenetic characterization of the early embryo with a chromatin immunoprecipitation protocol applicable to small cell populations. Nat Genet. 38 (7), 835-841 (2006).
- Dahl, J. A., Collas, P. Q2ChIP, a quick and quantitative chromatin immunoprecipitation assay, unravels epigenetic dynamics of developmentally regulated genes in human carcinoma cells. Stem Cells. 25 (4), 1037-1046 (2007).
- Zhang, B., et al. Allelic reprogramming of the histone modification H3K4me3 in early mammalian development. Nature. 537 (7621), 553-557 (2016).
- Dahl, J. A., et al. Broad histone H3K4me3 domains in mouse oocytes modulate maternal-to-zygotic transition. Nature. 537 (7621), 548-552 (2016).
- Shen, J., et al. H3K4me3 epigenomic landscape derived from ChIP-Seq of 1,000 mouse early embryonic cells. Cell Res. 25 (1), 143-147 (2015).
- Flanagin, S., Nelson, J. D., Castner, D. G., Denisenko, O., Bomsztyk, K. Microplate-based chromatin immunoprecipitation method, Matrix ChIP: a platform to study signaling of complex genomic events. Nucleic Acids Res. 36 (3), e17 (2008).
- Nelson, J. D., Denisenko, O., Sova, P., Bomsztyk, K. Fast chromatin immunoprecipitation assay. Nucleic Acids Res. 34 (1), e2 (2006).
- Lerdrup, M., Johansen, J. V., Agrawal-Singh, S., Hansen, K. An interactive environment for agile analysis and visualization of ChIP-sequencing data. Nat Struct Mol Biol. 23 (4), 349-357 (2016).
- Afgan, E., et al. The Galaxy platform for accessible, reproducible and collaborative biomedical analyses: 2016 update. Nucleic Acids Res. 44 (W1), W3-W10 (2016).
- Blecher-Gonen, R., et al. High-throughput chromatin immunoprecipitation for genome-wide mapping of in vivo protein-DNA interactions and epigenomic states. Nat Protoc. 8 (3), 539-554 (2013).
- Tang, M. pyflow-ChIPseq: a snakemake based ChIP-seq pipeline. Zenodo. , (2017).
- Koster, J., Rahmann, S. Snakemake–a scalable bioinformatics workflow engine. Bioinformatics. 28 (19), 2520-2522 (2012).
- Ramirez, F., et al. deepTools2: a next generation web server for deep-sequencing data analysis. Nucleic Acids Res. 44 (W1), W160-W165 (2016).
- Bailey, T., et al. Practical guidelines for the comprehensive analysis of ChIP-seq data. PLoS Comput Biol. 9 (11), e1003326 (2013).
- Fiziev, P., et al. Systematic Epigenomic Analysis Reveals Chromatin States Associated with Melanoma Progression. Cell Rep. 19 (4), 875-889 (2017).
- Liu, T., et al. Broad chromosomal domains of histone modification patterns in C. elegans. Genome Res. 21 (2), 227-236 (2011).
- Egelhofer, T. A., et al. An assessment of histone-modification antibody quality. Nat Struct Mol Biol. 18 (1), 91-93 (2011).
- Rai, K., et al. Dual Roles of RNF2 in Melanoma Progression. Cancer Discov. , (2015).
- Cotney, J. L., Noonan, J. P. Chromatin immunoprecipitation with fixed animal tissues and preparation for high-throughput sequencing. Cold Spring Harb Protoc. (2), 191-199 (2015).
- Cejas, P., et al. Chromatin immunoprecipitation from fixed clinical tissues reveals tumor-specific enhancer profiles. Nat Med. 22 (6), 685-691 (2016).
