Growth analysis depends on a set of tools that are commonly used by plant scientists to describe genotype determined growth differences and/or phenotypic responses to environmental factors. They include size and weight measurements of the whole plant or an organ and calculations of growth rates to explore the underlying mechanisms of growth. Organ growth is determined by cell division and expansion at the cellular level. Therefore, including the quantification of these two processes in growth analyses is key to understanding differences in whole-organ growth1. Consequently, it is crucial to have an appropriate methodology to determine cellular growth parameters that is relatively easy to use by non-specialized laboratories.
Kinematic analysis has already been established as an approach providing a powerful framework for the development of organ growth models2. The technique has been optimized for linear systems, such as Arabidopsis thaliana roots and monocotyledonous leaves, but also for non-linear systems, such as dicotyledonous leaves3. Nowadays, this methodology is increasingly being used to study how genetic, hormonal, developmental, and environmental factors influence cell division and expansion in various organs (Table 1). Moreover, it also provides a framework to link cellular processes to their underlying biochemical, molecular, and physiological regulations (Table 2), although limitations can be imposed by organ size and spatial organization for techniques that require higher amounts of plant material (e.g., metabolite measurements, proteomics, etc.).
Monocotyledonous leaves, such as the maize (Zea mays) leaf, represent linear systems in which cells move from the base of the leaf towards the tip, sequentially passing through the meristem and elongation zone to reach the mature zone. This makes it an ideal model system for quantitative studies of the spatial patterns of growth4. Moreover, maize leaves have large growth zones (meristem and elongation zone spanning several centimeters5) and provide possibilities for studies at other organizational levels. This allows for the investigation of the (putative) regulatory mechanisms controlling cell division and expansion, quantified by kinematic analysis through a range of molecular techniques, physiological measurements, and cell biology approaches (Table 2).
Here, we provide a protocol for performing a kinematic analysis in monocot leaves. First, we explain how to conduct a proper analysis of both cell division and cell elongation as a function of position along the leaf axis and how to calculate kinematic parameters. Secondly, we also show how this can be used as a basis for sampling design. Here, we discuss two cases: high-resolution sampling and focused sampling, enabling improved data interpretation and the saving of time/money, respectively.
Table 1. Overview of kinematic analyses methods for quantification of cell division and expansion in various organs.
| organ | reference |
| monocotyledonous leaves | 16, 20, 21, 22 |
| root tips | 2, 23, 24, 25, 26, 27, 28, 29 |
| dicotyledonous leaves | 21, 30, 31 |
| shoot apical meristem | 32 |
Table 1. Overview of kinematic analyses methods for quantification of cell division and expansion in various organs.
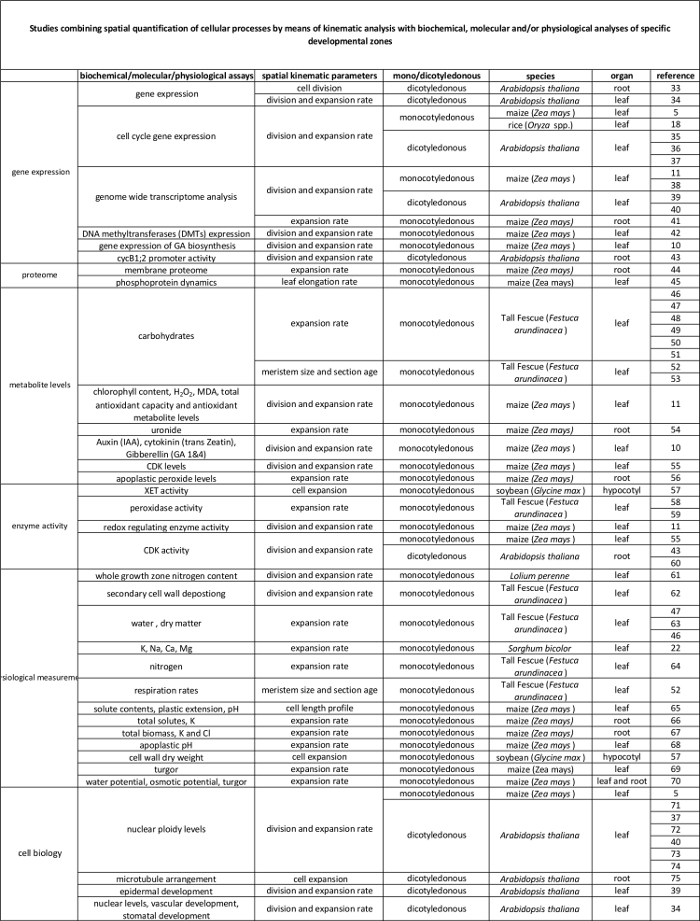
Table 2. Link between cellular processes quantified by the kinematic analysis to their regulation at the molecular level. References to various studies linking the quantification of cellular processes to results from biochemical and molecular assays in various species and organs. Xyloglucan endotransglucosylase (XET), malondialdehyde (MDA), cyclin-dependent kinases (CDK). Please click here to view a larger version of this table.
NOTE: The following protocol for kinematic analysis is only valid for leaves during steady-state growth. This implies a stable leaf elongation rate and spatial patterns of cell length and expansion in a leaf during a period of several days6.
1. Plant Growth and Measurements of Leaf Elongation Rate (LER)
- Choose a leaf in steady-state growth and a developmental stage of interest.
NOTE: There is a difference between steady-state growth and repetitive growth, which implies similar spatial patterns on successive leaves on the same axis. During the early stages of seedling growth, successive leaves typically grow increasingly faster due to the increasing size of the growth zone7. Although a few higher leaf positions can have a similar growth pattern8, this is a transient phase that may be affected by treatments under investigation. It is therefore important to compare lines and treatments strictly on the same leaf position, even though it may be developing at a different time. Even at a constant elongation rate, the growth rate profile is not necessarily the same at different developmental stages. Therefore, it is important to analyze leaves at the same developmental stage8, typically defined by the number of days after emergence. - To perform a full kinematic analysis of leaf growth in monocots, grow at least 15 plants for each treatment and genotype under controlled conditions in a growth room.
- At the time the leaf of interest appears (emergence from the whorl of surrounding leaves), start measuring the length of the leaf daily with a ruler until the leaf is fully expanded (Figure 1i). Leaf length implies the length from soil level to the tip of the leaf. Be careful not to break or damage the leaf, since this might alter its growth.
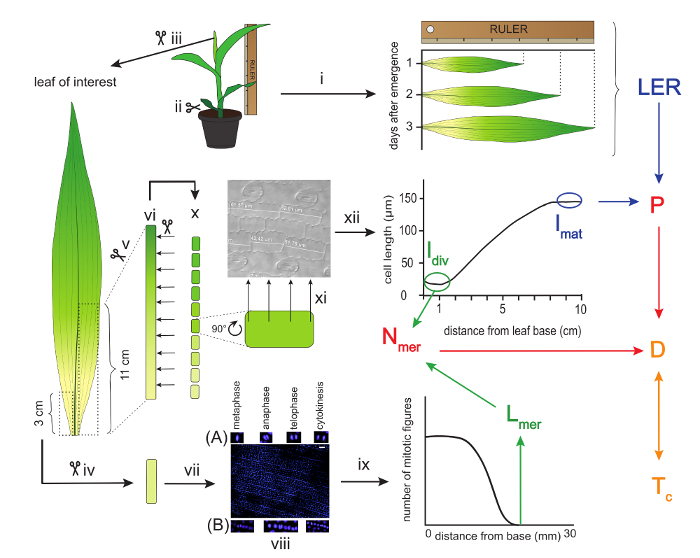
Figure 1: Schematic overview of a kinematic analysis of maize leaves. The leaf of interest is measured with a ruler for three consecutive days to calculate the Leaf Elongation Rate (LER). Thereafter, the leaf is harvested and a three-centimeter segment is used for the determination of the meristem size. This is done by measuring the length from the base up to the most distal mitotic figure after DAPI staining. (A) Examples of proliferative mitotic figures and (B) formative mitotic figures. The first eleven centimeters from the leaf base on the other side of the mid vein are used to cut ten one-centimeter segments for cell length measurements. These measurements provide the basis for creating the cell length profile, which serves to determine the mature cell length (lmat) and the length of cells leaving the meristem (ldiv). The LER and lmat are used to calculate the cell production rate (P), while ldiv and Lmer are used to calculate the number of cells in the meristem (Nmer). In turn, P and Nmer are used to calculate the average cell division rate (D), which is the inverse of cell cycle duration (Tc). Arrows of the same color indicate parameters that are used to calculate the parameter following on these arrows. Scale bars = 40 µm. Roman numbers are used to refer to specific experimental procedures described in the protocol. Please click here to view a larger version of this figure.
2. Harvesting
- At the developmental stage of interest (e.g., the third day after emergence), choose at least five representative plants from the batch on which to conduct the kinematic analysis. Continue measuring the rest of the plants as explained in step 1.3 to determine the final leaf length.
- Cut the above ground part of the plant. To keep the meristematic part intact, cut as close as possible to the roots (Figure 1ii).
- Starting from the outer leaves, remove all leaves up to the leaf of interest by gently unrolling them one by one. If necessary, remove a few extra millimeters from the base to detach the leaves. Also remove the apex and small leaves enclosed by the leaf of interest (Figure 1iii).
- Cut a 3 cm segment, starting from the base on one side of the mid vein, and store it in a 1.5 ml test tube filled with 3:1 (v:v) absolute ethanol:acetic acid solution (CAUTION: wear gloves) at 4 °C for 24 hr up to several months (Figure 1iv). This segment will later be used to determine the length of the meristem.
- From the other side of the vein, cut a 11 cm segment from the base (Figure 1 v) and place it in a 15 ml tube filled with absolute ethanol at 4 °C for at least 6 hr to remove pigments (Figure 1 vi).
NOTE: Later on, use only the first 10 cm to determine the cell length profile (see Discussion). - Renew the absolute ethanol for another round of cleaning at 4 °C for at least 24 hr (Figure 1vi).
- Finally, substitute the absolute ethanol with pure lactic acid (CAUTION: wear gloves) for cleaning and storage at 4 °C for 24 h or until further use (Figure 1vi).
3. Meristem Length Measurements
- Prepare a rinsing buffer containing 50 mM sodium chloride (NaCl), 5 mM ethylenediaminetetraacetic acid (EDTA; CAUTION: wear gloves) and 10 mM Tris(hydroxymethyl)aminomethane-hydrochloric acid (TRIS-HCl; pH 7).
- Take the 3 cm segment from section 2.4 and soak it in the buffer for 20 min (Figure 1vii).
- While waiting, use the rinsing buffer to prepare a 4',6-diamidino-2-phenylindole (DAPI) staining solution of 1 µg/ml, keeping it on ice and in the dark.
- Stain the nuclei by placing the meristem segment for 2-5 min in the DAPI staining solution. Work on ice and in the dark (Figure 1vii).
- Check for fluorescence signal by quickly mounting the segment on a microscopy glass and covering it with a cover glass. The epidermal cells should show fluorescence, while the underlying cell layers should not.
- If the staining is not sufficient, put the segment back in the DAPI staining solution for some extra minutes.
- To stop the staining, mount the segments in a drop of rinsing buffer on a microscopy slide and cover with a cover glass.
- Use a microscope equipped with UV-fluorescence at a 20X magnification, allowing for visualization of around 1,000 epidermal cells at once. Scroll throughout the segment and look for proliferative mitotic figures (metaphase, anaphase, telophase, and cytokinesis), but avoid formative cell division of the developing stomata (Figure 1viii)9. Define where the most distal mitotic figure is located.
- Determine the length of the meristem by measuring the distance between the base of the leaf and the most distal epidermal mitotic figure. Use an image-analysis software (e.g., ImageJ) to measure the full length of the image frame.
- Count the number of frames that cover the full meristem length (from the leaf base to the most distal mitotic figure) and multiply this number by the length of one frame to obtain the full meristem length (Figure 1ix).
4. Cell Length Profile
- Take the segment that is stored in lactic acid (step 2.5) and place it carefully on the bench. Cut the segments with a scalpel in 10 segments of 1 cm each (Figure 1x).
- Mount the successive leaf segments on a microscopy slide in a small drop of lactic acid. Make sure to consistently face either the adaxial or abaxial side up. In principle, there is no preference for a particular side.
- Use a microscope equipped with differential interference contrast (DIC) optics to analyze the segments, starting from the leaf base. Measure with an image analysis software the length of at least 20 replicate epidermal cells in files directly adjacent to the stomatal files in order to consistently select the same cell type.
- Do this at equally spaced positions along each of the segments (4 positions per segment suffice), and make sure to write down the corresponding position for each measurement throughout the leaf (Figure 1xi).
- Determine the average cell length at each mm along the leaf axis by using a local polynomial smoothing procedure, implemented in an R-script (Figure 1xii; Supplementary File 1).
NOTE: The R-script provides a series of data with increasing smoothing. The amount of smoothing required is somewhat arbitrary and ideally should just remove the local noise, but not affect the overall curve. Make sure to use the same amount of smoothing for all samples within one experiment. - Average the cell length at each position between plants and calculate the standard error to create a cell length profile along the leaf axis.
5. Calculations of Kinematic Parameters (See Supplementary File 2)
- Calculate the LER by taking the change in leaf length between two successive time points (e.g., 24 hr, as in step 1.3) and dividing it by the time interval.
- Calculate the length of the growth zone (Lgz) corresponding to the position distal from the base where cells reach 95% of their mature cell length on the smoothened cell length profile.
- Take for each position on the smoothened cell length profile 95% of the average of all cell lengths following that position (Figure 2).
- Compare the smoothened cell lengths (step 4.4) with the calculated 95% cell length at each position. Starting from the base of the leaf, the growth zone ends at the position where the actual cell length equals 95% of the following cell lengths (Figure 2; see Supplementary Data 2).

Figure 2: Determining the end of the growth zone. Meristem: At the position indicated with a red star, the actual cell size is smaller than 95% (red dotted line) of the average cell size of all cells following this position (red solid line). The end of the growth zone (Lgz; indicated with a blue star) is located where 95% (dotted blue line) of the average cell size of all cells following this position (solid blue line) equals the actual cell size. Division zone (D), elongation zone (E), and mature zone (M). Dashed arrows indicate the convergence between the local size and 95% of the average size over the distal portion of the leaf when moving from the basal positions to the tip of the leaf. Please click here to view a larger version of this figure.
- Calculate the length of elongation zone (Lel) as the difference between the length of the growth zone (Lgz) and the meristem size (Lmer; determined in step 3).
- Calculate the mature cell length (lmat) as the average cell length in the mature zone.
- Divide the LER by lmat to obtain the cell production rate (P).
- Calculate the number of cells in the elongation zone (Nel) as the difference between Ngz and Nmer. The number of cells in the meristem (Nmer) equals the cumulative number of cells located in the intervals corresponding to the meristem. The number of cells in the growth zone (Ngz) equals the cumulative number of cells located in the intervals corresponding to the growth zone.
- Calculate the average cell division rate (D) as P/Nmer. The cell cycle duration (Tc) equals ln(2)/D.
- Calculate the time in the elongation zone (Tel) by dividing Nel by P. The time in the division zone equals log2(Nmer)*Tc. The length of cells leaving the meristem (ldiv) equals the cell length from the smoothened cell length profile at the end of the meristem.
- Calculate the average cell expansion rate (Rel) using following formula: ln(lmat)-ln(ldiv)]/Tel.
Here, we show a comparison between well-watered plants (control, 54% soil water content, (SWC)) and plants subjected to drought stress conditions (drought, 34% SWC) in terms of their leaf growth. All plants were grown in a growth chamber under controlled conditions (16 hr day/8 hr night, 25 °C/18 °C day/night, 300-400 µEm-2sec-1 photosynthetically active radiation (PAR). The drought conditions were established by withholding water until the correct SWC was reached and then further maintained. In a preliminary study, it was defined that the fifth leaf is the first one to emerge and develop under this stress condition. Therefore, it was chosen as the leaf of interest. The final Leaf Length (LL) of the drought-stressed plants was 40% lower than the one of the well-watered plants, which was due to a lower LER (Table 3). To understand the cellular basis of the leaf growth response, we performed a kinematic analysis. Overall, leaf elongation rate is a function of cell production in the meristem and mature cell size determined in the elongation zone (Figure 3). Therefore, the shortening of the leaf must be due to effects on one or both of these parameters. Our results show that while the mature cell length (lmat) was not affected, the cell production rate (P) was reduced by 71% (Table 3). lmat depends on the length of the cells leaving the meristem (ldiv), the time these cells spend in the elongation zone (Tel), and the relative cell expansion rate (Rel). No effect was observed for ldiv, while Rel was reduced by 67% in the drought conditions. This effect was compensated by the almost tripling of Tel, which resulted in the same lmat as in the control conditions. The decrease in cell production rate was, in turn, caused by both a lower average cell division rate (D) and a smaller number of cells in the meristem (Nmer). Length of the meristem (Lmer) was reduced in contrast to the length of the growth zone (Lgz), which was not affected significantly. In conclusion, these results show that in this case, cell number, unlike cell size, had a major role in determining leaf size.
| Kinematic parameters | C | D | % change C-D | p-value |
| LL | 727±15 | 436±23 | -40 | 0.000 |
| LER (mm/h) | 2.8±0.1 | 0.8±0.0 | -73 | 0.000 |
| lmat (μm) | 140±3 | 130±6 | -7 | NS |
| P (cells/h) | 20±1 | 6±0 | -71 | 0.000 |
| D (cells·cell-1·hr-1) | 0.028±0.003 | 0.010±0.001 | -63 | 0.000 |
| Tc (hr) | 26±3 | 71±7 | +173 | 0.000 |
| Tdiv (hr) | 249±27 | 656±71 | +164 | 0.000 |
| Lmer (mm) | 15±1 | 11±1 | -25 | 0.010 |
| Nmer | 740±31 | 590+20 | -20 | 0.000 |
| Rel (μm·μm-1·hr-1) | 0.043±0.002 | 0.014±0.001 | -67 | 0.000 |
| ldiv (μm) | 24±2 | 23±2 | -4 | NS |
| Tel (hr) | 42±2 | 125±11 | +199 | 0.000 |
| Nel | 844±54 | 735±65 | -13 | NS |
| Lgz (mm) | 68±1 | 61±5 | -11 | NS |
| Ngz | 1584±33 | 1326±66 | -16 | 0.010 |
Table 3. Kinematic analysis on cell division and cell expansion during the steady-state growth of the fifth leaf of well-watered plants and plants subjected to drought stress. Data are averages ± SE (n = 5, for LL: n = 10). Student's t-test was used as a statistical analysis. Parameters: leaf length (LL), leaf elongation rate (LER), mature cell length (lmat), cell production rate (P), cell division rate (D), cell cycle duration (Tc), time in division zone (Tdiv), length of the meristem (Lmer), number of cells in the meristem (Nmer), relative cell elongation rate (Rel), length of the cells leaving the meristem (ldiv), time in the elongation zone (Tel), number of cells in the elongation zone (Nel), length of the growth zone (Lgz), number of cells in the growth zone (Ngz), well-watered conditions (C), drought stress (D), and not significant (NS).
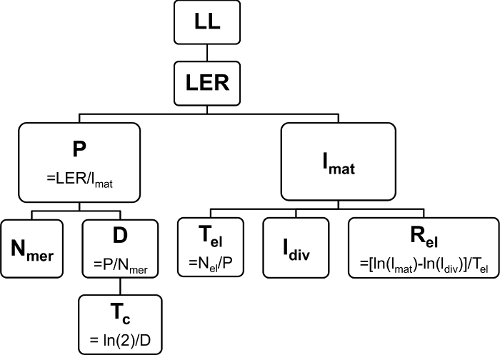
Figure 3: Relationship between the kinematic parameters. The final leaf length (LL) depends on the Leaf Elongation Rate (LER), which in turn depends on the cell production (P) and mature cell length (lmat). The number of cells in the meristem (Nmer) and the cell division rate (D) together determine P, with a cell cycle duration (Tc) as the inverse of D. Time in the elongation zone (Tel), length of cells leaving the meristem (ldiv), and the relative cell expansion rate (Rel) determine the mature cell length (lmat). The number of cells in the elongation zone (Nel). Please click here to view a larger version of this figure.
In addition to its application as a detailed analysis of organ growth, kinematic analysis provides a map of leaf growth zone localization and allows sampling with a subzonal resolution for molecular and biochemical analyses4,10,11. As an example, Figure 4A shows malondialdehyde (MDA) quantification along the growth zone of the maize leaf in plants subjected to the same conditions as above. MDA is a secondary metabolite formed during lipid peroxidation by ROS and reflects the levels of oxidative damage12. MDA was measured in every centimeter of the leaf, starting from its base, which allowed analysis of concentration changes along the growth gradient11. As the drought treatment caused 40% leaf shortening, the length of the developmental zones (meristem, elongation zone, and mature zone) in the control plants did not match the length of the same zones in the drought stressed plants (Figure 4B). As seen in Figure 4B, the meristem in the control plants was around 1.5 cm long, and the elongation zone spanned from 1.5 to 6.8 cm from the leaf base. In the stressed plants, the meristem was localized from 0 to 1.1 cm and the elongation zone from 1.1 to 6.1 cm. MDA levels and the whole growth zone were increased in drought-stressed plants compared to the control treatment. With the help of the kinematic analysis, we could conclude that MDA content was particularly increased in the mature zone for both control and drought treatments. Without knowing the sizes of the developmental zones, we would conclude that, under drought stress, the MDA content increases in an earlier developmental stage than in the control plants, which would be wrong as it does not take into account the shifting of the zones due to the leaf shortening. Therefore, performing kinematic analysis prior to the biochemical measurements was of crucial importance in order to interpret the data correctly.
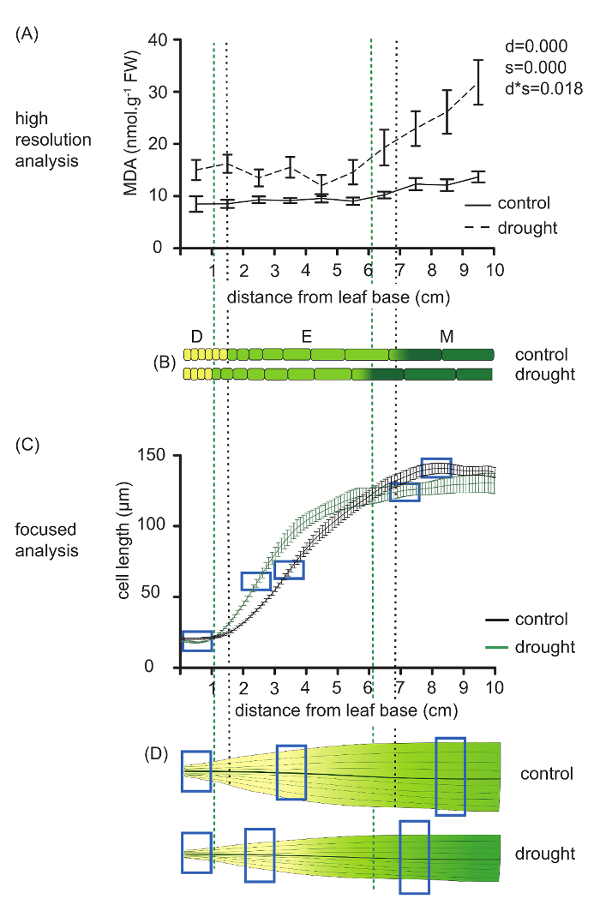
Figure 4: Example of high-resolution biochemical measurements and sampling for focused analysis. (A) Malonaldehyde (MDA) concentrations measured along the maize leaf growth zone (divided into ten segments) of plants grown in well-watered condition and plants subjected to drought treatment10. Data are averages ± SE (n = 5). Two-way ANOVA was used as a statistical analysis, and p-values are presented next to the graph panel (factors: drought (d) and segment (s)); FW: fresh weight. (B) Visualization of the different growth zones in control and drought-stressed plants. Division zone (D), elongation zone (E), and mature zone (M). Cells are magnified 125 times. (C) Cell-length profile of control and drought-treated plants. Data are averages ± SE (n = 5). (D) Differences in focused sampling in both control and drought-treated plants. The blue boxes indicate sampling position to compare the same developmental stage in both treatments. Please click here to view a larger version of this figure.
In addition to providing the possibility of comparing the same developmental zones in high-resolution studies, the kinematic analysis could also be used as a basis for more focused analyses, in which only samples of specific zones containing cells at the same developmental stage are taken. We compared the cell length profiles, provided by the smoothing of the microscopic cell length measurements, in the first ten centimeters from the leaf base of control and drought-stressed plants. Figure 4C shows that, using the cell length profile, we could determine the length of the developmental zones and could also follow the growth rate dynamics in both control and drought-stressed plants. This allowed specific sampling of proliferating cells in the meristem (before the steep increase), expanding cells in the elongation zone (in the middle of the steep increase) and young mature cells in the mature zone (beginning of the plateau). Our results show that, due to the leaf shortening in response to the drought, these zones did not correspond in the control and in the stressed plants. In order to sample proliferating, expanding, and young mature cells in control plants, we needed the first, fifth, and ninth centimeter from the leaf base, respectively. However, in the stressed plants, these segments correspond to the first, fourth, and eighth centimeter, respectively. This kind of more focused sampling has proven to be useful in the case of more laborious, expensive, or time-consuming studies, such as RNA-sequencing, proteomics, metabolomics, etc.
Supplementary File 1: R-script for polynomial smoothing procedure. Please right click to download this file.
Supplementary File 2: Calculations of kinematic parameters. Please right click to download this file.
