Bacteria may accumulate either detrimental or beneficial mutations during their lifetime. In a population of cells individuals that have accumulated beneficial mutations may rapidly outcompete their fellows. Here we present a simple procedure to visualize intraspecies competition in a bacterial cell population over time using fluorescently labeled individuals.
Many microorganisms such as bacteria proliferate extremely fast and the populations may reach high cell densities. Small fractions of cells in a population always have accumulated mutations that are either detrimental or beneficial for the cell. If the fitness effect of a mutation provides the subpopulation with a strong selective growth advantage, the individuals of this subpopulation may rapidly outcompete and even completely eliminate their immediate fellows. Thus, small genetic changes and selection-driven accumulation of cells that have acquired beneficial mutations may lead to a complete shift of the genotype of a cell population. Here we present a procedure to monitor the rapid clonal expansion and elimination of beneficial and detrimental mutations, respectively, in a bacterial cell population over time by cocultivation of fluorescently labeled individuals of the Gram-positive model bacterium Bacillus subtilis. The method is easy to perform and very illustrative to display intraspecies competition among the individuals in a bacterial cell population.
Soil bacteria are usually endowed with flexible regulatory networks and broad metabolic capacities. Both features enable the cells to adjust their catabolic and anabolic pathways to compete with their fellows and other microorganisms for the nutrients, which are available in a given ecological niche1. However, if the bacteria are unable to adapt to their environment other mechanisms may account for survival of a species. Indeed, as many bacteria proliferate fast and the populations can reach high cell densities subpopulations may have spontaneously accumulated beneficial mutations that provide the cells with a selective growth advantage and therefore increase their fitness. Moreover, mutational hotspots and stress-induced adaptive mutagenesis can facilitate the evolution of a maladapted bacterium2,3. Thus, accumulation of mutations and growth under continuous selection is the origin for the enormous microbial diversity, even within the same genus4,5. As in nature, shaping of bacterial genomes does also occur in the laboratory due to continuous cultivation under selection. This is exemplified by the domestication of the Gram-positive bacterium B. subtilis, which is used worldwide in basic research and in industry. In the 1940s B. subtilis was treated with DNA-damaging X-rays followed by cultivation under a specific growth condition6. The mutations that have accumulated in the bacteria during their domestication account for the loss of many growth characteristics, i.e. the B. subtilis laboratory strain 168 lost the ability to form complex colonies7,8.
Nowadays, for the best-studied model bacteria Escherichia coli and B. subtilis, a variety of powerful tools is available to genetically manipulate their genomes in order to address specific scientific questions. Sometimes the inactivation of a gene of interest causes a severe growth defect, which is then clearly visible on standard growth medium9. By contrast, mutations that cause a weak growth defect and thus only slightly affect fitness of the strain are often ignored. However, in both cases prolonged incubation and passaging of the mutant strains for several generations usually result in the accumulation of suppressor mutants that have restored the phenotype of the parent strain2,9. The characterization of suppressor mutants and the identification of the mutations that have restored the growth defect of the parent mutant strain is a very helpful approach that allows elucidation of important and often novel cellular processes10,11.
We are interested in the control of glutamate homeostasis in B. subtilis12. Similar to E. coli, B. subtilis responds to perturbation of glutamate homeostasis (i.e. block in glutamate degradation2) by the accumulation of suppressor mutants. The genomic alterations in these suppressor mutants that were acquired by spontaneous mutation were shown to rapidly restore glutamate homeostasis9,13. Therefore, it is not surprising that adaptation of B. subtilis to a specific growth condition during domestication of the bacterium is mirrored in enzyme synthesis and in the evolved enzymatic activities, which are involved in glutamate metabolism12. It has been suggested that the lack of exogenous glutamate in the growth medium during the domestication process was the driving force for the emergence and fixation of the cryptic glutamate dehydrogenase (GDH) gudBCR gene in the laboratory strain 1682,14. This hypothesis is supported by our observation that the reduced amount of GDH activity in the laboratory strain provides the bacteria with a selective growth advantage when exogenous glutamate is scarce2. Moreover, cultivation of a B. subtilis strain, synthesizing the GDH GudB, in the absence of exogenous glutamate results in the accumulation of suppressor mutants that have inactivated the gudB gene2. Obviously, the presence of a catabolically active GDH is disadvantageous for the cell because endogenously produced glutamate that could otherwise be used for anabolism is degraded to ammonium and 2-oxoglutarate (Figure 1). By contrast, when glutamate is provided by the medium, a B. subtilis strain equipped with high-level GDH activity has a selective growth advantage over a strain that synthesizes only one functional GDH. It is reasonable to assume that high-level GDH activity allows the bacteria to utilize glutamate as a second carbon source in addition to other carbon sources provided by the medium2 (see Figure 1). Thus, GDH activity strongly affects fitness of bacteria, depending on the availability of exogenous glutamate.
Here we present a very illustrative method to monitor and to visualize intraspecies competition between two B. subtilis strains that differ in a single locus on the chromosome (Figure 2). The two strains were labeled with the yfp and cfp genes encoding the fluorophores YFP and CFP, and cocultivated under different nutritional conditions. By sampling over time and by plating appropriate dilutions on agar plates the survivors in each of the cultures could be easily monitored using a common stereo fluorescence microscope. The procedure described in this paper is easy to perform and suitable to visualize the rapid clonal expansion and elimination of beneficial and detrimental mutations, respectively, in a cell population over time.
1. Preparation of Agar Plates, Culture Media, Cryostocks, and Precultures
2. Cocultivation of Bacteria, Sample Collection, and Sample Storage
3. Sample Treatment, Plating, and Incubation for Quantitative Analyses
4. Counting the Survivors by Stereo Fluorescence Microscopy for Quantitative Analysis
5. Sample Treatment and Microscopy for Semiquantitative Analyses
6. Data Analysis
7. Specific Tips: Dye Switch Experiment and Cocultivation of Isogenic Strains Labeled with cfp and yfp
The expression of either of the two fluorophore-encoding genes in B. subtilis might influence fitness and thus the growth rate of the bacteria. Therefore, it is recommended to perform the following experiments in order to exclude that the elimination of one competitor strain from the cell population during cultivation is simply due to a negative effect of the fluorophore:
The method described here was successfully applied to visualize intraspecies competition in a cell population consisting of B. subtilis strains that were labeled with the cfp and yfp genes encoding the fluorophores CFP and YFP, respectively. As shown in Figure 3, the method can be used to visualize intraspecies competition in a very illustrative manner. By spotting the samples on small areas, the clonal composition of the cell population was made visible at a glance. Although not appropriate for quantitative analyses, this approach is useful for roughly estimating the effect of different growth parameters (i.e. nitrogen source) on the development of a cell population that initially contained both strains in equal amounts (Figure 3). Moreover, in a small-scale approach the fitness of different B. subtilis strains that were cultivated under the same growth condition can be tested using a single agar plate. For quantitative analyses it is recommended to propagate the samples over the whole surface of an agar plate. This will prevent overlay of the colonies and thus allows the distinct identification and count of colonies that emerged from single cells. By plating appropriate dilutions on agar plates the clonal composition of a cell population over time can be precisely determined simply by counting the yellow and blue fluorescent colonies (see Figure 4). As we have previously reported, GDH activity strongly affects fitness of B. subtilis depending on the availability of exogenous glutamate2. Obviously, in the absence of exogenous glutamate high-level GDH activity is disadvantageous for the bacteria as the enzymes RocG and GudB degrade glutamate that is needed in anabolism (see Figure 1 and Figure 4A). By contrast, if provided to the bacteria, glutamate can serve as an amino group donor in transamination reactions. Moreover, glutamate can be fed into carbon metabolism and used as a source of energy due to the presence of the catabolically active GDHs RocG and GudB (Figure 1 and Figure 4B). As shown in Figures 4C and 4D, similar results were obtained in a dye-switch experiment. Again, bacteria equipped with high-level GDH activity were outcompeted by cells with reduced GDH activity in growth media lacking glutamate. By contrast, bacteria synthesizing only one active GDH were eliminated from the culture when the medium was supplemented with glutamate. As shown in Figures 5A and 5B, the initial composition of the mixed cell population remained almost constant over time. Thus, in the competition experiment the elimination of either of the two strains that were equipped with different amounts of GDH activity was not due to a growth defect caused by the fluorophores (see Figure 4). Taken together, the usage of fluorophores is a powerful tool for monitoring intraspecies competition in a bacterial cell population.
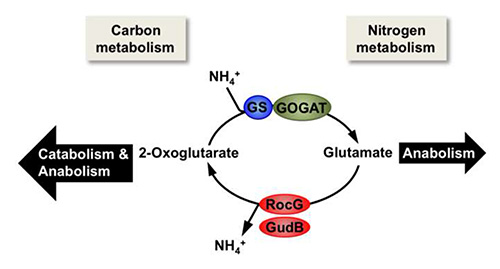
Figure 1. The link between carbon and nitrogen metabolism in B. subtilis. When glutamate is not provided by the medium, the major amino donor that is needed for anabolism is synthesized from ammonium and 2-oxoglutarate by the combined action of the glutamine synthetase (GS) and the glutamate synthase (GOGAT). By contrast, in the presence of exogenous glutamate the catabolically active GDHs RocG and/or GudB can degrade glutamate to ammonium and 2-oxoglutarate, which then serves as a carbon source.
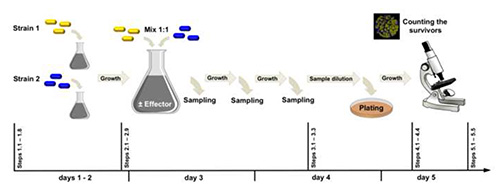
Figure 2. Experimental workflow. Strain 1 (labeled with yfp) and strain 2 (labeled with cfp) differ in one locus from each other. In the example presented here, we have compared the effect of exogenous glutamate (effector) on the genotypic shift of the cell population that initially contained 50% of rocG+ gudB+ (encoding two active GDHs) and 50% of rocG+ gudBCR (encoding one active GDH) cells. Click here to view larger image.
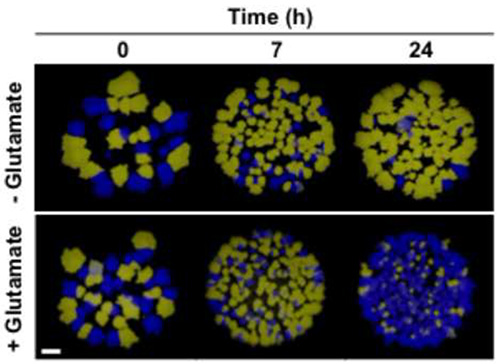
Figure 3. Semiquantitative approach to visualize intraspecies competition in a descriptive way (see section 5). Prior to cocultivation (0 hr), and after 7 hr and 24 hr of growth dilutions (10-4) of cells were spotted on SP agar plates. The surviving cells that have formed colonies after 12 hr of incubation at 37 °C were identified by stereo fluorescence microscopy. Exposure time, 0.6 sec; scale bar, 1 mm. This figure was modified from Gunka et al. 20132.
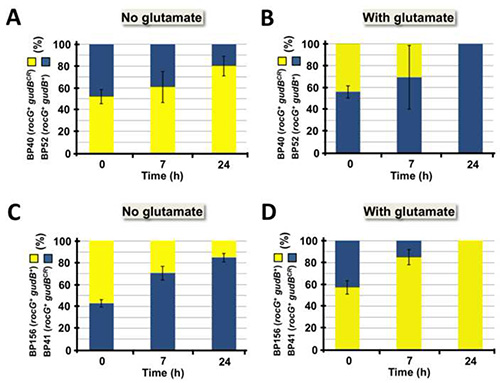
Figure 4. Quantification of intraspecies competition. After sample dilution and propagating the cells (see steps 3.1-3.3) on SP medium the plates were incubated overnight at 37 °C. Yellow and blue colonies were quantified as described in Protocols 4 and 6. The black error bars represent standard deviations for at least four independently repeated experiments. Each agar plate contained at least 100 countable colonies. (A) In the absence of exogenous glutamate the B. subtilis strain BP40 (yellow) equipped with only one functional GDH outcompetes strain BP54 (blue), which synthesizes both glutamate-degrading enzymes, RocG and GudB. (B) By contrast, synthesis of two functional GDHs is advantageous for the bacteria when exogenous glutamate is available because in addition to glucose, glutamate is used as a carbon source. As shown in (C) and (D), comparable results were obtained in a dye switch experiment. This figure was modified from Gunka et al. 20132. Click here to view larger image.
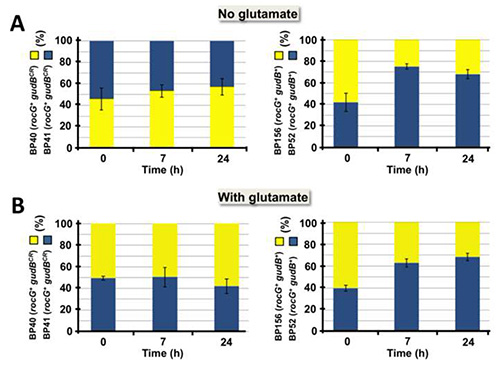
Figure 5. Control experiment to evaluate the effect of the fluorophore-encoding cfp and yfp genes on fitness of the bacteria. Mixed populations of the isogenic strains BP40 (rocG+ gudBCR amyE::yfp) and BP41 (rocG+ gudBCR amyE::cfp) or BP52 (rocG+ gudB+ amyE::cfp) and BP156 (rocG+ gudB+ amyE::yfp) were grown in the absence (A) and in the presence (B) of exogenous glutamate. The surviving cells were counted as described in Protocols 1-4 and 6, respectively. The bars represent standard deviations for at least four independently repeated experiments. This figure was modified from Gunka et al. 20132. Click here to view larger image.
Several methods have been developed to analyze competitive fitness of bacteria16. In many cases the bacteria were labeled with different antibiotic resistance cassettes17. Similar to our approach, labeling of the cells with antibiotic resistance cassettes allows the evaluation of competitive fitness of the bacteria during cocultivation under defined growth conditions. Moreover, this method can be used to determine competitive fitness of cells that differ from each other in a specific locus on the chromosome17. However, there are some disadvantages using antibiotic resistance cassettes to monitor competitive fitness. As the expression of the resistance genes is mostly driven by promoters having unequal strength the enzymes conferring resistance to the antibiotics are probably produced at different levels. Therefore, weak fitness effects may be not detectable with this approach. In our approach, both fluorophore genes were integrated with the same selection marker and their expression is driven by the same promoters2. Another disadvantage to monitor competitive fitness with antibiotic resistance cassettes might be that the approach is more laborious as two types of agar plates supplemented with the appropriate antibiotics are needed for the colony counting. Alternatively, fitness of bacteria can be determined by simply monitoring the growth rate and by the calculation of a so-called fitness index16. Obviously, this is the most precise approach because the bacteria are cultivated individually and toxic compounds that might be produced by a strain with a certain genotype will not affect growth of the competing strain. Moreover, there is no need to use antibiotics that might affect growth of the cells. However, both approaches are not very illustrative as the numbers describing competitive fitness can only be presented in a rather neutral way.
The use of fluorophore encoding genes to monitor and quantify intraspecies competition has several advantages over other methods. If both strains have integrated the fluorophore encoding genes by double homologous recombination into the chromosome, there is no need to use antibiotics in any of the cultivation steps. Therefore, samples that are taken from the culture during cultivation can be analyzed on the same growth medium and both strains are capable of growing. This approach allows visualization of intraspecies competition in a very illustrative way. Moreover, using this semiquantitative approach several growth conditions can be tested at the same time and many different strains can be compared in parallel. Finally, there is no need for fixation of the samples on microscope slides because the samples that were taken from the bacterial culture during cocultivation can be stored in a freezer18. Thus, all samples and replicates can be analyzed at the same time.
Two critical steps in our protocol have to be mentioned. It is important to note that the cryostocks should contain equal amounts of cells in the same growth phase of each competitor strain. An initial disproportion of the strains in the cryostocks and consequently in the shake flasks before starting the experiment will have a strong impact on the outcome of the competition experiment. Therefore, it is wise to check the composition of the cryostocks prior to the experiment. Moreover, an appropriate amount of cells should be evenly propagated over the plate. Otherwise the emerged colonies are too close to each other and a precise determination of the surviving cells will become difficult.
There are also some limitations and drawbacks of the fluorophore-based approach. Cocultivation in a multi-well plate reader and simultaneous detection of the CFP and YFP signals is not possible as the excitation and emission spectra of the fluorophores are too close to each other. However, this technical problem might be circumvented using different fluorescent proteins, such as those emitting green and red light, optimally based upon the same protein scaffold. Another drawback of the fluorophore-based approach could be that some mutations cause only a weak growth defect of the bacteria. Thus, if the growth defect that might be caused by either of the fluorophore-encoding genes is stronger than the growth defect caused by a certain mutation, the fluorophore-based approach is not appropriate to analyze intraspecies competition. Therefore, before creating a whole set of strains it is recommended to first label only the parent strain with both, cfp and yfp, and to cocultivate the strains. The growth experiments will reveal how strong the fluorophores affect fitness of the bacteria (see Figures 5A and 5B).
In the future it will be interesting to test whether the fluorophore-based approach to monitor intraspecies competition will be more accurate and less laborious if the surviving cells are counted using flow cytometry. Recently, flow cytometry has been shown to be a powerful tool to analyze the composition of B. subtilis biofilms19. Moreover, it might be more appropriate to analyze weak fitness effects that affect competitive fitness of bacteria by continuous cocultivation of the fluorophore-labeled bacteria in a fermenter. In contrast to shake flasks, this approach allows to keep the growth conditions constant and thus to monitor intraspecies competition over a long period of time.
The authors have nothing to disclose.
Work in the authors' lab was supported by the Deutsche Forschungsgemeinschaft (http://www.dfg.de; CO 1139/1-1), the Fonds der Chemischen Industrie (http://www.vci.de/fonds), and the Göttingen Centre for Molecular Biology (GZMB). The authors would like to acknowledge Jörg Stülke for helpful comments and critical reading of the manuscript.
(NH4)2SO4 | Roth, Germany | 3746 | – |
Agar | Difco, USA | 214010 | – |
Ammonium ferric citrate (CAF) | Sigma-Aldrich, Germany | 9714 | – |
CaCl2 | Roth, Germany | 5239 | – |
Glucose | Applichem, Germany | A3617 | – |
Glycerol | Roth, Germany | 4043 | – |
K2HPO4 x 3 H2O | Roth, Germany | 6878 | – |
KCl | Applichem, Germany | A3582 | – |
KH2PO4 | Roth, Germany | 3904 | – |
KOH | Roth, Germany | 6751 | – |
MgSO4 x 7 H2O | Roth, Germany | P027 | – |
MnCl2 | Roth, Germany | T881 | – |
MnSO4 x 4 H2O | Merck Millipore, Germany | 102786 | – |
NaCl | Roth, Germany | 9265 | – |
Nutrient broth | Roth, Germany | X929 | – |
Potassium glutamate | Applichem, Germany | A3712 | – |
Tryptone | Roth, Germany | 8952 | – |
Tryptophan | Applichem, Germany | A3445 | – |
Yeast extract | Roth, Germany | 2363 | – |
1.5 ml Reaction tubes | Sarstedt, Germany | 72,690,001 | – |
2.0 ml Reaction tubes | Sarstedt, Germany | 72,691 | – |
15 ml Plastic tubes with screw cap | Sarstedt, Germany | 62,554,001 | – |
Petri dishes | Sarstedt, Germany | 82.1473 | – |
1.5 ml Polystyrene cuvettes | Sarstedt, Germany | 67,742 | – |
15 ml Glass culture tubes | Brand, Germany | 7790 22 | – |
with aluminium caps | |||
100 ml Shake flasks with aluminium caps | Brand, Germany | 928 24 | – |
Sterile 10 ml glass pipettes | Brand, Germany | 278 23 | – |
Incubator (28 and 37 °C) | New Brunswick | M1282-0012 | – |
Standard pipette set (2-20 μl, 10-100 μl, 100-1000 μl) | Eppendorf, Germany | 4910 000.034, 4910 000.042, | – |
4910 000.042, | |||
4910 000.069 | |||
Table top centrifuge for 1.5 and 2 ml reaction tubes | Thermo Scientific, Heraeus Fresco 21, Germany | 75002425 | – |
Table top centrifuge for 15 ml plastic tubes | Heraeus Biofuge Primo R, Germany | 75005440 | – |
Standard spectrophotometer | Amersham Biosciences Ultrospec 2100 pro, Germany | 80-2112-21 | – |
Stereofluorescence microscope | Zeiss SteREO Lumar V12, Germany | 495008-0009-000 | – |
Freezer (-20 and -80 °C) | – | – | – |
Fridge (4 °C) | – | – | – |
Autoclave | Zirbus, LTA 2x3x4, Germany | – | – |
pH meter | pH-meter 766, Calimatic, Knick, Germany | 766 | – |
Vortex | Vortex 3, IKA, Germany | 3340000 | – |
Balance | CP2202S, Sartorius, Germany | replaced by | – |
CPA2202S | |||
Black pen (permanent marker) | Staedler, Germany | 317-9 | – |
Powerpoint program | Microsoft, USA | – | – |
Office Excel program | Microsoft, USA | – | Program for data processing |
Adobe Photoshop CS5 | Adobe, USA | replaced by CS6, download | Computer program for image processing |
Computer | PC or Mac | – | – |
ZEN pro 2011 software for the stereofluorescence microscope | Zeiss, Germany | 410135 1002 110 | AxioCam MRc Rev. Obtained through Zeiss |
Specific solution recipes | |||
SP medium | |||
8 g Nutrient broth | |||
0.25 mg MgSO4 x 7 H2O | |||
1 g KCl | |||
if required, add 15 g agar for solid SP medium | |||
ad 1 l with H2O, autoclave for 20 min at 121 °C | |||
1 ml CaCl2 (0.5 M), sterilized by filtration | |||
1 ml MnCl2 (10 mM) sterilized by filtration | |||
2 ml ammonium ferric citrate (CAF, 2.2 mg/ml), sterilized by filtration | |||
LB medium | |||
10 g Tryptone | |||
5 g Yeast extract | |||
10 g NaCl | |||
if required, add 15 g agar for solid LB medium | |||
ad 1 l with H2O, autoclave for 20 min at 121 °C | |||
C-Glc minimal medium | |||
200 ml 5 x C salts | |||
10 ml L-Tryptophan (5 mg/ml), sterilized by filtration | |||
10 ml ammonium ferric citrate (CAF, 2.2 mg/ml), sterilized by filtration | |||
10 ml III’ salts | |||
25 ml Glucose (20%), autoclaved for 20 min at 121 °C | |||
ad 1 l with sterile H2O | |||
CE-Glc minimal medium | |||
200 ml 5 x C salts | |||
10 ml L-Tryptophan (5 mg/ml), sterilized by filtration | |||
10 ml ammonium ferric citrate (CAF, 2.2 mg/ml), sterilized by filtration | |||
10 ml III’ salts | |||
20 ml Glutamate (40%) | |||
25 ml Glucose (20%), autoclaved for 20 min at 121 °C | |||
ad 1 l with sterile H2O | |||
5 x C salts | |||
20 g KH2PO4 | |||
80 g K2HPO4 x 3 H2O | |||
16.5 g (NH4)2SO4 | |||
ad 1 l with sterile H2O, autoclave for 20 min at 121 °C | |||
III’ salts | |||
0.232 g MnSO4 x 4 H2O | |||
12.3 g MgSO4 x 7 H2O | |||
ad 1 l with sterile H2O, autoclave for 20 min at 121 °C | |||
40% Glutamate solution | |||
200 g L-Glutamic acid | |||
adjust the pH to 7.0 by adding approximately 80 g KOH | |||
ad 0.5 l with sterile H2O, autoclave for 20 min at 121 °C | |||
0.9% Saline (NaCl) solution | |||
ad 1 l with sterile H2O, autoclave for 20 min at 121 °C | |||
50% Glycerol solution | |||
295 ml Glycerol (87%) | |||
ad 0.5 l with sterile H2O, autoclave for 20 min at 121 °C | |||
Bacteria (All strains are based on the Bacillus subtilis strain 168) | |||
Bacillus subtilis BP40 (rocG+ gudBCR amyE::PgudB-yfp) | Laboratory strain collection | ||
Bacillus subtilis BP41 (rocG+ gudBCR amyE::PgudB-cfp) | |||
Bacillus subtilis BP52 (rocG+ gudB+ amyE::PgudB-cfp) | |||
Bacillus subtilis BP156 (rocG+ gudB+ amyE::PgudB-yfp) |