Multicellular tumor spheroids (MCTS) are widely used three-dimensional (3D) models that form due to the tendency of adherent cells to aggregate and represent an important tool for gaining mechanistic insight into cancer cell biology. They can be generated from a broad range of cell types by numerous techniques, such as liquid-based and scaffold-based 3D cultures1. Their main advantage over monolayer 2D models is that they recapitulate the main features of in vivo tumors, namely structural organization and hypoxia, by mimicking the biological behavior of tumor cells, especially the mechanisms leading to therapeutic escape and drug resistance2. Thus, since MCTS can improve the predictability of toxicity and drug sensitivity, they are widely used to study cancers in 3D and could enhance the development of effective drugs for different types of cancer3.
To study any disease, there is a critical need for relevant and convenient models. Setting up models for cancer immunology studies is challenging because the immune system consists of multiple cell types. Each cell type has several subtypes and a broad spectrum of activation states. These different immune cell types interact with cancer cells and other tumor components, ultimately influencing the outcome of the disease. 2D in vitro cell culture methods fail to recapitulate these complex cellular interactions, as they lack translatability and are unable to predict the action of a drug at the system level (e.g., in tissues)4,5. Moreover, mouse models also have severe limitations due to the fundamental differences between the human and murine immune systems. 3D culture systems can, therefore, fill the current gaps in available models, providing an alternative method and improving our understanding of cancer immunology6. Specifically, spheroid models might be used for testing immunotherapies, mainly to assess the efficiency of drug screening and therapeutic antibodies for enhancing immune cell infiltration and anti-tumoral effects against the spheroid targets7. Furthermore, the potential of MCTS composed of cells in different metabolic and proliferative states to study the interactions between stroma cells (e.g., lymphocytes, macrophages, fibroblasts) and cancer cells and for the development of new anticancer strategies has been amply demonstrated8. Hence, there is a vital need to corroborate predictive and accurate platforms in order to boost the drug-testing process, taking into account the pathophysiology of the tumor microenvironment.
Breast cancer (BC) is the most frequent cancer diagnosed worldwide in women. The clinical classification of this heterogeneous disease is based on the presence of transmembrane receptors e.g., estrogen (ER) and progesterone (PR) receptors (collectively called hormone receptors, HR) along with the overexpression or amplification of the human epidermal growth factor receptor 2 (HER2) protein/oncogene. Based on the immunohistochemical expression of these receptors, four subtypes are commonly recognized: luminal A (HR+/HER2-), luminal B (HR+/HER2+), HER2-positive (HR-/HER2+) and triple-negative breast cancer (HR-/HER2-). The HER2+ group constitutes 10-15% of BC cases and is characterized by high HER2 expression with absence of ER and PR, having a worse prognosis compared to luminal tumors, and requiring specific drugs directed against the HER2/neu protein9.
BC development is a multi-step process, and an early diagnosis is essential for a successful treatment of the disease10. However, despite recently emerged personalized BC treatment options (e.g., endocrine and anti-HER2 antibody therapies), BC continues to challenge oncologists. Just like surgery, chemotherapy, and radiotherapy, these personalized therapies can also have severe adverse effects and patients can develop resistance to these agents, making it a long-term challenge to determine the best strategy11,12. Hence, improved understanding of the interplay between the tumor and its microenvironment is essential and expected to provide new directions for the development of novel treatments that are taking into account the specificities of the different BC subtypes13. A new wave of immunotherapies, such as antibody drug conjugates, adoptive T-cell therapies, vaccines and novel HER2-directed monoclonal antibodies (mAbs) are being studied in a broad population of patients with HER2-expressing tumors14.
Trastuzumab, for example, represents an efficient treatment modality for HER2+ BC. As part of its mode of action, Trastuzumab mediates fragment crystallizable gamma receptor (FcγR)-dependent activities. FcγRs are distinguished by their affinity for the Fc fragment and the immune response they initiate. Activating FcγRIIIa (CD16A) on natural killer (NK) cells is crucial for mediating antibody-dependent cellular cytotoxicity (ADCC), while triggering FcγRIIa (CD32A) and FcγRIIIa on macrophages induces antibody-dependent cellular phagocytosis (ADCP)15. Studies on animal models showed that mice lacking FcγRI (CD64) and FcγRIII (CD16) receptors were unable to initiate protective immune responses against tumor-specific antigens, revealing that ADCC is likely a major mechanism of action for the mAb Trastuzumab16.
Since NK cells resort to tumor cell-bound Abs for cancer cell killing by ADCC, expression of Fc receptors is critical for an efficient treatment with Trastuzumab17 (Figure 1). Moreover, their action is efficiently balanced by a stimulation of activating and inhibitory receptors, e.g., Killer-cell immunoglobulin-like (KIR) receptors18.
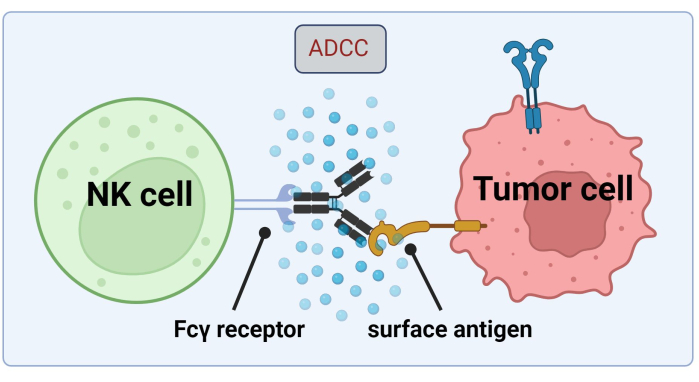
Figure 1. Mechanism of ADCC in the context of an antitumor response. The Fcγ receptor of a natural killer (NK) cell recognizes the Fc region of an antibody, which had previously bound to a surface antigen on a cancer cell. This immunological synapse leads to the degranulation of the NK cell which releases cytotoxic mediators such as granzymes and perforin. These molecules contribute to pore formation in the cell membrane and activate apoptotic pathways causing programmed cell death of the target cell (image created with Biorender.com). Please click here to view a larger version of this figure.
Immunotherapy development for HER2+ BC represents an evolving field. In this case, one should consider interactions between various components of the immune system. Furthermore, previous publications have extensively tested combination therapies involving all types of traditional, immune or cell therapies to identify synergizing combinations19.
Several 3D models of HER2+ BC have previously been used for drug discovery. For instance, Balalaeva et al. used SKBR-3 spheroids overexpressing HER2 to assess the cytotoxicity of the HER2-targeted immunotoxin 4D5scFv-PE4020. In another study, a 3D Matrigel-based HER2+ BC culture system was established to measure cell growth in response to Trastuzumab and endocrine agents21. These studies highlight the importance of tumor spheroid models of HER2 overexpressing cancer cells in representing an effective strategy to clinically improve therapeutic responses22.
Our group previously identified Sunitinib, a multitargeted tyrosine kinase inhibitor, as an inhibitor of Trastuzumab-dependent ADCC in JIMT-1 HER2+ BC cells in a 2D culture assay. The study revealed that Sunitinib induces autophagy and impairs NK cells killing function, downregulating HER2 expression and enhancing surface attachment of JIMT-1 cells17.
Here we established a novel 3D, spheroid ADCC model (NK.92.CD16+Trastuzumab+JIMT-1-EGFP cancer cells) to be used for high-throughput screening applications and, in order to validate the above-mentioned findings, Sunitinib was used as a model compound. First, we generated EGFP expressing JIMT-1 cells17 and grew spheroids from these cells. ADCC was induced by NK cells together with Trastuzumab, and spheroids were kept in culture in the presence or absence of test compounds for 24 h (Figure 2). Quantification of ADCC is based on the detection of apoptotic cancer cell death (Annexin V staining) using a High-Content Analysis system.
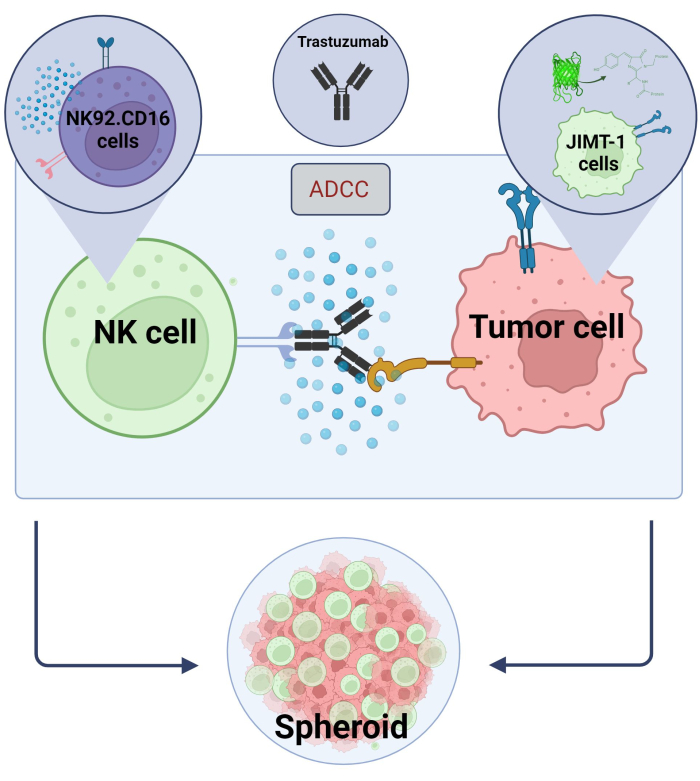
Figure 2. ADCC in a 3D spheroid co-culture system. Our experimental settings are based on a 3D spheroid system that can more accurately model the in vivo microenvironment compared to 2D models. JIMT-1 EGFP breast cancer cells were seeded on a concave cell repellent bottom to form a round-shaped cellular cluster, called spheroid. ADCC was then initiated by adding NK92.CD16 natural killer cells (E:T ratio = 20:1) and an anti-HER2 monoclonal antibody, Trastuzumab. The experimental model has proved efficient and easily applicable for the identification of ADCC modifying test compounds (image created with Biorender.com). Please click here to view a larger version of this figure.
We demonstrated that acquiring data in this manner can be done in real time and is statistically robust for the use in high-content screening in cancer drug discovery. Importantly, this model allows for an extended validation of a larger set of compounds, and it can be applied to several assays of interest.
EGFP expressing JIMT-1 cells were generated, and spheroids were grown from these cells. Sunitinib was used as a test compound as it was previously shown to affect the course of ADCC17. Spheroids were allowed to clump for 72 h. On day 3, 10 µg/mL of Trastuzumab (or equimolar 6.6 µg/mL TR-F(ab')219) and NK cells (20:1) were added to the spheroids in the presence or the absence of 20 µM Sunitinib (1 h pre-treatment), for a total time of 24 h. JIMT-1 alone and JIMT-1 co-incubated with NK cells (20:1) were used as CTLs. Spheroids were stained with Annexin V 647 for 1 h to detect apoptotic cell death and were then imaged with a High-Content Analyzer.
As indicated by Annexin V staining, addition of NK cells along with Trastuzumab to the JIMT-1 cells caused cell death in the tumor spheroids. Annexin positive (apoptotic) cells emerged in the peripheral zone of the spheroids as visible in Figure 3A. On the other hand, the addition of NK cells alone did not result in tumor cell apoptosis. To distinguish between the ability of Trastuzumab to recruit ADCC and its direct biological effect, TR-F(ab')2 lacking functional FcR binding capability was used as a negative control of Trastuzumab. Since TR-F(ab')2 was shown to be ineffective in this model (Figure 3B), the effect is likely to be mediated via ADCC. Moreover, pretreatment with Sunitinib reduced Annexin V staining in the spheroids, confirming Sunitinib-induced ADCC resistance and revealing the prevention of apoptotic cell death in JIMT-1 spheroids co-incubated with NK cells and Trastuzumab.
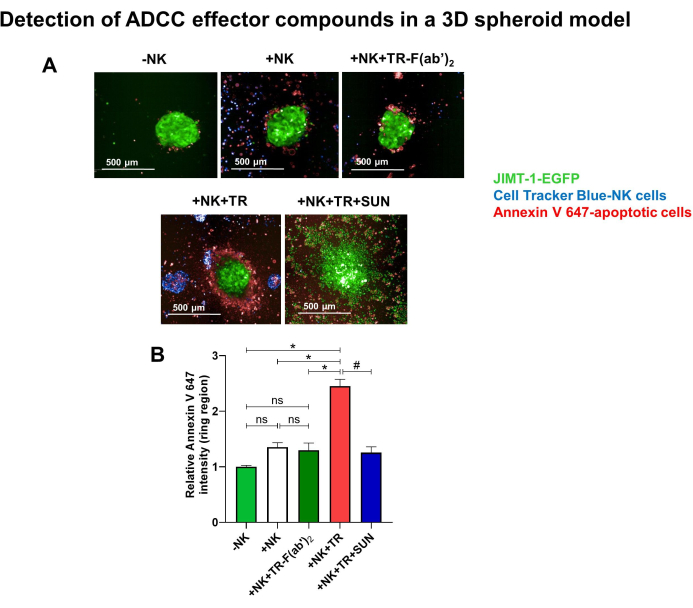
Figure 3. Detection of ADCC effector compounds in a 3D spheroid model. Tumor spheroids were generated with JIMT-1-EGFP cells. After an incubation time of 3 days, spheroids were transferred to a HCS plate, previously coated with Pluronic F-127 to prevent cell attachment. On the next day, 10 µg/mL Trastuzumab (TR) (or equimolar 6.6 µg/mL TR-F(ab')2 as negative CTL) and NK92.CD16 cells (pre-stained with Cell Tracker Blue) were added to the wells (E:T ratio of 20:1), in the absence or the presence of 20 µM Sunitinib (SUN). JIMT-1 spheroids alone and JIMT-1 spheroids co-incubated with NK cells (20:1) were used as CTLs. (A) After an incubation time of 24 h, Annexin V 647 (red color) was used to stain the spheroids for 1 h to visualize apoptotic cells. (B) Images of 3 spheroids/condition were taken and analyzed for the fluorescence intensity of Annexin V 647 in the peripheral area of the spheroids (ring region). Histogram shows 4 independent experiments (means±SEM). Data were analyzed with Kruskal-Wallis test followed by Dunn's post-hoc test (*p < 0.05, #p < 0.05, ns: not significant). Please click here to view a larger version of this figure.
These data confirm that Sunitinib inhibits ADCC. ADCC enhancing compounds are expected to be identified in a similar fashion. In summary, our HCS assay may be suitable for the identification of compounds affecting ADCC.
Supplementary Figure S1. Optimization of the E:T ratio and the Trastuzumab concentration. JIMT-1-EGFP cells were used to generate spheroids. On day 3, spheroids were transferred to a HCS plate and NK cells were added at different E:T ratios (20:1, 40:1 and 60:1) with 10, 20 and 50 µg/mL Trastuzumab (TR) to see which was the most effective treatment that could induce cell death in the spheroids. Control (JIMT-1-EGFP) was treated with JIMT-1 cell culture media. (A) After 24 h, cells were stained with Annexin V 647 (red color) for 1 h and apoptotic cell death was measured with HCA. Histograms show 3 independent experiments (means±SEM). The columns represent the intensity of Annexin V 647 around the JIMT-1 spheroids. (B) Images of 3 spheroids/condition were analyzed for the Annexin V 647 intensity of the ring region. Data were analyzed using one-way ANOVA followed by Tukey's post-hoc test (*p < 0.05, **p < 0.01, ns: not significant). Please click here to download this File.
Supplementary Figure S2. Evaluation of JIMT-1 cell apoptosis in the spheroids. JIMT-1-EGFP cells were used to generate spheroids. On day 3, spheroids were transferred to a HCS plate and were pre-treated with 20 µM Sunitinib (SUN) for 1 h, then NK cells were added at 20:1 E:T ratio with 10 µg/mL Trastuzumab. After 24 h, cells were stained with Annexin V 647 for 1 h and apoptotic cell death was measured with HCA. Images of 3 spheroids/condition were analyzed for the Annexin V 647 intensity (control: JIMT-1-EGFP, ADCC: 20:1 NK cells+10 µg/mL Trastuzumab, ADCC+SUN: 20 µM Sunitinib+20:1 NK cells+10 µg/mL Trastuzumab). The columns represent the intensity of Annexin V 647 around the JIMT-1 spheroids (ring) (A), in the whole spheroid (B), and in the whole well (C). Histograms show 3 independent experiments (means±SEM). Data were analyzed using one-way ANOVA followed by Tukey's post-hoc test (*p < 0.05, **p < 0.01, ns: not significant). Please click here to download this File.
| 96-well glass bottom Cell Carrier Ultra microplates | PerkinElmer, Waltham, MA, USA | LLC 6055302 | for spheroids measurements |
| 96-well tissue culture plates | TPP | 92096 | for cell seeding |
| α-MEM medium | Sigma | M8042 | in NK medium |
| Agarose | Sigma | A9539 | for spheroids seeding |
| Annexin V-Alexa Fluo 647 conjugate | Invitrogen-ThermoFisher Scientific | A23204 | for apoptosis measurement with HCS |
| CD16.176 V.NK-92 cells | Dr. Kerry S. Campbell (the Fox Chase Cancer Center, Philadelphia, PA on behalf of Brink Biologics, Inc. San Diego, CA) | ATCC CRL-2407 | for cell culture |
| Cell Tracker Blue | Invitrogen-Thermo Scientific, Waltham, MA, USA) | C2110 | for staining of NK cells |
| DMEM/F-12 medium | Sigma | D8437 | in JIMT1-EGFP medium |
| Dimethyl sulfoxide (DMSO) | Sigma | D8418 | for coating HCS plate before transfering the spheroids |
| Fetal bovine serum (FBS) | Biosera | FB-1090/500 | JIMT-1-EGFP and NK medium |
| Glutamine | Gibco | 35,050–061 | in NK medium |
| GraphPad Prism 8.0.1 | GraphPad Software Inc., San Diego, CA, USA | for statistical analysis | |
| Harmony software | PerkinElmer, Waltham, MA, USA | for HCA | |
| IL-2 | Proleukin, Novartis Hungária Kft., Budapest, Hungary | PHC0026 | in NK medium |
| Insulin (Humulin R) | Eli Lilly | HI0219 | JIMT-1-EGFP medium |
| JIMT-1 breast cancer cells | for cell culture | ||
| MEM Non-essential Amino Acids (MEM-NEAA) | Gibco | 11,140–050 | in NK medium |
| Na-pyruvate | Lonza | BE13-115E | in NK medium |
| Opera Phenix High-Content Analysis equipment | PerkinElmer, Waltham, MA, USA | HH14001000 | for HCA |
| PBS (Posphate buffered saline) | Lonza | BE17-517Q | for washing the cells |
| Penicillin-Streptomycin | Biosera | LM-A4118 | JIMT-1-EGFP and NK medium |
| pLP-1, pLP-2, pLP-VSV-G, pWOXEGFP | Invitrogen, (Prof. József T zsér, University of Debrecen) zsér, University of Debrecen) |
for JIMT-1-EGFP cell line | |
| Pluronic-F127 | Sigma | P2443 | for coating HCS plate before transfering the spheroids |
| Sunitinib malate | SigmaAldrich | PZ0012 | for treatments |
| Trastuzumab Ab (humanized anti-HER2 monoclonal antibody) | Herzuma®, EGIS Pharmaceuticals, Budapest, Hungary | NDC-63459-303-43 | for treatments |
| Trastuzumab-F(ab')2 | Gift from Prof. György Vereb and Árpád Ször |
Department of Biophysics and Cell Biology, University of Debrecen | for treatments |
| Trypan blue 0.4% solution | Sigma | T8154 | for cell counting |
| Trypsin-EDTA 1X in PBS | Biosera | LM-T1706 | for cells detachment |
