NOTE: The protocol is applicable to different plant tissues. Rice sheath and leaf discs were used in this protocol for ROS detection upon PAMP elicitation. As differences mainly arise due to the method of sampling, only the common procedures are described below, with specific steps being mentioned wherever necessary.
1. Plant culture
- Sterilize the dehusked rice seeds with 70% ethanol for 1 min, then with 40% sodium hypochlorite (NaClO) for 1 h. Then, rinse the seeds 5x with sterile water to remove residual chlorine.
- Plate the seeds aseptically on 1/2 MS medium (2.37 g/L Murashige and Skoog (MS) medium, 30 g/L sucrose, 2.1 g/L phytagel, pH 5.7, autoclaved).
- In the rice sheath method, directly plate the seeds in the sterile glass vessel with MS medium.
- In the leaf disc method, plate the seeds on MS plates for 5-7 days and transplant them to growth matrix or soil (Figure 1A).
- Grow the seedlings in a growth room with a 12 h light/12 h dark photoperiod.
2. Tissue preparation and pretreatment
- Rice sheath
- Cut the sheath from 10-day-old rice seedlings into 3 mm segments with a sharp razor blade or surgical blade for pretreatment 1 day before the ROS assay (Figure 1B).
- Place five sheath segments in an individual well of a 96-well microtiter plate containing 100 µL of ddH2O for 10-12 h, in the dark at 25 °C, which allows wound injury-related ion leakage and defense responses to abate (Figure 2).
NOTE: Taking care to keep the cuts vertical to ensure a consistent cutting surface area exposed to the elicitation solution is an important step to obtain highly reproducible results. Move the segments gently. Do not make extra cuts or wounds on the segments, which could be a source of data variation. As a principle, each test must contain at least five replicates since the variation of the ROS value is large. The more replicates set, the more reliable the data are.
- Leaf disc
- Cut the leaf discs (4 mm in diameter) from 4-6-week-old rice plants using a biopsy punch with a plunger. Always cut leaf discs from the middle third of the second leaf (numbered from the top) of the main tiller to reduce data variation (Figure 1C).
- Place one leaf disc in an individual well of a 96-well microtiter plate containing 100 µL of ddH2O for 10-12 h for pretreatment, which allows wounding-related responses to abate as these could interfere with the induction of ROS by PAMPs (Figure 2).
NOTE: Operate the leaf discs gently. Do not make extra cuts or wounds on the discs in the experiment, which could result in data variation. The induction of ROS mostly occurs from the cells of the cut edge, since the surfaces of rice tissues (leaves or sheaths), are covered with hydrophobic layers. Only the cells of the cut edges are in contact with the elicitation solution (refer to the discussion section). - Keep all the leaf disks floating, with the abaxial surface facing up, in the wells of a microtiter plate for water pretreatment to avoid leaf side-associated variation.
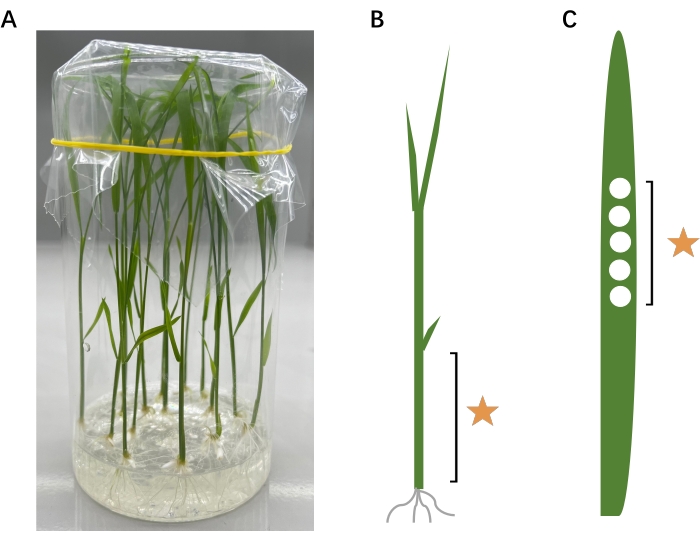
Figure 1: The growth condition and stages of rice seedlings for sheath sampling and parts of the rice sheath and rice leaves used in the assay. (A) Rice seedlings grown on 1/2 MS medium under sterile conditions for 10 days can be sampled for ROS assay. Sterilized rice seeds were cultured on 1/2 MS medium and grown in a 12 h light/12 h dark photoperiod in clear glass vial, 8.5 cm in diameter and 15 cm in height. (B) Schematic diagram of the sampling parts of leaf sheaths. Leaf sheaths were cut from 10-day-old rice seedlings. The positions of leaf sheaths were above the roots and below the first leaf. (C) Schematic diagram of the sampling position of leaf discs. The leaf discs can be cut from the middle third of the second leaf (count from the top) of the main tiller of healthy rice plants at any growth stage. Abbreviations: ROS = reactive oxygen species; MS = Murashige and Skoog. Please click here to view a larger version of this figure.
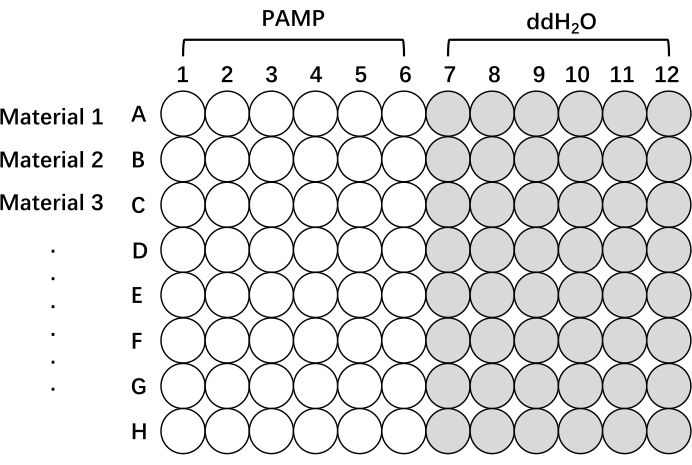
Figure 2: Schematic diagram of the plate setup for measuring ROS production with different lines of Oryza sativa. Pretreatment and test of rice tissues using a 96-well plate. Line 1, Line 2, and Line 3 (up to eight lines on one plate) can be any material of interest, different cultivars, mutants, or transgenic lines. The tissues were stimulated with elicitation solutions with PAMP (PAMP, white) or without PAMP (ddH2O, gray) to measure ROS response. It should be noted that the more the samples to be tested, the longer the time interval between readings. Abbreviations: ROS = reactive oxygen species; PAMP = pathogen-associated molecular pattern; ddH2O = double-distilled water. Please click here to view a larger version of this figure.
3. Preparing the elicitation solution
- Dissolve L-012 powder into 20 mM (6.23 mg/mL) aqueous solution with ddH2O to make the stock solution. Then, dilute the stock solution with 50 mM Tris HCl buffer (pH 7.5) to make the working solution at the final concentration of 500 µM L-012. Keep the stock solution frozen and dilute to the working solution before use.
- Prepare the elicitation solution containing PAMP, L-012, and horseradish peroxidase (HRP; 10 mg/mL in ddH2O). For a 10 mL elicitation solution, mix 9.4 mL of 50 mM Tris HCl (pH 7.5) solution, 400 µL of the L-012 solution, 100 µL of HRP, and 100 µL of flg22 (PAMP; 10 mM in ddH2O). For the negative control, add 100 µL of ddH2O instead of PAMP.
NOTE: Keep the prepared elicitation solutions at room temperature to avoid cold stress to rice tissues. Other PAMPs can also be used for treatment as required, such as chitin (20 ng/mL in final concentration). Since L-012 is light-sensitive, cover all the tubes containing L-012 solution with aluminum foil.
4. Starting the software and setting up the protocol with the referenced microplate reader (see Table of Materials)
NOTE: It takes some time to set up the parameters of the microplate reader software. It is recommended to get the machine and protocol ready (one click to proceed) before adding the elicitation solution.
- Start the software. Click the Experiments button to create a new protocol or use an existing protocol.
- Click Procedura in the pop-up to set up the plate. Select the wells from the plate to be monitored.
- Click Start Kinetic to set up the total run time and reading interval. Set the Run time to 35 min or longer, depending on the experimental requirements. To obtain readings as frequently as possible, select Minimum Interval. For integration time, choose 1 s or longer, depending on the signal intensity.
NOTE: The reading interval depends on the number of samples and signal integration duration. - Click Validate | OK to confirm the settings.
- Click on Detect the new plate in the pop-up and wait for the software to prompt the load plate dialog box. Place the plate to be tested on the carrier.
- Stop here to wait for the elicitation system to be established (in the next section). As soon as the elicitation system is ready, click on Run to start the reading.
5. Establishing the elicitation system and measuring real-time ROS production
- Carefully remove the ddH2O from the wells containing the pretreated tissues, avoiding any tissue damage or desiccation.
- Use a multichannel pipette to add 200 µL of the elicitation solution to the wells containing the tissues.
- Gently shake to mix. Click Run to begin detection.
NOTE: With PAMP treatment, plant tissues respond and produce ROS very quickly. Therefore, it is suggested that the negative control without PAMP be treated first to reduce the operation time, when there are multiple treatments. Operate as quickly as possible to reduce the elicitation delay between treatments. The shorter the time between the addition of the elicitation solution and the start of detection, the better the capture of important experimental data will be.
Here, we take rice material as an example to determine the ROS produced with flg22 treatment. The generation of ROS after elicitation is transient. In rice, the increase in ROS production was first detected in 1-2 min, peaked at 10-12 min, and returned to the baseline in ~30-35 min (Figure 3). Compared to the control test, in which PAMP was absent in the elicitation solution resulting in no obvious ROS induction, a specific ROS burst was induced only when the elicitation solution containing flg22, or other PAMP, such as chitin. Meanwhile, the total amount of ROS can be calculated from the curve (Figure 4).
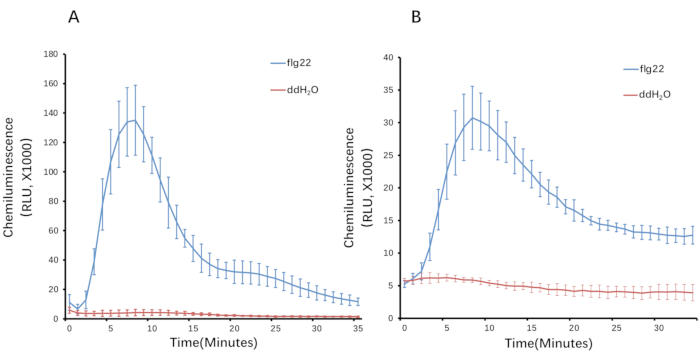
Figure 3: ROS induction in rice tissues. (A) Leaf discs (4 mm in diameter) and (B) 3 mm long sheaths were used to induce ROS by flg22. ROS generation is monitored for 35 min. Bars indicate the means of SD calculated from five technical repeats. The reading data were imported into a spreadsheet. Apply the formulas "AVERAGE" and "STDEV. P" to the dataset to calculate the average value and standard error, respectively, from the replicates for each data point. Then, the curves were generated from the ROS values (average value and standard error). Abbreviations: ROS = reactive oxygen species; flg22 = 22-amino acid flagellin peptide; ddH2O = double-distilled water; RLU = relative luminescence units. Please click here to view a larger version of this figure.
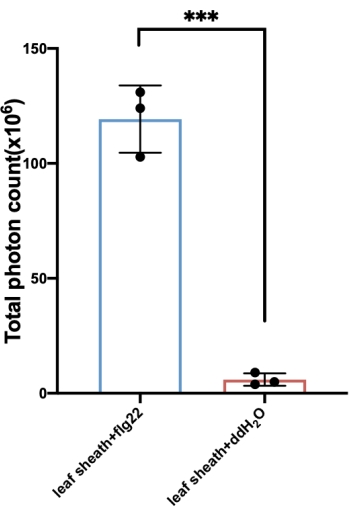
Figure 4: The total amount of ROS generated with the sheath. The total amount of ROS is usually calculated from the curve obtained from the test. The total ROS amounts shown here were calculated from the curve corresponding to Figure 3A. To obtain the total amount of ROS values, apply the formula "= (y̅ n+  n + 1) × time interval/2" to the corresponding datasets to calculate the ROS generated at each time interval, which can be combined by applying the formula "SUM" to calculate the total amount generated. Abbreviations: ROS = reactive oxygen species; flg22 = 22-amino acid flagellin peptide; ddH2O = double-distilled water. Please click here to view a larger version of this figure.
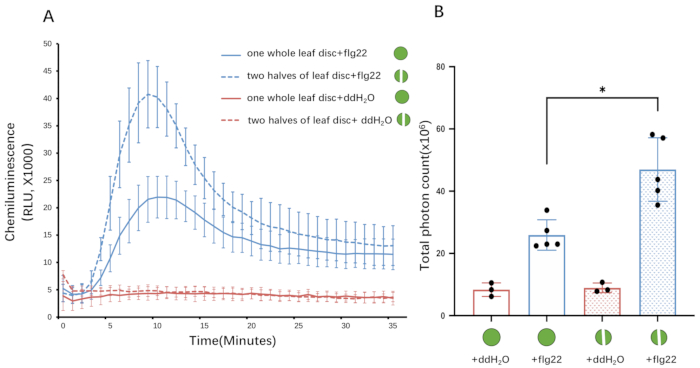
Figure 5: ROS production in the exposed cells of the cut edge. A single whole or two halves of a leaf disc were placed into the wells of a 96-well microtiter plate, pretreated with 100 µL of ddH2O for 10-12 h, and then treated with flg22 for ROS induction. The reading values from the two half-disc samples are much higher than that from the whole leaf disc (A). On average, the total values from the two half-disc samples are ~1.6 times that from the whole leaf disc (B), which is proportional to the edge length, not to the area, of the samples. This result supports that ROS are mainly generated in cells at the wound site. Abbreviations: ROS = reactive oxygen species; flg22 = 22-amino acid flagellin peptide; ddH2O = double-distilled water. Please click here to view a larger version of this figure.
