The present protocol describes generating 3D tumor culture models from primary cancer cells and evaluating their sensitivity to drugs using cell-viability assays and microscopic examinations.
Despite remarkable advances in understanding tumor biology, the vast majority of oncology drug candidates entering clinical trials fail, often due to a lack of clinical efficacy. This high failure rate illuminates the inability of the current preclinical models to predict clinical efficacy, mainly due to their inadequacy in reflecting tumor heterogeneity and the tumor microenvironment. These limitations can be addressed with 3-dimensional (3D) culture models (spheroids) established from human tumor samples derived from individual patients. These 3D cultures represent real-world biology better than established cell lines that do not reflect tumor heterogeneity. Furthermore, 3D cultures are better than 2-dimensional (2D) culture models (monolayer structures) since they replicate elements of the tumor environment, such as hypoxia, necrosis, and cell adhesion, and preserve the natural cell shape and growth. In the present study, a method was developed for preparing primary cultures of cancer cells from individual patients that are 3D and grow in multicellular spheroids. The cells can be derived directly from patient tumors or patient-derived xenografts. The method is widely applicable to solid tumors (e.g., colon, breast, and lung) and is also cost-effective, as it can be performed in its entirety in a typical cancer research/cell biology lab without relying on specialized equipment. Herein, a protocol is presented for generating 3D tumor culture models (multicellular spheroids) from primary cancer cells and evaluating their sensitivity to drugs using two complementary approaches: a cell-viability assay (MTT) and microscopic examinations. These multicellular spheroids can be used to assess potential drug candidates, identify potential biomarkers or therapeutic targets, and investigate the mechanisms of response and resistance.
In vitro and in vivo studies represent complementary approaches for developing cancer treatments. In vitro models allow for the control of most experimental variables and facilitate quantitative analyses. They often serve as low-cost screening platforms and can also be used for mechanistic studies1. However, their biological relevance is inherently limited, as such models only partially reflect the tumor microenvironment1. In contrast, in vivo models, such as patient-derived xenografts (PDX), capture the complexity of the tumor microenvironment and are more suitable for translational studies and individualizing treatment in patients (i.e., investigating the response to drugs in a model derived from an individual patient)1. However, in vivo models are not conducive to high-throughput approaches for drug screening, as the experimental parameters cannot be controlled as tightly as in in vitro models and because their development is time-consuming, labor intensive, and costly1,2.
In vitro models have been available for over 100 years, and cell lines have been available for over 70 years3. During the last several decades, however, the complexity of the available in vitro models of solid tumors has increased dramatically. This complexity ranges from 2-dimensional (2D) culture models (monolayer structures) that are either tumor-derived established cell lines or primary cell lines to the more recent approaches involving 3-dimensional (3D) models1. Within the 2D models, a key distinction is between the established and primary cell lines4. Established cell lines are immortalized; therefore, the same cell line can be used globally over many years, which from a historical perspective, facilitates collaboration, the accumulation of data, and the development of many treatment strategies. However, genetic aberrations in these cell lines accumulate with every passage, thus compromising their biological relevance. Furthermore, the limited number of available cell lines does not reflect the heterogeneity of tumors in patients4,5. Primary cancer cell lines are derived directly from resected tumor samples obtained via biopsies, pleural effusions, or resections. Therefore, primary cancer cell lines are more biologically relevant as they preserve elements of the tumor microenvironment and tumor characteristics, such as intercellular behaviors (e.g., cross-talk between healthy and cancerous cells) and the stem-like phenotypes of cancer cells. However, the replicative capacity of primary cell lines is limited, which leads to a narrow culture time and limits the number of tumor cells that can be used for analyses4,5.
Models using 3D cultures are more biologically relevant than 2D culture models since the in vivo conditions are retained. Thus, 3D culture models preserve the natural cell shape and growth and replicate elements of the tumor environment, such as hypoxia, necrosis, and cell adhesion. The most commonly used 3D models in cancer research include multicellular spheroids, scaffold-based structures, and matrix-embedded cultures4,6,7.
The present protocol generates 3D tumor culture models (multicellular spheroids) from primary cancer cells and evaluates their sensitivity to drugs using two complementary approaches: a cell-viability assay (MTT) and microscopic examinations. The representative results presented herein are from breast and colon cancer; however, this protocol is widely applicable to other solid tumor types (e.g., cholangiocarcinoma, gastric, lung, and pancreatic cancer) and is also cost-effective, as it can be performed in its entirety in a typical cancer research/cell biology lab without relying on specialized equipment. The multicellular spheroids generated using this approach can be used to assess potential drug candidates, identify potential biomarkers or therapeutic targets, and investigate the mechanisms of response and resistance.
This protocol is divided into three sections: (1) the generation, collection, and counting of the spheroids in preparation for their use as a model for testing drug efficacy; (2) MTT assay to assess drug efficacy on the spheroids; and (3) the microscopic evaluation of morphological changes following the treatment of the spheroids with drugs as another approach for evaluating drug efficacy (Figure 1).
The collection of human tumor samples used for the primary tumor cell cultures was performed as per institutional review board (IRB)-approved protocols at the Rabin Medical Center with written informed consent from the patients. Patients eligible for participation in the study included male and female adult and pediatric cancer patients with non-metastatic breast, colon, liver, lung, neuroendocrine, ovary, or pancreatic cancer, any pediatric cancer, or any metastatic cancer. The only exclusion criterion was the lack of capacity to provide informed consent.
1. Generation and collection of spheroids
NOTE: The isolation of primary tumor cells can be performed as described by Kodak et al.8. Importantly, primary tumor cells used for generating the spheroids can be derived directly from patient samples obtained by biopsy, resection, etc., or indirectly using tumor samples from patient-derived xenograft (PDX) models, as described by Moskovits et al.9.
2. Drug efficacy assay (MTT assay)
NOTE: For details, please see van Meerloo et al.13. Also, for the MTT assay, only the cell culture medium and not the "3D culture medium" must be used (adding the basement membrane matrix is not necessary and could potentially interfere with the MTT assay).
3. Monitoring and analyzing the morphological changes in the spheroids
NOTE: As for the MTT assay, only the cell culture medium and not the "3D culture medium" should be used in this evaluation (adding the basement membrane matrix is not necessary and could potentially interfere with the analysis).
This protocol presents procedures for generating a homogenous culture of spheroids from primary tumor cells, quantitatively evaluating drug efficacy on spheroid culture (MTT assay), and determining the effect of study drugs on spheroid morphology. Data from the representative experiments in spheroids generated from colon and breast cancer cell cultures are presented. Similar experiments were performed using other tumor types, including cholangiocarcinoma, gastric, lung, and pancreatic cancer (data not shown). All the experiments presented herein were performed in triplicate.
Figure 2 shows the spheroids that were generated from the primary colon cancer cell culture. As seen in Figure 2, the number of spheroids generated depends on the number of cells initially seeded in each well. The growth of the spheroids to over 100 μm in diameter took 10-14 days. The origin of the tumor cells (e.g., different patients and different origins) determined the growth rate. Seeding the wells with more cells did not shorten the time required for spheroid generation but rather increased the number of spheroids formed. Notably, upon prolonged culture of the colon cancer spheroids, they started attaching to each other and formed clusters of spheroids in grape-like structures (Figure 3), which prevented a homogenous culture and, thus, prohibited the use of the spheroids in the MTT assays.
Figure 4 presents the effect of three treatments (10 μM palbociclib, 10 μM sunitinib, and their combination at 10 μM each) on the viability of spheroids derived from two primary cancers. In this case, a PDX model was established first, and the tumor cells used for the spheroid analysis were derived from the PDX model9. The first PDX model was established using a colon cancer sample from a 50 year old male patient, and the second using a breast cancer sample from a 62 year old female. As demonstrated in Figure 4A,B, after 3 days of treatment, the combination of palbociclib plus sunitinib led to a significant reduction in viability as measured by the MTT assay. As demonstrated in Figure 4C,D, the morphological changes occurring with treatment were very clear. On Day 0, all the spheroids were intact. In contrast, on Day 3, the spheroids treated with the control (DMSO) were still intact, whereas the spheroids treated with the combination were disassembled, and their morphology was "open", with cells detaching from the solid structure, suggesting the destruction of the spheroid structure.
Figure 5 presents the follow-up of the spheroids over time. These spheroids, generated from breast cancer cells derived from a 44 year old female patient, were treated with one of two combinations (trastuzumab [10 μg/mL] plus vinorelbine [1 μg/mL], or 5-fluorouracil [200 μM] plus cisplatin [300 μM]). As shown in Figure 5A, the size of the spheroids treated with 5-fluorouracil plus cisplatin was reduced by Day 3, and the spheroids were completely destroyed by Day 7. In contrast, the treatment with trastuzumab plus vinorelbine had only a minor effect on the morphology of the spheroids (e.g., some level of an "open" structure), but the effect was not significant. Figure 5B presents the average change in the diameter of the spheroids relative to Day 0 (five spheroids were followed in each treatment group).
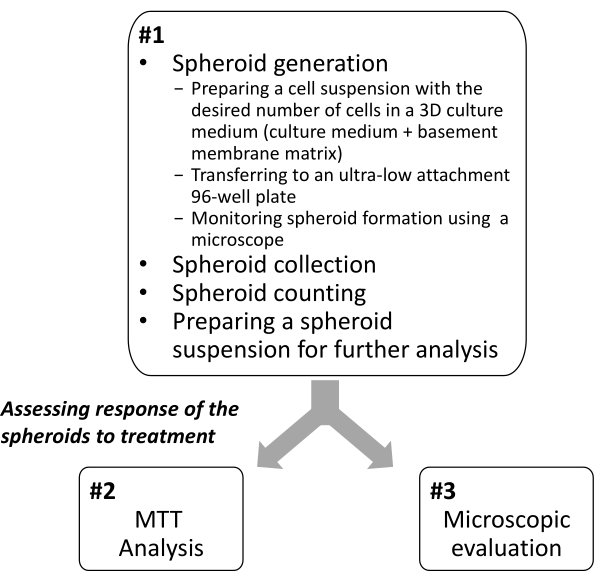
Figure 1: Overview of the protocol for establishing 3D spheroids from patient-derived tumor samples and evaluating their sensitivity to drugs. Please click here to view a larger version of this figure.
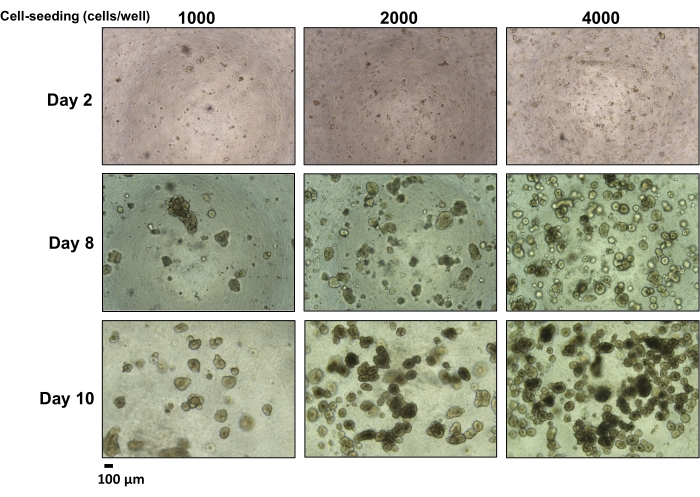
Figure 2: Formation of spheroids from a primary colon cancer cell culture over time by the number of initially seeded cells. Different numbers of cells were seeded in "3D culture medium" in an ultra-low attachment 96-well plate and observed under the microscope (4x magnification). Scale bar = 100 µm. Please click here to view a larger version of this figure.
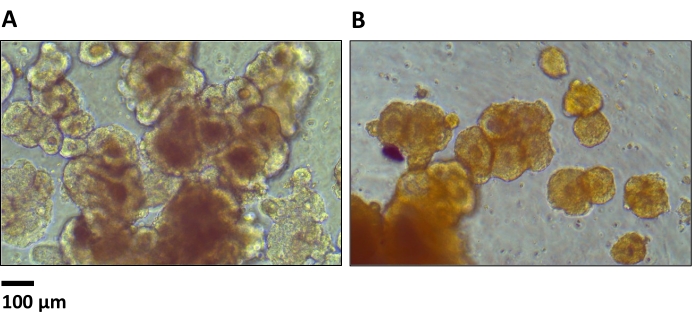
Figure 3: Spheroids from primary colon cancer cells (with initial cell seeding of 2,000 per well) after 12 days in culture. The two examples (A,B) show clusters created by the attachment of spheroids to each other (10x magnification). Scale bar = 100 µm. Please click here to view a larger version of this figure.
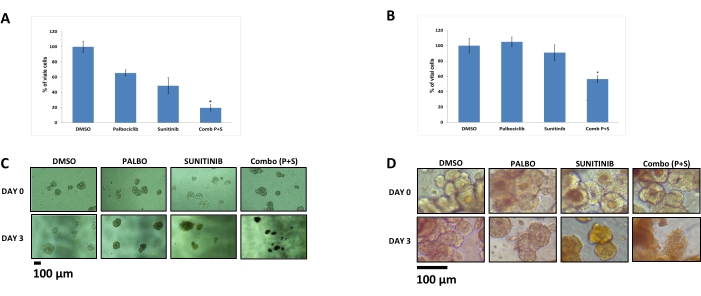
Figure 4: The effects of palbociclib (10 μM), sunitinib (10 μM), and their combination (10 μM each) on spheroids from primary tumor cells, including colon and breast cancer (PDX-derived). An MTT assay was conducted on spheroids derived from (A) colon and (B) breast cancer cells. The MTT signals were normalized to values from DMSO-treated cells. The values represent the means from four to eight replicates. The error bars represent SEM. *p < 0.05 versus a single agent (t-test). The effects of the various treatments on cell growth were also evaluated microscopically at Day 0 and after 3 days of treatment of the spheroids derived from (C) colon and (D) breast cancer cells (10x magnification). Scale bar = 100 µm. The figure is adapted from Moskovits et al.9. Please click here to view a larger version of this figure.
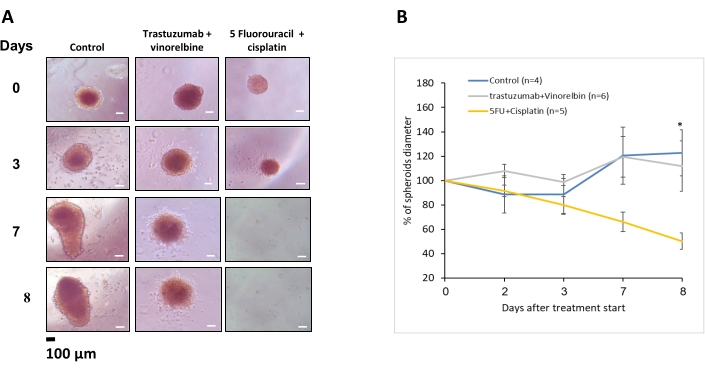
Figure 5: The effects of trastuzumab (10 μg/mL) plus vinorelbine (1 μg/mL) and 5-fluorouracil (200 μM) plus cisplatin (300 μM) on spheroids derived from breast cancer over time. (A) Each well included one spheroid and was monitored over time under the microscope (10x magnification). Scale bar = 100 µm. (B) The change in the diameter of the spheroids (relative to Day 0) by the duration of treatment. *p = 0.05 for 5-fluorouracil plus cisplatin versus controls (t-test). Each treatment group included four to six wells, with one spheroid in each well. The average change is presented. The error bars represent SEM. Please click here to view a larger version of this figure.
The present protocol describes a simple method for generating 3D primary cell cultures (spheroids) derived from human tumor samples. These spheroids can be used for various analyses, including evaluating potential drug candidates and drug combinations, identifying potential biomarkers or therapeutic targets, and investigating the mechanisms of response and resistance. The protocol uses either primary tumor cells derived directly from patient samples or tumor cells from PDX models, which can be established using patient samples. The latter approach allows for conducting in vitro and in vivo experiments with the same primary tumor. Consistency has previously been shown in the results of drug sensitivity experiments between PDX models and 3D cultures derived from these models9, thus supporting the relevance of this in vitro/in vivo approach.
The main advantages of the current protocol include its wide applicability to most solid tumors and its cost-effectiveness, which stems from its compatibility with the typical capabilities/equipment of cancer research/cell biology labs (i.e., no need for specialized equipment or outsourcing). Additionally, the current protocol generates a homogenous spheroid population, which allows the use of high-throughput quantitative viability assays (e.g., MTT). Generating a homogenous spheroid population is important for obtaining meaningful results, as studies have demonstrated that the spheroid size affects the response to treatment. Larger spheroids, unlike smaller spheroids, are characterized by a necrotic core. However, most cells are in the linear growth stage in smaller spheroids. Furthermore, the size of the spheroid also affects the stiffness of its tissue structure, which could impact the diffusion of compounds (such as those used for the viability assays) into the spheroid14. The main limitation of the current protocol is that, even with its wide applicability, there are instances when the approach fails to generate spheroids. Importantly, such a failure is not tumor-type specific but rather patient-specific. Additional studies are required to explore why tumor samples from certain patients do not form spheroids using this protocol.
The current protocol is based on two key principles: (1) having a cell suspension with no cell clusters (i.e., a single-cell suspension) and (2) using an ultra-low attachment plate with a medium containing 5% basement membrane matrix (a solubilized extracellular matrix). The initial number of seeded cells affects the number of spheroids that are formed but not the time required for spheroid formation, suggesting that each spheroid is generated from a single tumor cell. Notably, the clustering of spheroids occurs, particularly after prolonged incubation. This clustering disrupts the homogenous culture and prohibits the use of MTT (due to the difficulty in dispensing an equal number of spheroids into each well). This clustering can be avoided by diluting the culture and transferring the spheroids to larger wells. If a homogenous culture cannot be achieved, MTT assays cannot be used, although the morphological assessment and the measurement of the spheroid diameters can still be performed. It must be noted that the morphological assessment is more labor-intensive since it requires the allocation of one spheroid per well and the monitoring of each spheroid under the microscope.
Determining the appropriate number of spheroids for an MTT assay is important for its interpretation. Thus, it is recommended to first generate a standard curve with known numbers of spheroids (e.g., 50, 100, 200, and 400 per well, in replicates) in order to determine the optimal number of spheroids for the MTT assay. The middle of the linear range of the plot must be used for the analysis so that there are enough spheroids to detect a signal but not too many (i.e., so that the plateau phase of the signal is not reached). Furthermore, using the middle range allows for keeping the signal within the linear range in cases of response to the drug (i.e., reduced signal), as well as non-response (i.e., the continued growth of the spheroid and increased signal). Lastly, since the MTT assay assesses cell metabolic activity, which could be different between tumors from different patients, a standard curve should be generated for each primary tumor sample.
In summary, this protocol for generating 3D tumor culture models from primary cancer cells and evaluating their sensitivity to drugs using a cell-viability assay (MTT) and morphologic examination under the microscope represents a valuable, biologically relevant tool that complements the current 2D in vitro approaches as well as the in vivo approaches.
The authors have nothing to disclose.
None.
5 Fluorouracil | TEVA Israel | lot 16c22NA | Fluorouracil, Adrucil |
Accutase | Gibco | A1110501 | StemPro Accutase Cell Dissociation |
Cisplatin | TEVA Israel | 20B06LA | Abiplatin, |
Cultrex | Trevigen | 3632-010-02 | Basement membrane matrix, type 3 |
DMSO (dimethyl sulfoxide) | Sigma Aldrich | D2650-100ML | |
Fetal bovine serum (FBS) | Thermo Fisher Scientific | 2391595 | |
Flurometer ELISA reader | Biotek | Synergy H1 | Gen5 3.11 |
Hydrochloric acid (HCl) | Sigma Aldrich | 320331 | for stop solution |
ImageJ | National Institutes of Health, Bethesda, MD, USA | Version 1.52a | Open-source software ImageJ |
Isopropanol | Gadot | P180008215 | for stop solution |
L-glutamine | Gibco | 1843977 | |
MTT | Sigma Aldrich | M5655-1G | 3-(4,5-dimethylthiazol-2-yl)-2,5-diphenyltetrazolium bromide |
Non-essential amino acids | Gibco | 11140050 | |
Palbociclib | Med Chem Express | CAS # 571190-30-2 | |
PBS | Gibco | 14190094 | Dulbecco's Phosphate Buffered Saline (DPBS)*Without Calcium and Magnesium |
Penicillin–streptomycin | Invitrogen | 2119399 | |
Phenol-free RPMI 1640 | Biological industries, Israel | 01-103-1A | |
Pippeting reservoir | Alexred | RED LTT012025 | |
RPMI-1640 culture medium | Gibco | 11530586 | |
Sunitinib | Med Chem Express | CAS # 341031-54-7 | |
Trastuzumab | F. Hoffmann – La Roche Ltd, Basel, Switherland | 10172154 IL | Herceptin |
Trypan blue 0.5% solution | Biological industries, Israel | 03-102-1B | |
Ultra-low attachment 96 well plate | Greiner Bio-one | 650970 | |
Vinorelbine | Ebewe | 11733027-03 | Navelbine |