To automatically follow nuclear movement during myoblast differentiation in live imaging, the nuclei should preferentially be fluorescently labeled. It is important to note that using DNA-intercalating molecules is not feasible because these molecules interfere with the proliferation and differentiation of primary myoblasts13. As an example, proliferation and differentiation have been analyzed in primary myoblasts cultured with or without Hoechst (Figure 1). It is evident that proliferation (Figure 1A, B) and differentiation (Figure 1C, middle panel) are strongly impaired in myoblasts cultured with Hoechst 33342. Conversely, myoblasts isolated from H2B-GFP mice and cultured with doxycycline have nuclei with green fluorescence and differentiate similarly to myoblasts isolated from wild-type mice (Figure 1C, right and left panels, respectively).
Live cell imaging with primary myoblasts expressing the H2B-GFP protein allows the tracking of nuclei during differentiation (Figure 2 and Supplementary Video 1). Merged images of transmission and GFP channels at the initial (Figure 2A) and final time points (Figure 2B) during the differentiation of H2B-GFP myoblasts allow scientists to identify myotubes and, consequently, nuclei that end up integrating into a myotube (e.g., the nucleus in the blue circle) or nuclei that do not fuse into a myotube (e.g., the nucleus in the red circle).
To extract information on nuclei/cell movements from the live cell imaging data, it is possible to use the provided software to track the trajectories of the nuclei. The software uses the image from the H2B-GFP channel (the nuclei; Figure 3A) to create a mask and to segment the nuclei in each frame. For nuclear segmentation in a frame, a "conservative" threshold is selected using Otsu's method on the image after Gaussian filtering14. Next, objects are roughly segmented; to get a finer segmentation, each object is masked again using a threshold based on the average in its bounding box. A watershed transform is then used to separate nearby objects (Figure 3B). In our hands, one watershed transform has been unable to separate most nearby nuclei (Figure 3B, *inset). Thus, we used the area to select the larger objects in the image and apply a new watershed transformation (Figure 3B, **inset), which is able to separate additional nearby nuclei. With this approach, most of the nuclei are identified in the image (Figure 3C).
To track the nuclei, we improved the routines by incorporating the tracking routines published by Tinevez15. In short, the tracking algorithm links nuclei detected in consecutive frames with the aim of minimizing the sum of the distances between the position of each nucleus in a frame and the position of the same nucleus in the next one, using the "Hungarian algorithm" for such minimization16. The step is repeated in order to link unlinked nuclei that are up to a certain maximum number of frames away. A threshold for the maximum distance between the position of an object in a frame and the next one is also established. For the data presented here, a maximum number of five frames and a maximum distance of 20 pixels per step give a high number of correct tracks (Figure 3D). Importantly, we can use these routines to check the quality of the tracking. It is also possible to use this script to find cells that have a given behavior, for example forming (or not) a myofiber, and subsequently analyze the dynamical features of the set of cells of interest.
The applied software generates the tracks with the x- and y-coordinates for each cell in frame n,  , for hundreds of cells (Figure 3D). We can use such information to extract information about nuclei motion. As an example, the total displacement between the initial frame (n = 0) and the final frame N is defined as follows.
Displacement of a trajectory= || 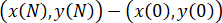 ||
||
Here, "||·||" stands for the norm of the vector (Figure 4A).
The velocity of each nucleus in frame n is as follows.

Then, we can define the length of a trajectory for a given cell as follows.
Length of trajectory= 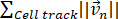
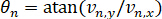
As an example of how these simple parameters can already give relevant information, we computed the length of nuclei trajectories of myoblasts incubated with or without Hoechst. It appears that the total length of the trajectories is slightly higher for cells stained with Hoechst, although the difference is not significant (Figure 4B). However, when we computed the total displacement during a time lapse, we observed that the total displacement of cells stained with Hoechst was significantly smaller than that of unstained cells (Figure 4C). This indicates that the movement of stained cells has a lower directionality. To further strengthen this hypothesis, we quantified the directionality of the motion of a cell by computing the angle of the velocity in each frame (Figure 4A).
We also quantified the variation of the angle between frames.
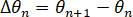
The total angle variation along a trajectory can then be defined as follows.
Total angle variation= 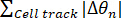
As predicted, the total angle variation for the unstained cells is significantly smaller compared to cells stained with Hoechst (Figure 4D). Hence, this simple measure of directionality, obtained from a straightforward calculation, indicates that the myoblasts stained with Hoechst are less prone to maintain the direction of their displacement, which reflects their impaired ability in forming myotubes (Figure 1).
In short, live cell imaging data generated as described here provide a quantitative link between nuclear dynamics and the ability to form myotubes and can be used as input for a high-throughput quantitative characterization of nuclear dynamics and myoblast behavior during differentiation and fusion.
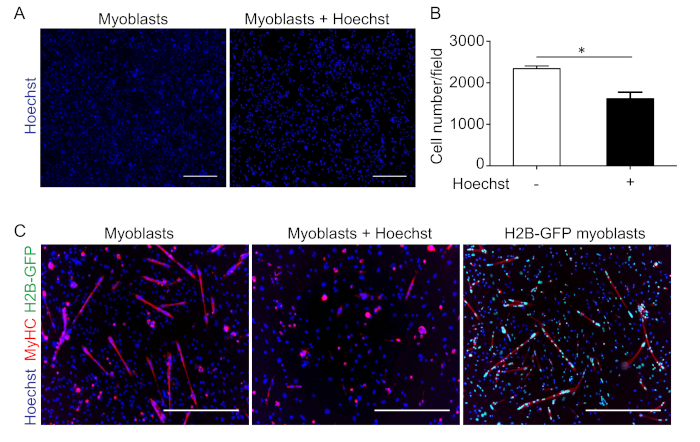
Figure 1: Incubation with Hoechst interferes with the proliferation and differentiation of myoblasts. (A) Representative images of primary myoblasts stained with Hoechst after 24 h in proliferation medium (left panel) or cultured for 24 h in proliferation medium with Hoechst (right panel), and (B) the relative quantification. Data are the mean ± SEM, and the statistical significance was assessed with Student's t-test. *P < 0.05. (C) Representative images of primary wild-type myoblasts, cultured for 24 h in differentiating medium without (left panel) or with Hoechst (middle panel), and of H2B-GFP myoblasts cultured for 24 h in differentiating medium (right panel) and stained with Hoechst (blue) and an anti-myosin heavy chain antibody (MyHC; red). The scale bars = 500 µm. Please click here to view a larger version of this figure.
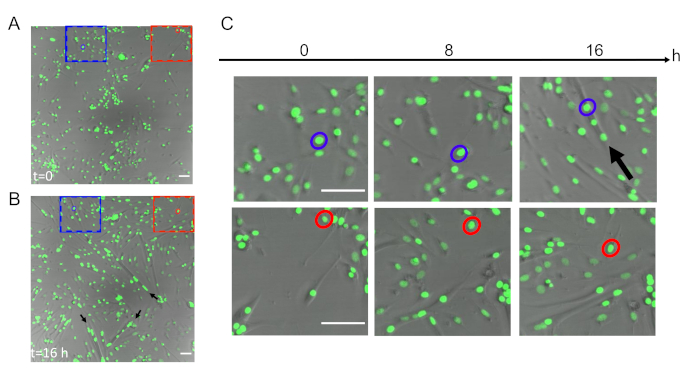
Figure 2: Live imaging of H2B-GFP myoblasts during differentiation. Merged images of transmission and GFP channels at (A) the initial (t = 0 h) and (B) final time points (t = 16 h) during the differentiation of H2B-GFP myoblasts (20x objective). Some examples of myotubes are highlighted with black arrows in panel B. The scale bars = 50 µm. (C) Magnified dotted areas from panels A and B in which it is possible to identify a single nucleus that ends up integrating into a myotube (in blue) or not (in red) at t = 0 h, t = 8 h, and t = 16 h. The scale bars = 50 µm. Please click here to view a larger version of this figure.
Figure 3: Segmentation of H2B-GFP myoblasts tracking during differentiation. (A) Example of a frame of the time lapses showing the nuclei of approximately 400 cells. (B) Example of nuclei masking and segmentation. Bright objects are segmented using both a global and a local threshold, and a watershed transformation is applied to separate nearby nuclei. Nearby nuclei might be difficult to segment (*inset), so a second watershed-based segmentation is performed in objects of large areas to segment a higher number of nuclei (**inset). (C) Detected nuclear positions (red crosses), that are later used in the tracking algorithm. (D) Tracks generated using the tracking algorithm that minimizes the sum of the distances between each object's position in two consecutive frames. A maximum possible value of such distance for each object is provided as an input that allows scientists to link nuclei separated by more than one frame. The scale bars = 50 µm. Please click here to view a larger version of this figure.
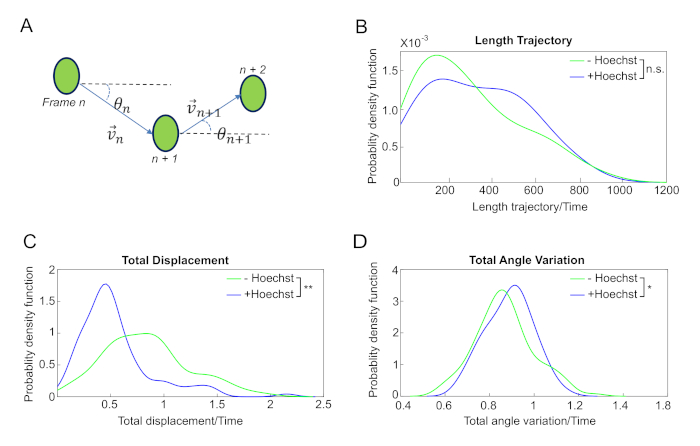
Figure 4: Quantitative analyses of nuclei dynamics uncover the impaired ability of myoblasts incubated with Hoechst to maintain cell directionality. (A) Description of parameter measurements.It is possible to define the velocity of a nucleus by considering the position in two consecutive frames. The trajectory angle and the angle variation can then be readily calculated from the positions as indicated in the scheme. (B) Distribution of the trajectories length, (C) total displacement, and (D) variation of the trajectories angle of myoblasts incubated without Hoechst (green line) or with Hoechst (blue line). The two distributions are not significantly different, while the total displacement is significantly higher, and the variation of the angle is significantly lower for unstained cells (one-sided Kolmogorov-Smirnov test, *p < 0.05 and **p < 0.005). Please click here to view a larger version of this figure.
Supplementary Video 1: Live imaging of H2B-GFP myoblasts during differentiation. Imaging of H2B-GFP myoblasts cultured in differentiating medium from the initial (t = 0 h) to final time points (t = 16 h) using transmission and GFP channels (20x objective). Please click here to download this file.
