We present a cost-effective method to the scratch migration assay that provides a new approach for determining cell migration without the use of equipment-intensive methods. While fibroblasts were used in this protocol, it can be adapted and utilized to study additional cell types and influences on cell migration.
Cell migration is a key component in both physiological and pathological events. Normal cell migration is required for essential functions such as development and mounting an immune response. When a defect or alteration occurs with the cell migration process, it can have detrimental outcomes (i.e., cancer metastasis, wound healing, and scar formation). Due to the importance of cell migration, it is necessary to have access to a cell migration assay that is affordable, adaptable, and repeatable. Utilizing the common scratch migration assay, we have developed a new approach to analyzing cell migration that uses general laboratory equipment. The method described uses visual markers that allow for recapturing specific areas of interest without the use of time-lapse microscopy. In addition, it provides flexibility in the experimental design, ranging from altering the migration matrix substrate to the addition of pharmacological modifiers. Furthermore, this protocol outlines a way to account for the area of cell migration, which is not considered by several methods when examining cell migration. This new approach offers a scratch migration assay to a larger audience and will provide greater opportunity for researchers to examine the physiological and pathophysiological impact of cell migration.
Cell migration is crucial for many physiological as well as pathological events. It is required during development, for mounting an immune response, and for proper wound healing1,2,3. Many of these cell migration events can be triggered by physical or chemical signals. For example, during an immune response, leukocytes will migrate towards a site of injury in response to a chemoattractant2. Additionally, leukocytes will also release cytokines to induce migration of additional immune cells, as well as other cell types, such as fibroblasts, which are involved in the wound healing process, and thus, initiating a multicellular response4. The ability of cells to migrate is essential for proper physiological function; however, when cell migration goes unchecked, it can have an adverse response and contribute to pathological events, such as chronic inflammation, vascular disease, cancer metastasis, and impaired wound healing2,3,4,5,6,7. Impaired wound healing is a common affliction of diabetics due to defects in cell migration, and if these defects are not addressed, it could lead to further complications (e.g., amputation8,9). This study, as well as others, have indicated the need to further understand the process by which cell migration occurs, either under normal physiological or pathological conditions, and it is vital for furthering this field of research. In order to accomplish this, there needs to be migration assays available that are both accessible and affordable to those researchers, who may not possess the equipment needed to conduct these assays.
Currently, there are a variety of migration assays available to examine a wide range of topics regarding cell migration. Both 2D and 3D migration models have been developed, each targeting specific areas impacting cell migration. 3D migration models are typically associated with cell invasion studies and assess the impact of extracellular matrix on cell migration10,11,12, whereas 2D migration assays have a greater range of application and are primarily used to study chemotactic migration, wound healing, and functional changes during cell migration13,14,15,16. Several of these assays require additional equipment, such as Boyden chambers or exclusion rings, which can reduce the availability of these assays to certain researchers. One of the more cost-efficient assays is the scratch assay, which is typically used to assess wound healing and general changes in cell migration14,17. While most laboratories are equipped to conduct a scratch assay, the equipment used to track cell migration tend to either be unavailable or too expensive to purchase. This includes time-lapse microscopy, which requires an inverted microscope and a live imaging system. These expensive pieces of equipment are not commonly accessible to every laboratory. Therefore, this observation highlights the need for a new protocol that allows assessment of cell migration with more readily available equipment.
The protocol presented here provides a new and affordable way to assess cell migration. This method follows the same procedure associated with scratch assays but differs in the analysis of examining cell migration by utilizing equipment more commonly available in a basic sciences laboratory setting. This protocol using common equipment allows for a more accurate determination of cell migration without the use of time-lapse microscopy. In addition to determining migration, this method also accounts for variable factors in the scratch area that has been noted to greatly impact cell migration. Overall, this new protocol for cell migration analysis provides an opportunity for more laboratories to explore and contribute to the field of cell migration.
1. General cell culture
2. Preparation of the migration plate
3. Scratch migration assay & fixation
4. Preparation of 0 h and 24 h images
5. Counting the number of migrating cells
6. Determine area of migration
7. Data analysis
This procedure documents a new approach to studying cell migration that is both cost-effective and easily adaptable for most labs. Many studies have used time-lapse microscopy to assess cell migration, but the equipment required for this method is not readily available to many laboratories. Whereas utilizing lines and dashes for demarcation allows for the ability to recapture specific areas of interest at different time points without the use of expensive equipment (Figure 1 & Figure 3). While the use of demarcations is essential for this new approach, there are many areas of this method that can be adapted to suit individual researcher needs. The protocol indicated a 24 h endpoint; however, that endpoint can be extended based upon an individual lab’s needs. Adjusting the endpoint of the protocol can allow for continued culturing of cells for further use. In addition, this protocol permits the flexibility to test the impact of pharmacological modifiers as well as extracellular matrix substrates on migration. Lastly, the costliest component of this method is the use of imaging software, which may be licensed software, but the use of licensed software is not the only option. Other imaging software that allow the generation of lines and overlaying images can be utilized with this method. In addition, to the cost effective and adaptable nature of this method, it presents a new approach to examining cell migration by factoring the area of the scratch.
This new approach was recently used in Burr et al. 2020 to assess differences in cardiac fibroblast migration between cells isolated from non-diabetic and diabetic hearts20. Figure 3 presents representative images used to assess fibroblast migration. From these images, it was determined that 46 fibroblasts from non-diabetic hearts and 129 fibroblasts from diabetic hearts had migrated during the 24 h time period of the experiment. Upon group comparisons, the number of cells from the diabetic hearts had migrated 2.8x greater than cells from non-diabetic hearts (Table 1). While these results indicated cells from diabetic hearts had migrated more, the numbers were misleading, because the area of the scratch was different for each of the two groups. The non-diabetic scratch area was 24.78% of the total area measured, whereas the diabetic migration scratch was 16.77% of the total area measured. When the area of the scratch was considered, it provided a ratio (cell number/% scratch area) indicating that fibroblasts from diabetic hearts actually migrated 4.13x greater than cells from non-diabetic hearts. These results highlighted the importance for considering area of migration when conducting migration assays.
Normalizing to the area of migration provides a better and more rigorous assessment of cell migration and negates potential human error. While the described method uses a P200 pipette tip, which should provide a uniform and consistent scratch, uneven scratches can occur due to human inconsistencies. Figure 5 highlights the importance of factoring differences in scratch area. If one was to compare only the number of migrated fibroblasts, it would show that Figure 5A has twice the number of migrated cells compared to Figure 5B. Whereas when the area of the scratch is used to normalize the data, it indicates that the ratio of fibroblasts to migration area is similar in both Figure 5A and Figure 5B. For this example, we used untreated non-diabetic cardiac fibroblasts from different fibroblast isolations; therefore, a similar migration ratio should be the expected outcome due to the nature of the cells used in Figure 5. If one were presenting only the number of migrated cells, these finding could be misrepresentative if the scratched area is not uniform and consistent across all samples. Therefore, it is important to account for the scratched area with this method as well as other scratch migration assays. These represented results presented in Figure 5 demonstrated how normalizing the number of migrated cells to the scratched area can present accurate, repeatable, and reliable migration data.
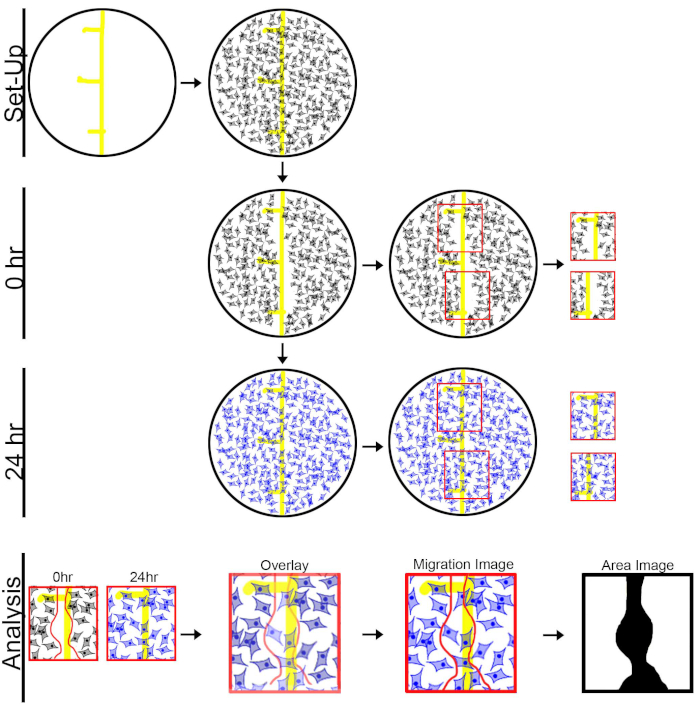
Figure 1: Diagram of the experimental design for the fibroblast scratch migration assay. Setup: Before plating cells into well, draw a line and 3 dash marks on the bottom on the plate. 0 h: Culture cells until 95% confluency and administer a scratch paralleling the depicted line. Capture 0 h images by selecting a section above and below the middle dash. 24 h: Allow cells to migrate for 24 h before fixing and staining. For 24 h images, align well into the same position as 0 h images to capture migrated cells. Analysis: Outline the area of migration on 0 h image and then overlay the 0 h image onto the 24 h image to generate migration and area images. Please click here to view a larger version of this figure.
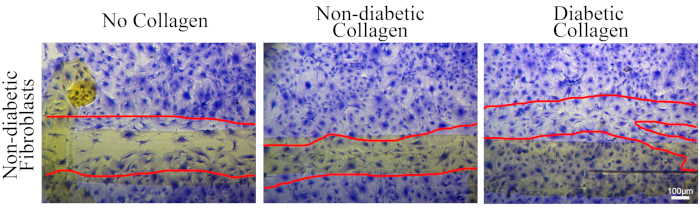
Figure 2: Representative images that show Coomassie staining does not interfere with visualization of cells. Cardiac fibroblasts were plated on either no collagen (plastic dish), collagen isolated from non-diabetic mice tails, or collagen isolated from diabetic mice tails. The cells were used in the scratch migration assay following the methods described here. Cells were stained with 1% Coomassie Brilliant Blue stain and then images of migrating cells were captured. The scale bar depicted on the image is 100 µm. Details on collagen isolation and/or cell migration on collagen are presented in Burr et al.20. Please click here to view a larger version of this figure.
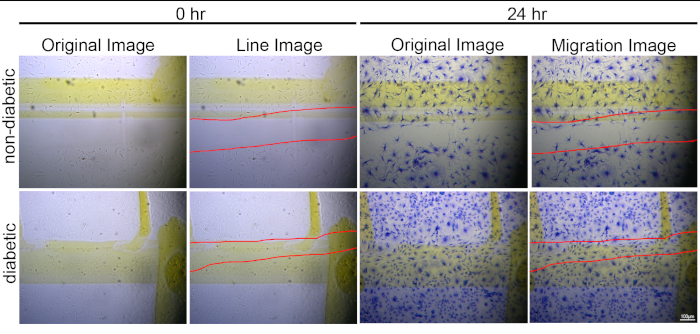
Figure 3: Representative data demonstrating the difference in cardiac fibroblast migration between non-diabetic and diabetic cells. 0 h and 24 h images used to calculate the number of migrated cardiac fibroblasts isolated from non-diabetic and diabetic mice (red line depicts the area of migration and images taken at 20x with scale bar = 100 µm). Diabetic cardiac cells had 129 cells migrate in an area of 16.77%, which produced a migration ratio of 7.69. Non-diabetic fibroblasts had 46 cells migrate with an area of 24.78% which led to a ratio of 1.86. The images presented in this figure were used in the results presented in Burr et al.20 but the images depicted here were not shown in Burr et al.20. Please click here to view a larger version of this figure.
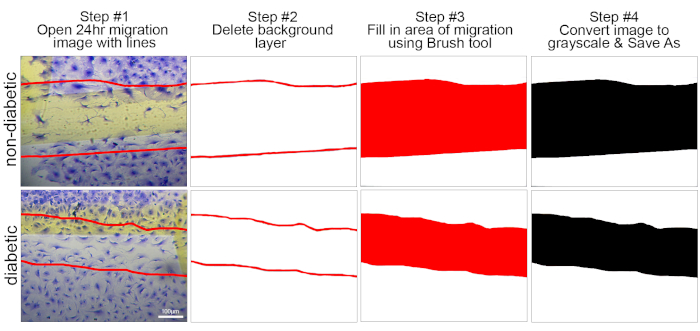
Figure 4: Diagram that depicts the generation of area of migration image. Step #1: Open migration image that contains lines of migration. Step #2: The 24 h image is removed, leaving on the lines of migration in the image field. Step #3: The brush tool was used to fill in the area of migration. Step #4: The image is converted to grayscale and then saved as a new image. Scale bar represents 100 µm. Please click here to view a larger version of this figure.
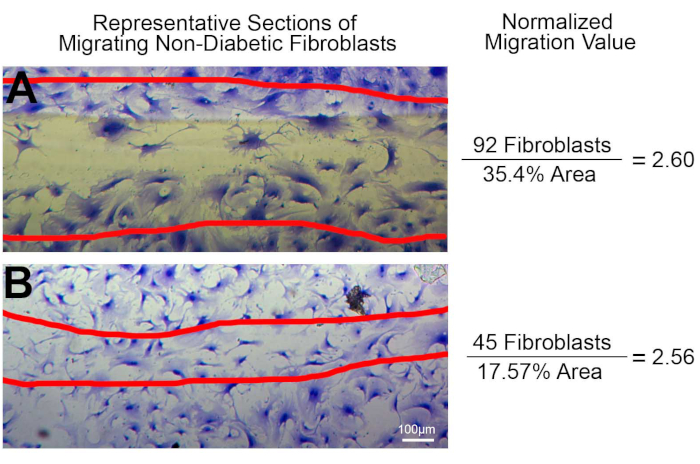
Figure 5: An example of the impact of different migration areas on fibroblast migration. Non-diabetic cardiac fibroblasts were plated on plastic culture dishes and used in the scratch migration assay, as described above (scale bar = 100 µm). (A) 92 migrated fibroblasts with a percent area of 35.4% which resulted in a migration ratio of 2.60. (B) 45 fibroblasts migrated with an area of 17.57% that calculates a ratio of 2.56. Please click here to view a larger version of this figure.
Fibroblast Type | Average Number of Migrated Cells | Average Area of the Scratch | Cell Number to Scratched Area Ratio |
Fibroblasts from Non-Diabetic Hearts | 46 | 24.78% | 1.86 |
Fibroblasts from Diabetic Hearts | 129 | 16.77% | 7.69 |
Table 1: Migration data from migration scratch assay using non-diabetic and diabetic cardiac fibroblasts. The number of non-diabetic and diabetic fibroblasts that migrated were determined using Figure 3. The percent area for each image was calculated using described methods and ImageJ. The ratio of migration was calculated by dividing the number of migrated fibroblasts by the percent migration area.
This new approach to the scratch migration assay provides a more accessible method for researchers to examine changes in cell migration. While this assay follows the same procedure for administering a scratch similar to other scratch assays, it does provide a new method for imaging and accurate analysis of cell migration10. Instead of using equipment-intensive methods of time-lapse microscopy and live cell imaging chambers, this method details the use of commonly available lab equipment. Utilizing a general inverted microscope and camera, one can capture migration images at the same time while maintaining consistent culture conditions. In addition, this method provides a precise imaging of the same region of interest without the use of advanced equipment. Capturing the same area of migration will reduce the inconsistencies in determining cell migration and provide a more rigorous and accurate measurement of cell migration. Lastly, this method takes into consideration the area of the scratch. While caution is taken to minimize human variations in scratches, inconsistencies still can occur, demonstrating the importance of using area as a normalizing factor into the analysis of cell migration. Overall, the protocol detailed above provides a new approach to a powerful tool commonly used to assess cell migration.
Developing an adaptable migration assay provides new avenues for research. The migration assay presented here has the ability to be modified in order to examine specific research questions. Modifications can be made regarding activating or inhibiting specific proteins of interest. Reagents such as pharmacological modifiers (agonists or antagonists) and RNA interference can be applied to migration assay before, during, or even after migration to address questions about migration and specific proteins. The small volume of the 48 well dish also allows for lower amounts of modifiers to be added, which is another cost-effective method. In addition, this assay can be modified to study the impact of extracellular matrix components (ECM) on cell migration. Recently we applied this method, where cell culture plates were coated with collagen isolated from diabetic and non-diabetic mice to assess the impact of diabetic extracellular matrix has on cardiac fibroblast migration20. While this study utilized isolated collagen, this method can be adapted to other extracellular components that may be of interest. The ability to assess the impact of ECM migration is very useful due to multiple studies indicating the importance of ECM on migration20,21,22. A potential complication that may occur with the use of ECM proteins and coating the wells with highly concentrated ECM solution is an impact on visualization of cells. It is recommended if using ECM, like collagen, to coat a well and stain with Coomassie blue to see if the ECM could visually impair the imaging of cells. If ECM impairs visualizing cells, diluting ECM solution will improve this issue and allow for visualizing cells on ECM.
This new approach on an old technique does present some limitations. This method has been adapted to a small scale (48-well cell culture plate) and may not transition to larger plates easily. Due to the size of the well and the area captured in the images this protocol can document a large portion of the area of migration. However, expanding this method to larger well dimensions may result in capturing a lower portion of migration area. This can be potentially resolved by increasing the number of captured images, but additional methods may need to be applied to ensure the area of migration imaged can be reidentified for the 24 h images. In addition, this method is limited to cells that can be utilized in a scratch migration assay. Cells that do not respond in a traditional scratch migration assay may not be ideal for the approach presented within this manuscript. While there are some limitations with this approach, modifying the methods detailed in this manuscript could alleviate some of the limitations.
The scratch migration assay follows a simple approach but there are some critical steps that need to be followed to produce a successful assay. A crucial step is to draw the indicating marks on the bottom of the well. If the indicators are not drawn on the wells it will be very difficult/impossible to differentiate the area that needs to be imaged for the 24 h image as well as preventing recapturing the same area of migration. Also, it is important to recapture the same area of migration in the 24 h image that was captured in the 0 h image. If the same area is not captured at 24 h then overlaying the images for migration will not be feasible. Without overlaid images it will not be possible to determine which cells have migrated. The overlaid images are critical for this approach, because they provide an accurate determination for cell migration. Since the scratch method does not always provide straight scratch lines, it is critical that the correct areas be imaged to generate the overlaid images. The overlaid images provide the foundation for the accuracy of this migration assay presented within this manuscript.
A new adaptation of the scratch migration assay provides a more accessible and flexible approach to examining cell migration. Previous cell migration studies have used equipment-intensive methods that are not commonly available to every laboratory. Indicating that the development of a migration assay that has a wider range of accessibility is essential. This manuscript described a new approach to an old technique that will increase the accessibility to researchers interested in cell migration. In addition, this method provides the ability to alter the cell culture environment, whether via extracellular matrix components or the use of pharmacological modifiers, to determine the impact that has on cell migration.
The authors have nothing to disclose.
This work is supported by the US Army Medical Research Award #81XWH-16-1-0710, University of Mississippi School of Pharmacy and the Department of BioMolecular Sciences.
Adobe All Apps | Adobe | This includes Adobe photoshop which is the imaging software used with this protocol | |
Avant Pipette Tips 200ul Binding non-sterile | MIDSCI | AVR1 | Tips are autoclaved to sterilize |
AxioCam Erc 5s Camera | Zeiss | 426540-9901-000 | |
Coomassie Brilliant Blue R-250 | Fisher Scientific | BP101-25 | |
Costar Flat Bottom Cell Culture Plates 48 Wells | Fisher Scientific | 07-200-86 | |
DMEM with L-Glutamine, 1g/L glucose and sodium pyruvate | Fisher Scientific | MT10014CM | |
Image J | NIH | This is a free software offered by the US government and is the analysis software used with this protocol | |
Paraformaldehyde | Fisher Scientific | AC416785000 | |
Premium US origin fetal bovine serum | Innovative Research | IFBS-HU | |
Primocin | InvivoGEN | ant-pm-2 | This is the anitmicrobial used for with this procotol to culture cardiac fibroblasts |
Zeiss Primovert Microscope | Zeiss | 491206-0002-000 | |
Zen Blue Edition 2.3 software | Zeiss | software comes with camera purchase |