Obesity and metabolic syndrome (MetS) have become a growing problem for public health and clinical practice, given their increased prevalence due to the rise of sedentary lifestyles and unhealthy eating habits1. There are several definitions of MetS, but most of them describe it as a cluster of cardiovascular and metabolic alterations such as abdominal obesity, reduced HDL and elevated LDL cholesterol, elevated triglycerides, glucose intolerance, and hypertension2,3,4. Diagnosis requires that three out of these five criteria are present.
Owing to animal models, basic research has been able to investigate the mechanisms underlying pathological processes such as MetS. Several animal models have been used, but it is of crucial importance that the model of choice reproduces the main clinical manifestations of the human pathology (Figure 1). With this aim, animal models considered similar to humans, mainly canine and swine, have been developed (see Verkest5 and Zhang & Lerman6 for review). However, canine models do not show all the components of MetS, given that the development of atherosclerosis or hyperglycemia in dogs by means of the diet is questionable5. Swine models present the most anatomical and physiological similarity with humans, and thus offer significant predictive power for elucidating the mechanisms underlying MetS, but their maintenance and the complexity of the experimental procedures make the use of this model very labor intensive and costly6.
On the other hand, rodent models (mouse and rat), diet-induced spontaneous and transgenic, have been extensively used in the literature for the study of obesity, hypertension, and MetS, and its pathological consequences in different organs and systems (see Wong et al.7 for review). Although the use of these models is more affordable than canine or swine, they have important drawbacks. Indeed, depending on the strain, animals develop some components of MetS, whereas others such as hypertension, hyperglycemia, and hyperinsulinemia are absent7. Furthermore, one of the main components of MetS, obesity, in some genetically modified strains, does not only depend on factors associated with the diet, rather it has been shown that some animals become obese with normal or even reduced food intake8. Finally, mice and rats show a natural deficiency in cholesteryl ester transfer protein (CETP) and use HDL as the major means of cholesterol transport, which makes them relatively resistant to the development of atherosclerosis. This is an important difference in lipid metabolism with humans, who express CETP and transport their cholesterol mainly in LDL9.
Conversely, the laboratory rabbit represents an intermediate stage between the larger animal and rodent experimental models. Thus, the rabbit can be easily submitted to different types of protocols with minimal requirements of personnel and maintenance, being more easily handled in experimental procedures than larger animal models. Furthermore, it has been reported that rabbits fed with a high-fat diet have similar hemodynamic and neurohumoral changes as obese humans8,10,11. Of note, regarding lipid metabolism, the rabbit has abundant CETP in plasma and their lipoprotein profile is LDL-rich12, which is also similar to humans. Additionally, rabbits develop hyperlipidemia quite rapidly given that, as herbivores, they are very sensitive to dietary fat13.
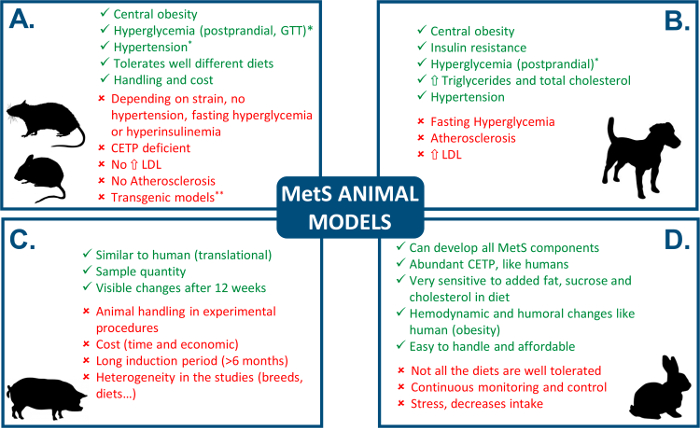
Figure 1: Comparison of MetS animal models. See Verkest5, Zhang and Lerman6, and Wong et al.7 for review. " " indicates an advantage and "
 " indicates a disadvantage. *controversial, depends on the study, **as pointed out by Carroll et al.8, some genetically modified strains become obese independently of food intake. CEPT: cholesteryl ester transfer protein. GTT: glucose tolerance test. Please click here to view a larger version of this figure.
In order to elucidate the basic mechanisms underlying the pathological remodeling produced by MetS in the different organs and systems, and to gain understanding of this complex pathology, the choice of an experimental model that reproduces the main components of human MetS is essential. The rabbit can provide many advantages given its similarity with human physiology and the affordability of use in chronic protocols and measurements. In this line, few diet-induced rabbit models using high-fat and high-sucrose diet have been used14,15,16,17,18,19 (Table 1), and a characterization of the different components of MetS is of great importance when relating a phenotype with organ remodeling. Thus, this article's main objective is to describe the methods to develop a model of diet-induced MetS in rabbits that allows the study of its pathophysiology and impact in organ remodeling.
| Study | Diet | Duration | Breed | MetS components | |||
| Ob | HT | HG | Dl | ||||
| Yin et al. (2002)14 | · 10% fat | 24 weeks | · Male NZW | |
– | |
|
| · 37% sucrose | · 2 kg | ||||||
| Zhao et al. (2007)15 | · 10% fat | 36 weeks | · Male JW | |
|
|
|
| · 30% sucrose | · 16 weeks | ||||||
| Helfestein et al. (2011)16 | · 10% fat | 24 weeks | · Male NZW | |
– | |
|
| · 40% sucrose | · 12 weeks | ||||||
| · 0.5-0.1 cholesterol | |||||||
| Ning et al. (2015)17 | · 10% fat | 8-16 weeks | · Male WHHL | |
– | |
|
| · 30% fructose* | · 12 weeks | ||||||
| Liu et al. (2016)18 | · 10% fat | 48 weeks | · Male NZW | |
– | |
|
| · 30% sucrose | · 12 weeks | ||||||
| Arias-Mutis et al. (2017)19 | · 15% fat | 28 weeks | · Male NZW | |
|
|
|
Table 1: Diet-induced MetS rabbit models using high-fat, high-sucrose diet. The symbol "" indicates absence, "" presence, and "-" not evaluated. *restricted. WHHL, Watanabe heritable hiperlipidemic rabbits. JW, Japanese white rabbits. Ob, obesity. HT, hypertension. HG, hyperglycemia. Dl, dyslipidemia.
MetS represents a cluster of metabolic and cardiovascular abnormalities whose study can be facilitated by the use of experimental models. Indeed, to elucidate the mechanisms underlying the pathological remodeling produced by MetS, the choice of an experimental model that appropriately resembles the human condition and is suitable for research is of crucial importance. Here, we present the methods to induce MetS in rabbit using a diet high in saturated fat and sucrose, and a detailed characterization for its evaluation. The use of diet instead of a genetically modified animal model is of great importance since diet affects whole-body metabolism19, thus resembling closely what happens in human MetS. We used a factorial (mixed model) ANOVA with two factors, one repeated measures or "within" factor (time: pre, week 14 and week 28, depending of the analysis) and one "between" factor (group: control and MetS) for statistical analysis. Significance was accepted when p <0.05.
The high-fat, high-sucrose diet is well tolerated by the animals. An acclimation period of 4 weeks is necessary for the correct transition from the previous feeding regime to the high-fat, high-sucrose diet. Animals in control group are fed 120 g chow, which has been shown to be appropriate for the maintenance of the adult rabbit8. Rabbits in the MetS group increased progressively in weight until the end of the experimental protocol (Table 2). Animals should gain 50 – 100 g per week. It is important that rabbits are housed individually in cages with enough space, light, and environmental enrichment (Figure 2C), and a daily check of the animals is performed. Also on a daily basis, chow and drink intake must be supervised and registered, in order to achieve weight gain and detect possible health problems, since rabbits are easily stressed and the response may be to stop nourishment consumption. In addition, since high-fat pellets tend to be very unstable and lose consistency very easily, turning into powder which rabbits do not eat, it is of critical importance to prepare the daily portions of chow very carefully (Figure 2A). In Figure 3A, we can observe the behavior of energy intake and its fluctuations, ranging from 250 to 815 kCal in the MetS group. In Figure 3B, the relative contribution of the different sources of energy (chow and drink) is depicted. There are critical periods in weeks 14 and 28 because, given the stress produced by experimental procedures, rabbits might decrease chow and water intake. The daily quantification allows the rapid identification of this problem, which can be avoided by introducing control chow (80% high-fat, 20% control) and decreasing the sucrose solution from 15% to 10%, or even 5%, during 2-3 days until animals recover their normal intake values. Animals also developed central obesity as shown by the increase in weight, abdominal perimeter and BMI (Table 2), which is closely related with the risk factors that define MetS3.
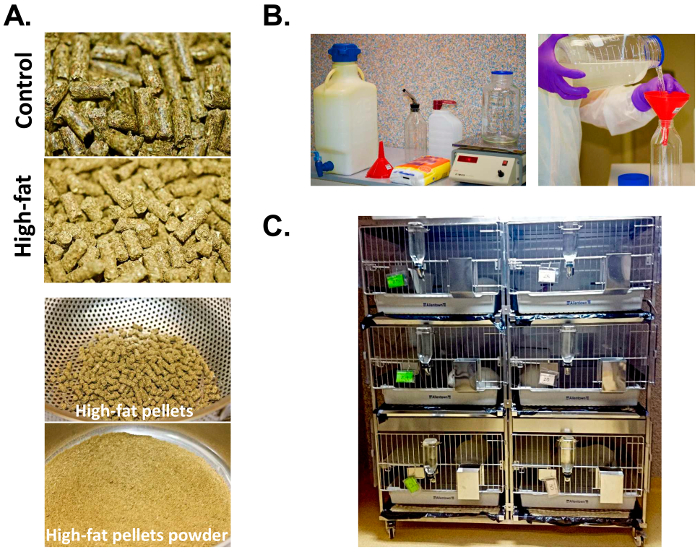
Figure 2: Diet administration. In panel A, control chow (top) and high-fat chow (below) are depicted, showing the differences between the two due to the added fat. In order to avoid the powder that makes high-fat pellets less palatable, it is necessary to use a strainer to separate high-fat pellet powder (Panel A, bottom). In panel B, we can observe the materials needed to make the drinking solution (left), and how it is advisable to make a stock solution to distribute in the water dispenser. Lastly, the welfare of the animals is very important, and they must be housed individually in cages (C) with enough space and light and, if possible, environmental enrichment (i.e., platforms, toys, etc.). Please click here to view a larger version of this figure.
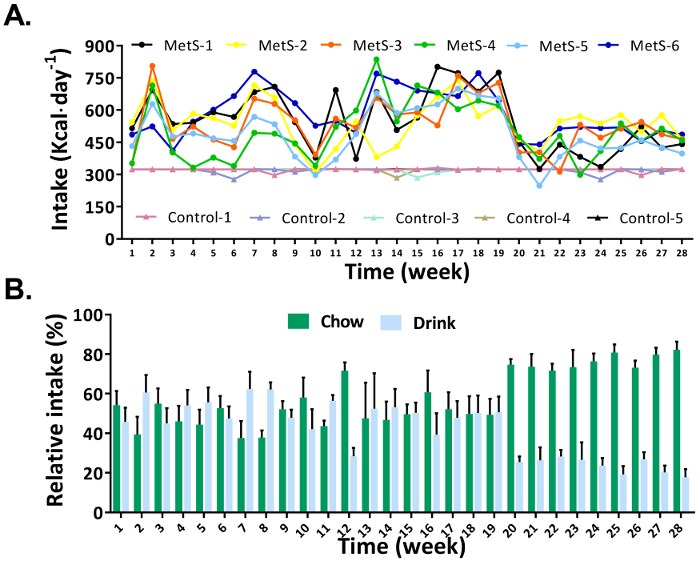
Figure 3: Energy intake. The evolution of weekly intake during the 28 weeks of the experimental period is depicted in panel A for control and MetS. The relative intake (in percentage) of kCal from high-fat chow and the drinking solution of MetS animals is shown in panel B. Control (n = 5), MetS (n = 6). Error bars: SD. Modified from Arias-Mutis et al.19 Please click here to view a larger version of this figure.
| Pre-diet | Week 14 | Week 28 | ||||
| Control | MetS | Control | MetS | Control | MetS | |
| Weight (Kg) | 4.35(0.15) | 4.43(0.14) | 4.49(0.12) | 5.42(0.17) | 4.51(0.13) | 5.75(0.6) |
| Length (cm) | 52.4(1.6) | 53.6(1.7) | 52.5(0.8) | 54.4(1.7) | 53.7(0.7) | 54.6(0.8) |
| Height (cm) | 25.9(0.7) | 25.5(1.1) | 25.9(2.2) | 26.1(5.3) | 26.0(1.0) | 26.1(1.5) |
| Abdom. perimeter (cm) | 39.8(1.7) | 40.5(1.4) | 38.5(1.5) | 47.5(2.2) | 38.1(1.0) | 49.7(3.5) |
| Tibial length (cm) | 16.4(0.8) | 16.3(0.7) | 16.7(0.3) | 16.7(0.4) | 17.4(0.4) | 16.8(0.6) |
| BMI (Kg/m2) | 32.8(1.9) | 32.9(2.6) | 32.8(1.2) | 36.8(1.9) | 32.6(2.1) | 39.3(6.0) |
Table 2: Morphological characteristics. We found differences when comparing control vs. MetS at weeks 14 and 28 in weight (main effect p = 0.003, η2 = 0.6; pairwise comparisons at week 14 p <0.001 and week 28 p <0.001), abdominal perimeter (main effect p<0.001, η2 = 0.9 pairwise comparisons at week 14 p <0.001 and week 28 p <0.001), and BMI (main effect p = 0.016, η2 = 0.5; pairwise comparisons at week 14 p <0.001 and week 28 p <0.001). Control (n = 5) and MetS (n = 6). Values are expressed as Mean (SD). Modified from Arias-Mutis et al.19.
Regarding fasting blood glucose, the response to the IVGTT plays a key role in the characterization of glucose homeostasis21. We observe mild hyperglycemia at week 14, which reaches a plateau and maintains similar values at week 28 (Figure 4A). The area under the curve (AUC) also increases in the MetS group (Figure 4B). Even though cut-off values to identify type II diabetes in rabbits based on fasting blood glucose have not yet been recognized19, with this experimental protocol, rabbits submitted to 28 weeks of high-fat, high-sucrose feeding developed pre-diabetes with impaired fasting glucose and glucose intolerance.
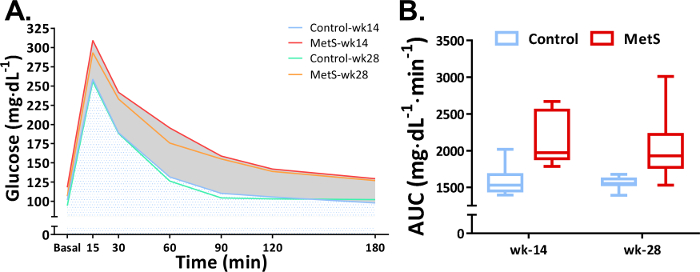
Figure 4: Blood glucose regulation. The results of the IVGTT in control and MetS animals at weeks 14 and 28 are shown in panel A. The quantification of the area under the curve (AUC) from 0 to 180 min is depicted in panel B with a box and whiskers plot. This parameter increased in MetS animals in weeks 14 and 28 versus controls (main effect p = 0.001, η2 = 0.5; pairwise comparisons at week 14 p = 0.001 and week 28 p = 0.002). Control (n = 5), MetS (n = 6). Modified from Arias-Mutis et al.19 Please click here to view a larger version of this figure.
Hypertension is closely and directly related to the severity of obesity. Rabbits fed a high-fat, high-sucrose diet for 28 weeks showed an increase in systolic, diastolic, and mean blood pressure already at week 14, and this increase in blood pressure is maintained at week 28 (Figure 5C – E). Given the close relationship between blood pressure and BMI22, it is of great importance to ensure that animals gain weight progressively to obtain a significant increase in blood pressure.
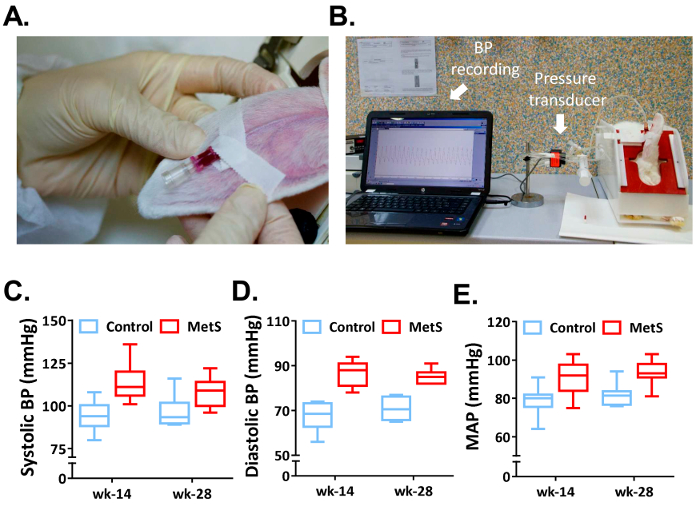
Figure 5: Modifications in blood pressure. Panel A depicts the catheter inserted in the auricular artery. Of note, given that the vein and the auricular artery run through the dentition of the ear very closely, it is of crucial importance to differentiate them. Before cannulation, it is advisable to warm up the ear and, after topical anesthesia, to tap gently the area where the vascular package runs. The artery has a thicker vascular wall and a lighter color than the vein, and blood pulses can be observed. Panel B shows the experimental setup with the pressure transducer, which is connected to an amplifier and records continuously the signal (BP recording). Panels C and D show box and whiskers plots of systolic and diastolic blood pressure at week 14 and 28 in both experimental groups. Mean arterial pressure (MAP) is presented in panel E. We found differences when comparing control vs. MetS at weeks 14 and 28 in systolic (main effect p = 0.003, η2 = 0.4; pairwise comparisons at week 14 p = 0.029 and week 28 p = 0.013), diastolic (main effect p = 0.027, η2 = 0.3; pairwise comparisons at week 14 p = 0.036 and week 28 p = 0.001) and MAP (main effect p = 0.006, η2 = 0.4; pairwise comparisons at week 14 p = 0.027 and week 28 p = 0.001). Control (n = 5), MetS (n = 6). Modified from Arias-Mutis et al.19 Please click here to view a larger version of this figure.
Finally, to assess the development of MetS, an evaluation of changes in plasma biochemical markers is needed. In this chronic model, we observed an alteration in the lipid profile as early as week 14, and this alteration remained stable until week 28, without further increases in the differences. Modifications in plasma lipid profile are characterized by an increase in triglycerides and LDL, a decrease in HDL, and no changes in total cholesterol in MetS animals versus controls at both time points (weeks 14 and 28) (Table 3).
| Week 14 | Week 28 | |||
| Control | MetS | Control | MetS | |
| Total cholesterol (mg·dL-1) | 20.4(2.3) | 24.0(9.1) | 27.4(15.7) | 21.2(4.4) |
| HDL (mg·dL-1) | 9.1(4.2) | 4.3(1.7) | 11.2(4.2) | 5.1(2.9) |
| LDL (mg·dL-1) | 3.8(1.1) | 8.7(4.5) | 4.0(1.2) | 13.8(9.3) |
| Triglycerides (mg·dL-1) | 71.2(58.8) | 118.0(40.7) | 30.2(11.4) | 76.8(28.2) |
Table 3: Assessment of plasma biochemistry. We found differences when comparing control vs. MetS at weeks 14 and 28 in HDL (main effect p = 0.008, η2 = 0.3; pairwise comparisons at week 14 p = 0.006 and week 28 p = 0.037), LDL (main effect p = 0.040, η2 = 0.2; pairwise comparisons at week 14 p = 0.028 and week 28 p = 0.034), and triglycerides (main effect p = 0.002, η2 = 0.4; pairwise comparisons at week 14 p = 0.004 and week 28 p = 0.001). Control (n = 5) and MetS (n = 6). Values are expressed as Mean (SD). Modified from Arias-Mutis et al.19
