Measuring Diurnal Rhythms in Autophagic and Proteasomal Flux
Summary
We describe our protocol for measuring biological rhythms in protein catabolism via autophagy and the proteasome in mouse liver.
Abstract
Cells employ several methods for recycling unwanted proteins and other material, including lysosomal and non-lysosomal pathways. The main lysosome-dependent pathway is called autophagy, while the primary non-lysosomal method for protein catabolism is the ubiquitin-proteasome system. Recent studies in model organisms suggest that the activity of both autophagy and the ubiquitin-proteasome system is not constant across the day but instead varies according to a daily (circadian) rhythm. The ability to measure biological rhythms in protein turnover is important for understanding how cellular quality control is achieved and for understanding the dynamics of specific proteins of interest. Here we present a standardized protocol for quantifying autophagic and proteasomal flux in vivo that captures the circadian component of protein turnover. Our protocol includes details for mouse handling, tissue processing, fractionation, and autophagic flux quantification using mouse liver as the starting material.
Introduction
Circadian rhythms refer to daily, predictable variations in biological function that are apparent throughout nature. They exist at every biological scale, from macroscopic behaviors like sleep-wake cycles, to molecular phenomena like the rhythmic abundance of biomolecules. In recent years, research into circadian rhythms has been transformed by the discovery of “clock genes” that are critical for circadian rhythm generation. Studies in clock gene knockout mice have revealed a central role for circadian rhythms in temporally organizing core cellular processes such as metabolism1. Among the ways circadian rhythms make this happen is by imparting a temporal structure to protein catabolism.
Several groups including ours have shown that the two major avenues for cellular protein catabolism, autophagy and the ubiquitin-proteasome system, are subject to diurnal rhythms2,3,4,5. Autophagy represents the lysosome-dependent arm of protein catabolism in which proteins of interest are delivered to this degradative organelle either through the construction of a novel vesicle (macroautophagy) or through direct translocation though a channel (chaperone mediated autophagy)6. The ubiquitin-proteasome system is the main non-lysosomal pathway, where proteins are poly-ubiquitinated and then fed into the proteasome, a macromolecular degradative machine found throughout the cytoplasm and nucleus7,8. Rhythms in autophagic and proteasomal activity are important because they likely play a role in cellular housekeeping. As a result, it is valuable to have a standardized procedure that can detect daily oscillations in protein catabolism that is compatible with pre-clinical disease models.
Here, we provide our protocol for quantifying diurnal variations in autophagic flux in mouse liver, which has served as the basis for work in our laboratory3,9. Our method is classified as a “turnover assay”10, an approach used by numerous groups to measure proteolytic activity (or flux). In this approach, protease inhibitors specific to lysosomes or proteasomes are administered to mice and then tissue samples are obtained after a fixed time interval. In parallel, tissue samples are obtained from mice subjected to sham injections. The tissue samples are homogenized and then biochemically separated to obtain the lysosome-enriched and cytoplasmic fractions. These fractions are then analyzed in parallel via western blotting using antibodies specific to macroautophagy markers (LC3b and p62) or proteasomal substrates (poly-ubiquitinated protein). Over time, animals injected with protease inhibitors accumulate proteins that would normally have been recycled. As a result, the rate of turnover is inferred by comparing the abundance of marker proteins in the protease-inhibitor treated samples to the sham-treated samples. By repeating this method at fixed time intervals across the day it is possible to reconstruct circadian variations in proteolysis (Figure 1A).
Protocol
The protocol described here was approved by the Washington University in St. Louis Animal Care and Use Committee (IACUC).
1. Mouse Housing and Experimental Design
- To detect daily rhythms in protein turnover, house mice (male or female C57BL/6J, 4−8 week old, 20−25 g) under standard 12 h light/dark cycles with food provided ad libitum. To avoid stressing the animals, acclimate mice for at least one week in the facility prior to use and avoid single housing. For proving that rhythms in protein catabolism are truly circadian (i.e., driven by the animal’s internal biological clock), house mice under constant dark conditions, taking care to avoid exposing the mice to exogenous light.
NOTE: For details about mouse housing for circadian rhythm experiments see the following reference11. - For each time point, allocate three mice as sham controls and at least three mice for each type of protease inhibitor used (leupeptin for autophagic flux and bortezomib for proteasomal flux measurements). Plan for six time points evenly spaced at 4 h intervals across the day/night cycle to obtain tissue samples.
NOTE: A 24 h, 6 time point experiment with phosphate-buffered saline (PBS), leupeptin, and bortezomib will require a total of 54 mice (3 per treatment x 3 treatments x 6 time points).
2. Preparation of Homogenization Solution, Inhibitor Stock Solutions, and Vials for Mouse Liver Collection
- Prepare fresh homogenization buffer (HB) and keep on ice: 10 mM Tris-HCl pH 7.5, 250 mM sucrose, 5 mM EDTA pH 8.0, and 1 protease inhibitor tablet per 100 mL.
NOTE: Approximately 10 mL of HB is needed per mouse. - For downstream processing of biological samples, each sample requires a 15 mL conical tube to hold the crude homogenate, a 15 mL tube to hold the post-nuclear supernatant, two 1.5 mL microcentrifuge tubes to hold the 3,000 x g and 20,000 x g pelleted material, respectively, and a 1.5 mL microcentrifuge tube to hold the cytoplasmic fraction. Add 7 mL of cold HB to each tube intended for crude homogenate and keep on ice.
- Prepare a 2 mg/mL stock solution of leupeptin hemi-sulfate in sterile PBS. Also prepare a 50 mg/mL solution of bortezomib in dimethyl sulfoxide (DMSO). Aliquot and store the solutions at -80 °C.
3. Protease Inhibitor Administration
- Thaw leupeptin (2 mg/mL) and bortezomib (50 mg/mL) stock solutions to room temperature 15 min prior to each time point. The leupeptin stock is ready for injection. Dilute the bortezomib in sterile PBS to yield a 50 µg/mL working solution.
NOTE: Bortezomib is light sensitive, so protect the working stock from light until use. - Weigh mice and perform intraperitoneal injections of “sham” PBS (0.5 mL), leupeptin (40 mg/kg), or bortezomib (1.6 µg/kg). Return mice to appropriately marked cages grouped by the type of injection they received. Record the time the mice are treated or manipulated in a standardized table (see Supplemental File “Sample Data”).
NOTE: A dose calculator is included as an aid in the Supplemental File “Sample Data”. It is important to perform injections expeditiously and in the same order from timepoint to timepoint to minimize variability.
4. Tissue Acquisition and Storage
- Two hours after injection, euthanize mice one at a time in accordance with the institutionally approved IACUC protocol. For example, anesthetize mice then euthanize by cervical dislocation. Proceed to the dissection step immediately following euthanasia.
NOTE: Ensure complete anesthesia before cervical dislocation by pinching front paws without an observable reflex. - Remove the left lobe of the liver by making a 1.5 to 2.0 cm incision with Metzenbaum scissors on the mouse’s ventral abdomen. Externalize the left lobe of the liver and excise it with surgical scissors. Submerge the liver sample in 7 mL of ice-cold HB in an appropriately labeled 15 mL conical tube. Keep the sample on ice throughout processing.
NOTE: The samples can be kept on ice or at 4 °C overnight before proceeding. If standard markers of macroautophagy and proteasomal activity are the only intended readouts, liver samples can be flash frozen in liquid nitrogen and stored at -80 °C for later processing. To examine other targets of degradation (e.g., via proteomics), process the samples without freezing. - Proceed to euthanize and dissect the next mouse until all samples are acquired. Process mice in the same group order they were injected and record the duration of this step (see Supplemental File “Sample Data”). Each mouse should be processed in under 5 min to limit difference in the exposure times for the injected inhibitors.
5. Biochemical Fractionation of Liver Samples
NOTE: Figure 1B shows the fractionation scheme.
- Transfer each liver sample and 7 mL of HB into a 15 mL capacity Dounce homogenizer. Homogenize the sample with 10 strokes of the loose piston and 15 strokes of the tight piston. Return the resultant crude homogenate to the 15 mL conical tube it originated from. Repeat until all liver samples have been homogenized.
- Spin crude homogenate samples at 700 x g for 10 min at 4 °C to pellet nuclei and debris. Transfer the top 4 mL of post-nuclear supernatant (S1) to a fresh 15 mL conical tube.
- Determine the protein concentration of fraction S1 using Bradford or bicinchoninic acid (BCA) assays according to the manufacturer’s instructions. Next equalize the concentrations of all samples to 2.1 mg/mL or to the desired concentration by adding fresh HB to S1 where needed. The normalized samples are the “Total Protein” (Tot) fraction. For downstream analytical purposes and quality improvement, aliquot 500 µL of the Tot fraction and store at -80 °C.
- Transfer 1.5 mL of the remaining Tot fraction into a microcentrifuge tube and spin at 3,000 x g for 15 min at 4 °C. Transfer 1 mL of the resultant supernatant (S2) to a fresh microcentrifuge tube and set on ice.
- Aspirate the remaining supernatant and wash the 3,000 x g pellet (3KP) twice with 1.5 mL of cold HB. The 3KP pellet can be stored dry at -80 °C if downstream proteomics are anticipated. If only western blotting is anticipated, resuspend the 3KP pellet in 200 µL of sodium dodecyl sulfate polyacrylamide gel electrophoresis (SDS-PAGE) sample buffer (Table of Materials) and boil at 95 °C for 5 min.
- Spin the S2 fraction at 20,000 x g for 20 min at 4 °C. Transfer the resultant supernatant (S3) to a fresh microcentrifuge tube. S3 is the cytoplasmic (Cyto) fraction. For SDS-PAGE, combine 150 µL of Cyto fraction with 50 µL of 4x SDS-PAGE sample buffer and boil at 95 °C for 5 min.
- Aspirate the remaining supernatant from the 20,000 x g pellet (20KP) and wash twice with 1.5 mL of cold HB. The 20KP pellet can be stored dry at -80 °C if downstream proteomics are anticipated. If only western blotting is anticipated, resuspend the 20KP pellet in 100 µL of SDS-PAGE sample buffer and boil at 95 °C for 5 min.
6. Western Blotting Readout
- In order to quantify macroautophagic and proteasomal flux via western blotting, compose a stock solution of purified GST-LC3b (2 µg/mL), p62-His6 (2 µg/mL), and Lys48 linked polyubiquitin (K48-Ub, 50 µg/mL) in 1x SDS-PAGE sample buffer. After boiling at 95 °C for 5 min, aliquot and store at -80 °C for future use.
- At the time of SDS-PAGE, generate a 6-point standard curve of the standard protein mixture by serially diluting 1:3 in 1x SDS-PAGE sample buffer. Load 10 µL of each standard curve sample onto a 26 well 4−12% SDS-PAGE midi-gel, followed by prestained protein standards (Table of Materials), a commercial molecular weight standard.
- For measuring autophagic flux, load 12 µL of 3KP sample into each well.
NOTE: Assuming sham, bortezomib, and leupeptin treatments were done and assuming 3 mice per treatment, each time point should consist of 9 samples. Therefore, each midi-gel can accommodate 2 time points plus the standard curve and a typical time series experiment will require 3 midi-gels for readout. - For measuring proteasomal flux, load 12 µL of Cyto fraction into each well.
- Separate protein samples by SDS-PAGE and transfer to polyvinylidene fluoride (PVDF) membranes using standard protocols. If western blotting for LC3b is anticipated, transfer gels using 20% methanol-containing transfer buffer. Otherwise, use 10% methanol-containing transfer buffer as this will enable more efficient transfer of high molecular weight protein species.
- Perform western blotting using standard protocols. For analyzing macroautophagic flux, blot membranes containing 3KP samples with anti-p62 or anti-LC3b antibodies (1:1,000) overnight at 4 °C. For analyzing proteasomal flux, blot membranes containing Cyto samples with anti-Lys48 specific polyubiquitin (1:1,000) overnight at 4 °C.
- Image western blots using standard secondary antibodies and imaging devices. Image all membranes that constitute a given time series experiment together.
7. Data Analysis
NOTE: See Supplemental File “Sample Data”.
- To perform densitometry on western blot samples, use standard graphics software, Image Studio, or alternatively ImageJ.
- Perform densitometric measurements on bands of interest for both the standard curve and the experimental samples. In Image Studio, using p62 as an example, draw a long rectangle encompassing protein monomer at the bottom and extending to the top of the membrane. Copy, paste, and move the rectangle to the remaining samples. It is important to keep the rectangle used for quantification consistent between samples.
- Save the quantification to a spreadsheet by pressing Report and Launch Spreadsheet at the bottom right of the analysis window.
- Generate a densitometric standard curve with spreadsheet using the serially diluted standard sample and use either linear or polynomial regression to obtain a best fit standard curve equation. Using this equation, extrapolate the quantity of p62, LC3b-II or Lys48-poly Ub in the experimental samples.
- To obtain flux measurements, subtract the extrapolated protein quantity of each inhibitor-treated sample from the average value of the PBS samples from the same time point (see Supplemental File “Sample Data”).
- Evaluate the statistical significance of temporal variation in protein turnover using 1-way ANOVA. This can be done using standard spreadsheet software.
Representative Results
Representative data are presented in Figure 2A,B, and the quantification of these data are provided in Figure 2C,D (see also Supplemental File “Sample Data”). For simplicity, we have not depicted loading controls in Figure 2 but these should be obtained in parallel. Typically, western blots against β-actin are used for this purpose, but a total protein stain (such as Ponceau S) will suffice. The primary readout for autophagic flux at any given time point is the difference in the amount of macroautophagy specific markers (p62 or LC3b-II) between the leupeptin-treated versus sham samples in the lysosome enriched 3KP fraction divided by 2 (the number of hours between injection of protease inhibitor and tissue harvest). Similar data can be obtained from 20KP samples, which are also lysosome enriched, but our experience in mouse liver is that most of the signal segregates in the 3KP fraction. Typically, the results are normalized to the mean which simplifies comparison across independent experiments (Figure 2C,D). The primary readout for proteasomal turnover is the difference in the amount of Lys48-polyubiquitinated protein between the bortezomib-treated versus sham samples in the cytosolic (“Cyto”) fraction divided by 2. Because p62 can be a target of both macroautophagy and the proteasome3, an alternative marker for proteasomal flux is the change in p62 content +/- bortezomib in the 3KP fraction (see Sample Data). However, we find this marker is less robust compared to Lys48-polyubiquitinated protein and is best used as supportive data.
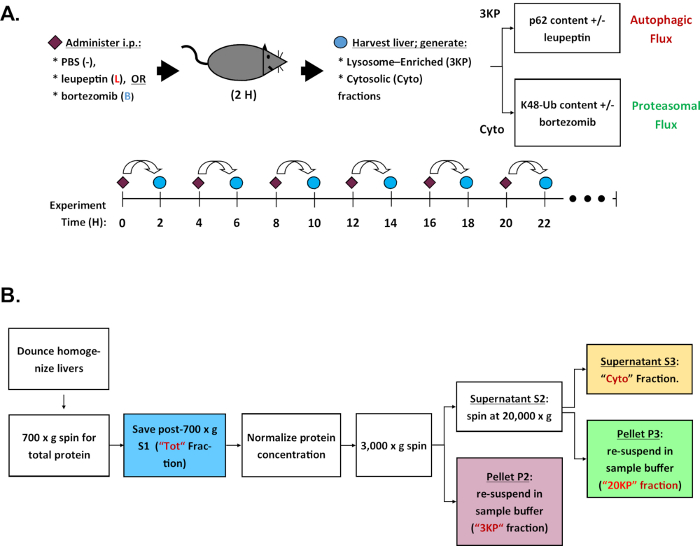
Figure 1: Experiment steps and sample processing. (A) Schematic of a typical time series experiment to measure daily rhythms in autophagic and proteasomal activity (flux) in mouse liver. (B) Fractionation scheme for obtaining lysosome-enriched and cytosolic liver protein fractions for western blot analysis. Please click here to view a larger version of this figure.
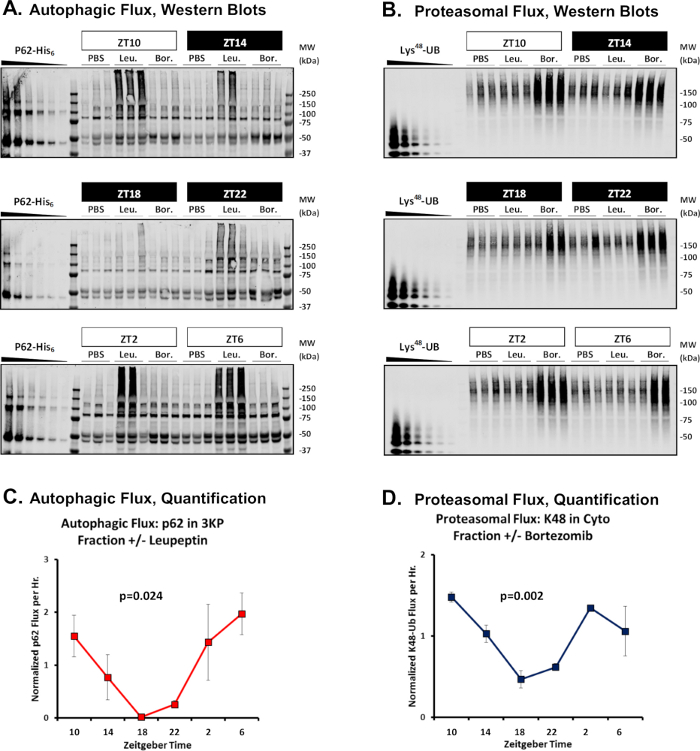
Figure 2: Sample experimental results of flux. Western blots from a representative time series experiment to measure daily rhythms in autophagic flux (A), and proteasomal flux (B) in mouse liver. Note that under leupeptin-treated conditions, p62 runs as ladder ranging from the monomeric form at about 50 kDa to SDS-stable complexes at about 250 kDa. Times of day are depicted in units of zeitgeber time (ZT), where ZT0 represents lights on and ZT12 represents lights off. Observation times that fall during lights off are shaded black. (C,D) Quantification of these data. Each data point represents the mean ± SE (n = 3). Statistical significance via one-way ANOVA is depicted. Please see the Supplemental File “Sample Data” for a tabular representation of these data. Please click here to view a larger version of this figure.
Supplementary file: Sample data. Laboratory analysis of densitometric data and subsequent statistical analysis. Please click here to download this file.
Discussion
Our protocol describes a technically straightforward means of measuring biological rhythms in protein turnover in mice using commonly available molecular biology equipment. Because of the length of time series experiments and the number of biological samples involved, it is important to be consistent across the entire experiment regarding how the mice are injected, the timing of tissue acquisition and the biochemical processing of samples. The injection, euthanasia, and cervical dislocation steps may require operator practice prior to initiating a full-scale experiment. It is best for a single operator to perform all tissue dissections since different individuals dissect at different speeds, but if this is infeasible it may be worthwhile to increase the time between protease inhibitor injection and tissue harvest from 2 h to 3 or 4 h (provided this is done consistently across time points).
Common reasons for troubleshooting include variability in flux between biological replicate samples, and poor western blot quality. Regarding sample variability, this can be due to the use of multiple operators with different dissecting speeds or levels of experience. This can be mitigated by executing practice experiments until average dissecting times are less than 5 min per mouse. Alternatively, a single operator can be used to carry out dissections. High background on western blots can arise from uneven transfer, inadequate blocking, low quality primary antibody, or inadequate washing steps. Best results are achieved by overnight wet transfer of SDS-PAGE separated protein samples to PVDF in 10−20% methanol containing transfer buffer, using 10% non-fat dry milk for blocking, and extensive washing between steps (3x 10 min minimum on a mechanical rocker).
This technique has several limitations.First, the protocol described requires significant numbers of animals and is therefore resource intensive. While a minimal time series experiment spans 24 h, experiments of at least 2 cycles are ideal for confirming that the daily variations being observed in protein turnover are reproducible, and for estimating rhythm characteristics like periodicity and phase12. Because time must elapse between when the protease inhibitors are administered to mice and the time samples are harvested (to allow for targets of proteolysis to accumulate), the turnover measurements obtained represent an average activity over a 2 h interval rather than a point estimate. As a result, there is a limit to the resolution this assay can provide for detecting dynamic changes in protein catabolism. Finally, this protocol is optimized for mouse liver and the biochemical fractionation procedure presented here would likely need to be modified to efficiently obtain lysosomes from other tissue types.
This is the first method to directly measure daily rhythms in autophagic flux that also enables proteome-wide observations of this phenomenon. Future applications of this technique include analysis of proteolytic rhythms in various disease models, including autoimmune disease, cancer, and acute infection. In principal this method can be adapted to other mouse organs and to explanted human samples, which represents an exciting future application with high translational potential.
Declarações
The authors have nothing to disclose.
Acknowledgements
This work was funded by RO1HL135846 and a Children’s Development Institute grant (PD-II-2016-529).
Materials
| 4x SDS PAGE Sample Buffer | Invitrogen | Cat# NP0008 | |
| Bortezomib | EMD Millipore | Cat# 5.04314.0001; CAS: 179324-69-7 | |
| Image Studio | LICOR | N/A | |
| Immobilon-FL PVDF membrane 0.45 micron | Merck Millipore Ltd | Cat# IPFL00010 | |
| K48-linkage Specific Polyubiquitin (D9D5) Rabbit mAb | Cell Signaling Technology | Cat#8081S; RRID:AB_10859893 | |
| LC3a | Boston Biochem | Cat# UL-430 | |
| LC3b antibody | Novus | Cat#NB100-2220; RRID:AB_10003146 | |
| LC3b antibody | Cell Signaling Technology | Cat#2775; RRID:AB_915950 | |
| Leupeptin | Sigma | Cat# L2884; CAS: 103476-89-7 | |
| NuPAGE 4-12% Bis-Tris Midi Protein Gels | Thermo Fisher Scientific | Cat# WG1403BOX | |
| NuPAGE LDS Sample Buffer (4x) | Thermo Fisher Scientific | Cat# NP0007 | |
| P62-his | Novus | Cat# NBP1-44490 | |
| Precision Plus Protein All Blue Prestained Protein Standards | Bio-Rad | Cat# 1610373 | |
| Rabbit Anti-p62/SQSTM1 | Millipore-Sigma | Cat#P0067; RRID:AB_1841064 | |
| rhPoly-Ub WT (2-7) (K48) | Boston Biochem | Cat# UC-230 | |
| SDS-PAGE Midi-size Gels | Invitrogen | Cat# WG1403 | |
| SIGMAFAST Protease Inhibitor Tablets | Millipore-Sigma | Cat# S8830 |
Referências
- Green, C. B., Takahashi, J. S., Bass, J. The meter of metabolism. Cell. 134 (5), 728-742 (2008).
- Ma, B. Y., et al. LPS suppresses expression of asialoglycoprotein-binding protein through TLR4 in thioglycolate-elicited peritoneal macrophages. Glycoconjugate Journal. 24 (4-5), 243-249 (2007).
- Ryzhikov, M., et al. Diurnal Rhythms Spatially and Temporally Organize Autophagy. Cell Reports. 26 (7), 1880-1892 (2019).
- Martinez-Lopez, N., et al. System-wide Benefits of Intermeal Fasting by Autophagy. Cell Metabolism. 26 (6), 856-871 (2017).
- Desvergne, A., et al. Circadian modulation of proteasome activity and accumulation of oxidized protein in human embryonic kidney HEK 293 cells and primary dermal fibroblasts. Free Radical Biology and Medicine. 94, 195-207 (2016).
- Levine, B., Mizushima, N., Virgin, H. W. Autophagy in immunity and inflammation. Nature. 469 (7330), 323-335 (2011).
- Ciechanover, A. Intracellular protein degradation: from a vague idea thru the lysosome and the ubiquitin-proteasome system and onto human diseases and drug targeting. Cell Death & Differentiation. 12 (9), 1178-1190 (2005).
- Collins, G. A., Goldberg, A. L. The Logic of the 26S Proteasome. Cell. 169 (5), 792-806 (2017).
- Haspel, J., et al. Characterization of macroautophagic flux in vivo using a leupeptin-based assay. Autophagy. 7 (6), 629-642 (2011).
- Klionsky, D. J., et al. Guidelines for the use and interpretation of assays for monitoring autophagy (3rd edition). Autophagy. 12 (1), 1-222 (2016).
- Eckel-Mahan, K., Sassone-Corsi, P. Phenotyping Circadian Rhythms in Mice. Current Protocols in Mouse Biology. 5 (3), 271-281 (2015).
- Hughes, M. E., et al. Guidelines for Genome-Scale Analysis of Biological Rhythms. Journal of Biological Rhythms. 32 (5), 380-393 (2017).
