Growing cultures of cells for microscopy
1. One or two days prior to imaging, prepare the B. subtilis strain containing the translational fusion protein you wish to visualize. Trial rounds of steps 1A and 1B will be necessary to determine which growth condition provides the best images of your strain. In most cases, cells should be imaged during exponential growth phase.
- For some B. subtilis strains (in particular, strains that grow poorly due to the integration of the translational fusion between the gene of interest and GFP at its endogenous locus), initial growth for two days prior to imaging is necessary for high quality images. On the first day, streak the B. subtilis strain to be imaged on LB agar with selective antibiotic(s) and incubate overnight at 30°C. On the second day, inoculate 100 μl of 0.85% saline with a single colony and perform three 10-fold serial dilutions on LB agar plates (with selective antibiotics), plating 100 μL of each dilution, followed by incubation overnight at 30°C. On the third day, select the dilution plate with light confluent growth of cells. Light confluent growth on a plate will provide the growth medium with a healthy, exponentially growing starter inoculum to potentially yield excellent imaging results (see step 4). This step is particularly useful for the highest quality membrane imaging with the stain FM4-64.
- Other B. subtilis strains may simply be applied to selective LB agar medium for single colonies with a sterile stick the day prior to imaging and incubate overnight at 30°C. The following day, cells on this plate will be sufficient to use as an inoculum for imaging (see step 4).
NOTE: For B. subtilis, overnight cultures in liquid medium are not appropriate due to a combination of spore formation and quorum responses, which will cause an extended period of lag phase growth 1.
2. On the morning of imaging, place 10 mL of S750 1-3 medium into a 125 mL sterile Erlenmeyer flask.
3. Resuspend the cells in up to 2 mL of S750 medium from the LB agar plate with single colonies or the light confluent cells to obtain an inoculum.
4. Add enough S750 medium-cell inoculum to the Erlenmeyer flask containing 10 mL S750 medium for a culture with an initial optical density measured at 600 nm (OD600) of ~0.08 to 0.1. At this step it is important to have at least a 10-fold air to medium ratio. Thus, we use 10 to 12.5 mL of inoculated medium in a 125 mL Erlenmeyer flask.
5. Grow each culture at 30°C until the culture reaches an OD600 ~0.5-0.8. Shaking water baths are preferred with revolutions per minute from 150-200. Cultures challenged with DNA damaging or mismatch inducing agents should be at an early exponential growth phase OD600 such that the cells will reach the target OD600 with the additional period of growth that is required for treatment (see Table 1)
For example, 2-aminopurine requires one hour of treatment, and therefore a culture treated with 2-aminopurine should be at OD600~0.3-0.4, such that the one hour of treatment/growth results in an OD600~0.5-0.8, whereby cells are ready for imaging.
Sample Preparation
1. Pipette 300 μl of cultured cells into a 1.5 mL microcentrifuge tube.
2. If imaging of cellular membranes is desired, add 1:1000 dilution of FM4-64 membrane stain (Invitrogen) to each sample from a 1 mg/mL stock solution. A titration of FM4-64 may be required to achieve the desired fluorescence signal. A typical titration range is 1:100, 1:1000, and 1:10,000.
3. Allow the samples to sit at room temperature for up to ten minutes or while the slide is being prepared with 1% agarose in 1X Spizizens medium as described below (see step 1 of “slide preparation”).
4. If concentration of cells is required, we prefer filtering cells using a 0.2 μm filter with a vacuum apparatus. Cells can then be gently washed from the surface of the filter with PBS, another appropriate buffer or medium prior to visualization.
Slide Preparation
1. Prepare 1% agarose with 1X Spizizens.
Add 5 mL of 10X Spizizens stock to 45 ml ddH2O along with 0.5 g agarose, and microwave to melt. Hot molten agarose is difficult to pipette, and solidified agarose will not enter the pipette tip. The agarose should be equilibrated in a water bath to a temperature of ~55-65°C for it to enter the pipette tip without solidifying within the tip.
2. Draw 20 μl of Spizizens with 1% melted agarose into the pipette tip. Pipette a single drop (approximately 1-2 μL) of the agarose solution into each slide well (we use 15-well slides, see Table 2) to form shallow agarose pads. The agarose will solidify immediately. Slides must also be made immediately prior to application of the cells. If the agarose pads are left at room temperature alone, they can dehydrate within minutes and become unusable.
Agarose pads should be centered and fill each well but have minimum height to avoid disrupting the coverslip; if droplets are too high (bubble-like) or if the sample spreads beyond the well boundary, simply swipe the well clean with a Kimwipe and apply a new agarose pad.
3. Apply the entire 300 μl sample (see step 6) to the slide, distributed on the top of each agarose pad. This amount of cells should be sufficient to cover each well on the slide.
4. Allow the slide loaded with cells to sit at room temperature (23°C) for approximately ten minutes. This step will allow for the cells to settle on the agarose pad becoming immobile and ready for imaging. For specialized needs this temperature may need to be changed, for example, when performing experiments that require a temperature shift4.
5. Aspirate away the excess medium from each well without removing the pads themselves.
6. Apply the coverslip to the slide, pressing firmly and evenly, but gently, across the area of the slide. Check to make sure that the cover slip is against the slide and that the cover slip is not raised above the slide.
Visualization of cells
1. Many different fluorescence microscopes will work well. It is critical to have a 100X oil immersion lens. The Simmons Lab uses:
- Olympus BX61 microscope equipped with 1,45 NA TIRFM 100X oil immersion objective lens
- Hamamatsu ORCAR2 CCD cooled camera
- Lumen 200 arc metal (Prior) light source.
- For detection of GFP (FITC), filter excitation 460-500 and emission 510-560
- For detection of FM4-64 (TRITC), filter excitation 510-560 and emission 572-648.
- Images were captured using SlideBook 4.2 (Figure 1)
2. Bring the cells into focus using white light.
3. Capture the image using appropriate filters for each fluorophore.
Representative Results
Representative images are shown (Figure 1). GFP foci should be well defined, while FM4-64 staining should be bright and clear 4-7. GFP or membrane images can be pseudo-colored with any color, to allow for the highest quality image to be presented without losing any data.
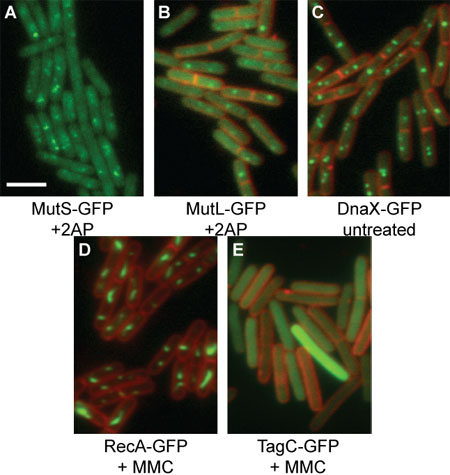
Figure 1: Representative GFP images of B. subtilis translational fusion proteins. GFP proteins are shown in green, while FM4-64 membrane staining is shown in red. The white scale bar indicates 3 μm. (A) MutS-GFP [relevant genotype: mutS–gfp (spc), amyE::PspacmutL (cat)] in the presence of 600 μg/mL 2-aminopurine and 1 mM IPTG. FM4-64 signal is not presented in order to more clearly show the MutS-GFP foci. (B) MutL-GFP [relevant genotype: mutL::mutL-GFP (spc)] in the presence of 2-aminopurine. (C) DnaX-GFP [relevant genotype: dnaX::dnaX-GFP (spc)]. (D) RecA-GFP [relevant genotype: recA::recA-GFP (spc)] in the presence of 20 ng/mL mitomycin C. (E) TagC-GFP [relevant genotype: tagC::tagC-GFP (spc)] in the presence of 1 μg/mL mitomycin C.
| Treatment /concentration or amount | Function | Time of incubation |
| Mitomycin C (MMC) [20 to 150 ng/mL] | DNA alkylating agent | 1 hour |
| 2-aminopurine (2-AP) [600 μg/mL] | mismatch inducing | 1 hour |
| Hydroxyurea (HU) | depletes dNTPs | 3 hours |
| ultraviolet light (UV) 20 J/m2 | Thymine-thymine dimers and 6-4 photoproducts | varies depending on source, usually 20 seconds |
| grays (ionizing radiation) 5 to 100 Gy | Double strand breaks, single strand breaks and base damage sites | varies depending on source |
Table 1. Summary of DNA damaging and mismatch inducing treatments
| Name of the reagent | Company | Catalogue number | Comments (optional) |
| Multitest slide, 15-well | MP Biomedicals | 6041505E | |
| Microscope Cover Glass | Fisher | 12-544-B | |
| Agarose | Fisher | BP160-500 | |
| Mitomycin C | Sigma | M0503-2MG | mutagen, wear gloves |
| 2-Aminopurine | Sigma | A3509-250MG | gloves |
| Hydroxyurea | Sigma | H8627-25G | gloves |
| FM4-64 | Invitrogen | T13320 | light sensitive |
Table 2. List of specific reagents and equipment:
