Here we present a practical guide of building an integrated microscopy system, which merges conventional epi-fluorescent imaging, single-molecule detection-based super-resolution imaging, and multi-color single-molecule detection, including single-molecule fluorescence resonance energy transfer imaging, into one set-up in a cost-efficient way.
Fluorescence microscopy is a powerful tool to detect biological molecules in situ and monitor their dynamics and interactions in real-time. In addition to conventional epi-fluorescence microscopy, various imaging techniques have been developed to achieve specific experimental goals. Some of the widely used techniques include single-molecule fluorescence resonance energy transfer (smFRET), which can report conformational changes and molecular interactions with angstrom resolution, and single-molecule detection-based super-resolution (SR) imaging, which can enhance the spatial resolution approximately ten to twentyfold compared to diffraction-limited microscopy. Here we present a customer-designed integrated system, which merges multiple imaging methods in one microscope, including conventional epi-fluorescent imaging, single-molecule detection-based SR imaging, and multi-color single-molecule detection, including smFRET imaging. Different imaging methods can be achieved easily and reproducibly by switching optical elements. This set-up is easy to adopt by any research laboratory in biological sciences with a need for routine and diverse imaging experiments at a reduced cost and space relative to building separate microscopes for individual purposes.
Fluorescence microscopes are important tools for the modern biological science research and fluorescent imaging is routinely performed in many biology laboratories. By tagging biomolecules of interest with fluorophores, we can directly visualize them under the microscope and record the time-dependent changes in localization, conformation, interaction, and assembly state in vivo or in vitro. Conventional fluorescence microscopes have a diffraction-limited spatial resolution, which is ~200 – 300 nm in the lateral direction and ~500 – 700 nm in the axial direction1,2, and are, therefore, limited to imaging at the 100s of nanometers-to-micron scale. In order to reveal finer details in the molecular assembly or organization, various SR microscopies that can break the diffraction limit have been developed. Strategies used to achieve SR include non-linear optical effects, such as stimulated emission depletion (STED) microscopy3,4 and structured illumination microscopy (SIM)5,6,7, stochastic detection of single molecules, such as stochastic optical reconstruction microscopy (STORM)8 and photoactivated localization microscopy (PALM)9, and a combination of both, such as MINFLUX10. Among these SR microscopies, single-molecule detection-based SR microscopes can be relatively easily modified from a single-molecule microscope set-up. With repetitive activation and imaging of photoactivatable fluorescent proteins (FPs) or photo-switchable dyes tagged on biomolecules of interest, spatial resolution can reach 10 – 20 nm11. To gain information on molecular interactions and conformational dynamics in real-time, angstrom-to-nanometer resolution is required. smFRET12,13 is one approach to achieve this resolution. Generally, depending on the biological questions of interest, imaging methods with different spatial resolutions are needed.
Typically, for each type of imaging, specific excitation and/or emission optical configuration is needed. For instance, one of the most commonly used illumination methods for single-molecule detection is through total internal reflection (TIR), in which a specific excitation angle needs to be achieved either through a prism or through the objective lens. For smFRET detection, emissions from both donor and acceptor dyes need to be spatially separated and directed to different parts of the electron-multiplying, charge-coupled device (EMCCD), which can be achieved with a set of mirrors and dichroic beam splitters placed in the emission path. For three-dimensional (3-D) SR imaging, an optical component, such as a cylindrical lens14, is needed to cause an astigmatism effect in the emission path. Therefore, homebuilt or commercially available integrated microscopes are, usually, functionally specialized for each type of imaging method and are not flexible to switch between different imaging methods on the same set-up. Here we present a cost-effective, hybrid system that provides adjustable and reproducible switches between three different imaging methods: conventional epi-fluorescent imaging with diffraction-limited resolution, single-molecule detection-based SR imaging, and multi-color single-molecule detection, including smFRET imaging (Figure 1A). Specifically, the set-up presented here contains fiber-coupled input lasers for multi-color excitation and a commercial illumination arm in the excitation path, which allows programmed control of the excitation angle, to switch between epi-mode and TIR mode. In the emission path, a removable homebuilt cylindrical lens cassette is placed within the microscope body for 3-D SR imaging, and a commercial beam splitter is placed before an EMCCD camera that can be selectively enabled to detect multiple emission channels simultaneously.
1. Microscope Design and Assembly
2. Emission path
NOTE: The emission path is composed of a removable cylindrical lens, a barrier filter wheel, an emission splitter, and an EMCCD camera (Figure 1G). To attain the best point spread function (PSF) of single molecules, the DIC prism is put away from the objective lens.
3. Diffraction-limited Imaging with Epi-excitation
4. Multi-channel Single-molecule Imaging Including smFRET
NOTE: Move to an “empty” position in the barrier filter wheel, so that all the emission with any wavelength can reach to the second set of filters/dichroic beam splitters in the emission splitter.
5. SR Imaging
NOTE: This is single-molecule detection-based SR microscopy.
This microscope allows flexible and reproducible switching between different imaging methods. Here we show sample images collected with each imaging module.
Figure 5D demonstrates the PSF of the blinking-on molecule during the SR acquisition. Thousands of such images are reconstructed to generate the final SR image (Figure 5E). Figure 5E shows the same bacterial regulatory RNAs as shown in the epi-fluorescence image in Figure 7A. Figure 7 shows the representative epi-fluorescence images of a small regulatory RNA in Escherichia coli cells and an mRNA in U2OS mammalian cells. Both RNAs are labeled with fluorophore-tagged DNA oligo through in situ hybridization17. Figure 8 shows the representative smFRET measurement of folded RNA molecules labeled with donor dye (green dye) and acceptor dye (red dye). The complexes are immobilized on the microscope slide, and excited by TIRF illumination. Fluorescence intensity trajectories can be extracted from individual single molecules, generating FRET efficiency as a function of time.
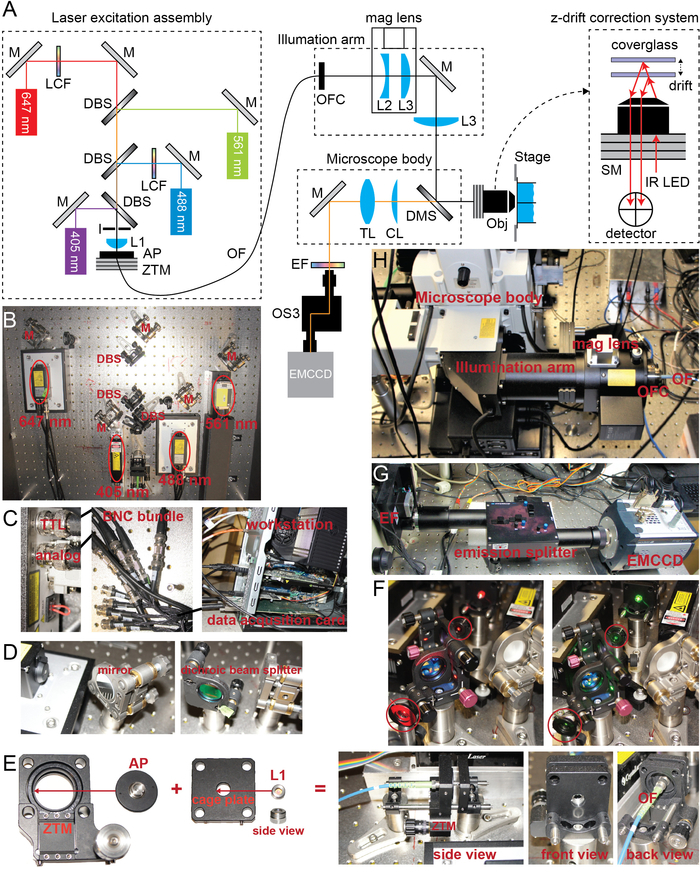
Figure 1: The design of the microscope set-up. (A) This panel shows a diagram of the set-up. M = mirror, DBS = dichroic beam splitter, LCF = laser clean-up filter, I = iris, L = lens, AP = adapter plate, ZTM = z-axis translational mount, OF = optical fiber, OFC = optical fiber coupling, CL = cylindrical lens, TL = tube lens, EF = emission filter(s), Obj = objective lens, and SM = step motor. The z-drift correction system moves the step motor on the nosepiece of the objective lens to the opposite direction of the z-drift, which is calculated by the infrared (IR) signal generated by its own LED and detected by its own detector. (B) This panel shows the laser excitation assembly. Four lasers are combined through mirrors and dichroic beam splitters and are then directed to an optical fiber through a focusing lens and an adapter plate sitting on a translational mount (bottom of the picture). (C) This panel shows the laser modulation. Two Bayonet Neill-Concelman (BNC) cables are connected to each of the laser (either the head or the controller, depending on the manufacturer) for TTL and analog modulation (leftmost panel). BNC cables are combined into a single cable (middle panel) which is connected to a data acquisition card in a workstation (rightmost panel) for computer control. (D) This panel shows the mirror and dichroic beam splitter mounts. (E) Building a fiber coupler in a cage system. A fiber adapter plate (AP) is mounted in a z-axis translation mount (ZTM) so that its distance to the achromatic double lens (L1, side view shown) can be modulated. AP and ZTM have matching threads, same as L1 and the cage plate. (F) A pair of irises (encircles) are installed during the alignment procedure for multiple lasers. They are used to ensure that the 647-nm laser (left panel) and the 561-nm laser (right panel) go through the same path. (G) A partial portion of the emission path is shown. Outside of the microscope body, the emission filter wheel, the emission splitter, and the EMCCD camera are installed in order. (H) This panel shows the illumination arm assembly. The mag lens is inserted into the illumination arm. The excitation laser beams are sent to the illumination arm through the optical fiber and the optical fiber coupling (at the right-hand side of the picture). Please click here to view a larger version of this figure.
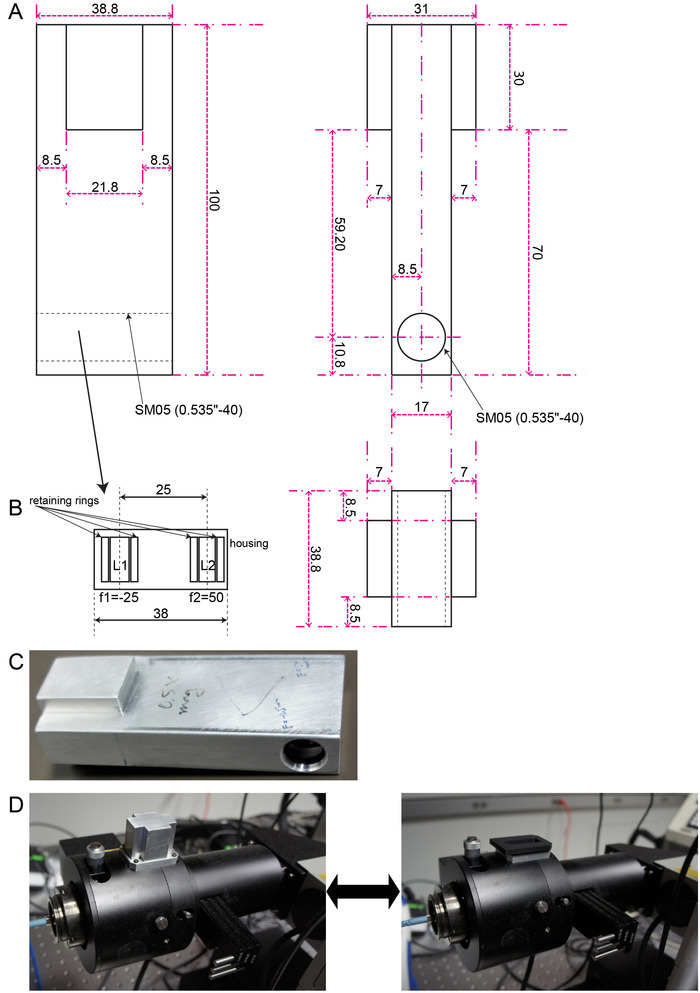
Figure 2: The mag lens. (A) This panel shows orthographic projections of the holder housing lenses for magnifying laser beams (unit: mm). This design is intended to be fit into the illumination arm. (B) This panel shows an internal drawing of the hole in the holder where two lenses get in. L1 is a concave lens and L2 is a convex lens, and the distance between them is the sum of their focal lengths. (C) This is a photo of the mag lens. (D) The mag lens can be inserted in the illumination arm to expand or focus the laser beams (left) or can be removed to keep the laser beams unchanged (right). Please click here to view a larger version of this figure.
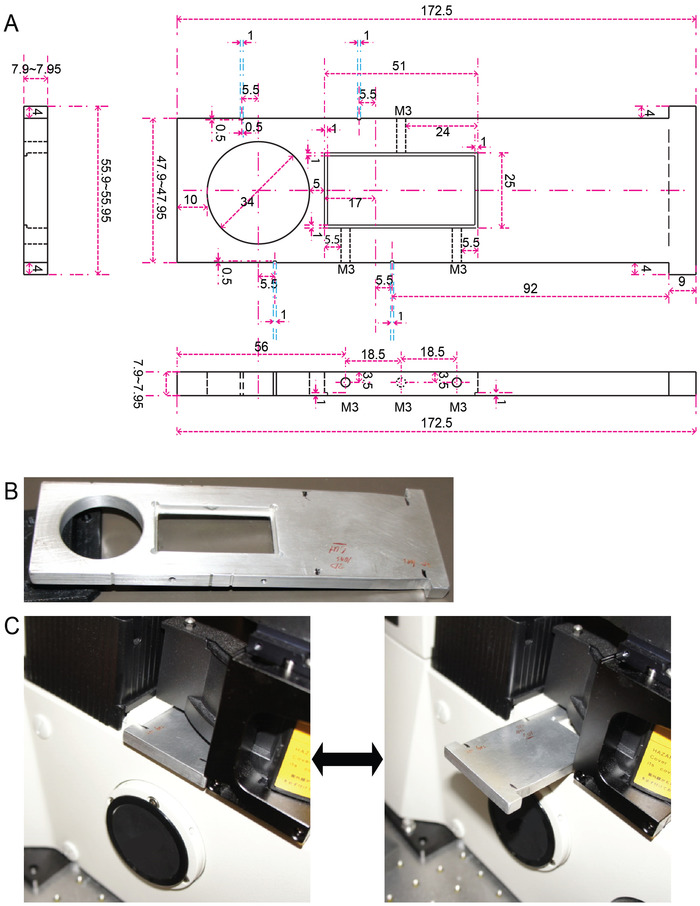
Figure 3: The 3-D lens. (A) This panel shows orthographic projections of the holder having a blank circular hole for the bypass mode and a rectangular hole for holding the cylindrical lens (unit: mm). This design is intended to be fit to the DIC analyzer slider in a microscope body. (B) This is a photo of the 3-D lens. (C) The cylindrical lens can be engaged in the emission beam path to cause PSFs with astigmatism (left) or can be disengaged for the bypass mode, keeping the PSFs intact (right). Please click here to view a larger version of this figure.
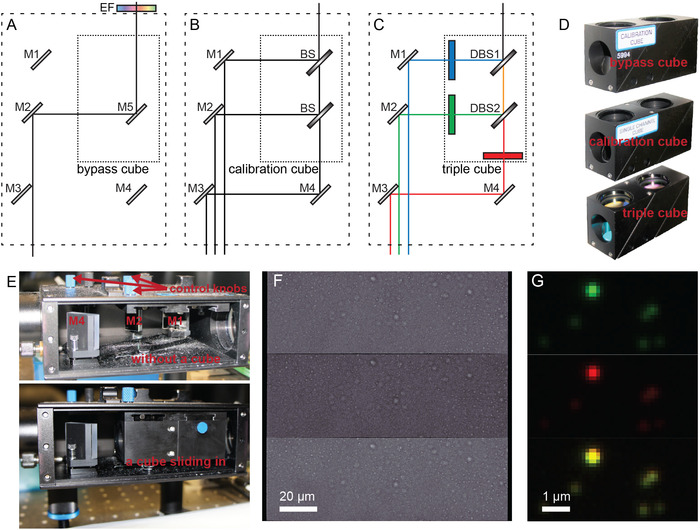
Figure 4: Multi-channel alignment of the emission splitter. Schemes of optics and light path are shown in the emission splitter with (A) a bypass cube, (B) a calibration cube, and (C) a triple cube. M = mirror. The bypass cube has a mirror inside (M5) and is supposed to be used with an emission filter (EF) in the barrier filter wheel. The calibration cube has beam splitters (BS) that allow lights to go through all channels. The triple cube has two dichroic beam splitters (DBS), as well as three emission filters. (D) These are photos of the three cubes. (E) The internal of the emission splitter is shown without a cube (upper panel) and with a cube (lower panel) sliding in. M3 is behind M4 and not captured in the photo. Control knobs for the mirrors are on top of the emission splitter (upper panel). (F) This panel shows channel alignment using the calibration cube under DIC. (G) This panel shows a fine alignment of the green (top panel) and red (middle panel) channels using 100-nm multichannel beads and a triple cube. A merged image of the two channels is also shown (bottom panel). Please click here to view a larger version of this figure.
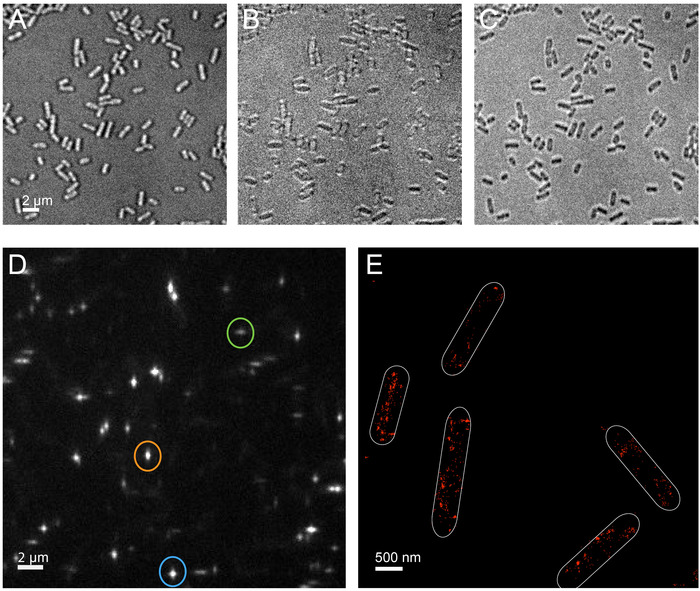
Figure 5: Representative SR image acquisition. These panels show a representative DIC image (A) below, (B) at, or (C) above the central plane of the cells. (D) This panel shows an example of the PSF of the blinking-on fluorophores. The orange circle surrounds a "vertical" PSF. The green circle surrounds a "horizontal" PSF. The blue circle surrounds a diamond-shaped PSF, representing fluorophores at a focused plane. (E) This panel shows a representative reconstructed SR image. A small regulatory RNA is labeled with fluorescence in situ hybridization with red dye. The white borders mark the edges of the cells. Please click here to view a larger version of this figure.
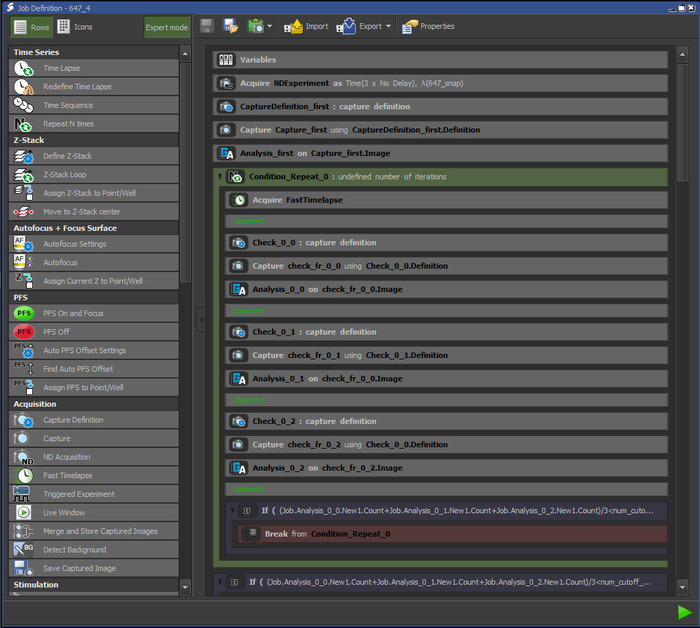
Figure 6: A programmed data acquisition code for SR imaging. In this programmable acquisition module, various execution commands and microscope control functions are listed in the left panel and can be selected to create programmed acquisition code. The commands are executed sequentially from top to bottom. This screenshot shows an example where a predefined certain number of iterated imaging acquisitions are conducted until the acquisition is posed and the number of spots in three sequential image frames is calculated. If the average number of these spots are above the threshold (defined as 50% of the number of cells in bacterial imaging), the image acquisition continues in the same loop. If below the threshold, then the image acquisition continues in the next loop where stronger violet laser power is used (cut at the bottom of the screenshot). Please click here to view a larger version of this figure.
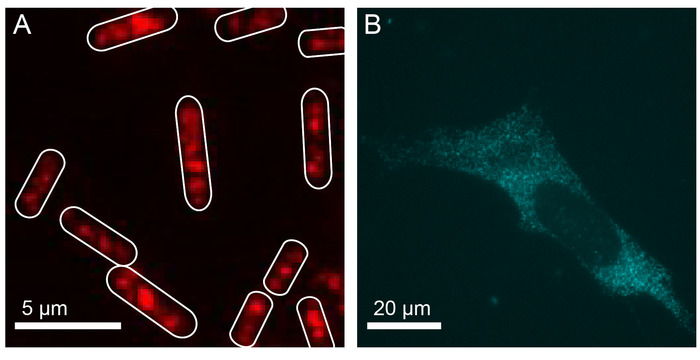
Figure 7: Representative epi-fluorescence images. (A) This panel shows a small regulatory RNA in E. coli cells. (B) This panel shows an mRNA in U2OS mammalian cells. RNAs are labeled with red dye and blue dye through fluorescence in situ hybridization. Please click here to view a larger version of this figure.
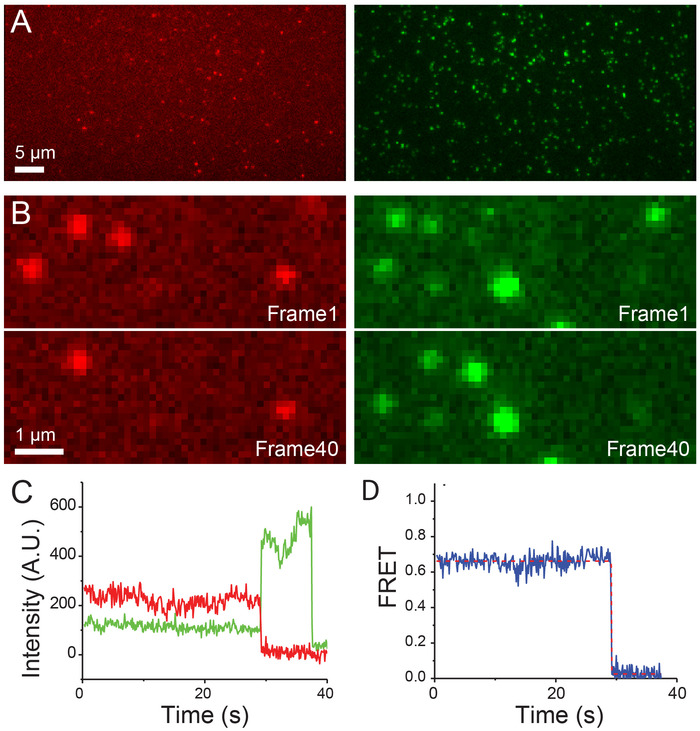
Figure 8: Example of smFRET imaging. (A) Samples were excited with the 561-nm laser. (B) Emissions from the green and red dyes are collected simultaneously and shown as green (right) and red (left) spots, respectively. (C) This panel shows the representative fluorescence intensity vs. time trajectories of green dye (green) and red dye (red) from one molecule. (D) This panel shows the FRET efficiency vs. the time trajectory (solid blue line) calculated as IAcceptor/(IDonor + IAcceptor) from one molecule of the sample. The FRET trace is fitted with the Hidden Markov Model (dashed red line). Please click here to view a larger version of this figure.
This hybrid microscope system eliminates the need to purchase multiple microscopes. The total cost for all parts, including the optical table, table installation labor, software, and workstation, is about $230,000. Custom-machined parts, including the mag lens and 3-D lens, cost around $700 (the cost depends on the actual charges at different institutes). Typical commercially available integrated systems for single-molecule detection-based SR microscopy cost more than $300,000 ~ 400,000 and are not readily available for smFRET measurement, or epi-imaging for a reasonable field of view, without white light source. Thus, the approach presented here can achieve imaging capabilities equivalent to multiple microscopes at a significantly reduced cost.
This modulated microscope system can be based on microscope bodies from different manufacturers. The 3-D lens can potentially be installed in any position in the emission path, including inside the emission splitter, within the microscope body, or in available space between the filter wheel and the objective nosepiece. However, the physical location of the 3-D lens will determine its focal length for achieving the best astigmatism effect for 3-D SR imaging. We recommend starting with a 10-m focal length. The mag lens is essentially a beam expander installed in the excitation path. If the excitation lasers are air-coupled (i.e., without optical fiber), it is trivial to install such an expander in any spot after the laser beams are collimated. If the excitation lasers are fiber-coupled, then look for extra slots to install two lenses (one concave and the other one convex). For example, many commercial illumination arms have slots for neutral-density filters. Find two lenses with the sum of their focal lengths equal to the distance between the two slots. Then, they can be inserted to function as a mag lens. Alternatively, a mount for the field diaphragm slider can be another place, if available. Building the mag lens in a removable cassette has the additional advantage of enabling one to focus the excitation lasers to achieve higher power, which may be necessary for SR imaging, simply by flipping the orientation of the mag lens.
In this report, we demonstrated flexible switching between three different imaging techniques using a modulated microscope. This set-up can be used for broader and more advanced applications. For example, the SR configuration can be used for single-particle tracking in live cells, on photo-switchable or photoactivatable fluorescent protein-tagged biomolecules of interest18,19. The smFRET configuration can be used to study molecular interactions in in vivo systems20. The emission splitter-based multi-channel detection can be combined with the SR configuration to perform two-color SR imaging or single-particle tracking simultaneously21.
This set-up can be further expanded to enable more modulated components. For example, another layer of filter turret and illumination compartment can be added, so that additional excitation/emission paths can be created for additional channels, such as one with an infrared (IR) laser for imaging samples labeled with IR dyes. In addition to allowing the added imaging channel, IR lasers can be used to correct the stage drift in SR imaging either during imaging acquisition or during the post analysis. For drift correction during imaging acquisition, if the z-drift correction system is not available from the microscope manufacturer, an alternative system with IR laser can be either homebuilt14 or acquired from third-party companies. For post-acquisition drift correction, an IR laser can be used for tracking fiducial markers.22
Single-molecule detection-based SR microscopy requires two sets of software, one for data acquisition and one for data analysis. For data acquisition, even a simple homebuilt software that takes images through the camera while controlling the lasers' ON/OFF behaviors can work to generate SR images, while it is possible to manually modulate the 405-nm laser power, e.g., by rotating a gradient neutral-density filter installed in front of the laser. However, this way of conducting the experiment is dependent on the experimenter's subjective judgment of the density of blinking-on spots. Thus, this way is not objective and may not be suitable to be used for the quantification of SR imaging data. The data acquisition code used here includes spot detection/a counting algorithm while the data acquisition is ongoing, enabling automatic modulation of the 405-nm laser power based on the density of blinking-on spots (Figure 6). Nowadays, some microscope manufacturers provide programmable imaging modules, so one can utilize these, or look for plugins from open sources like Micro-Manager. For the data analysis, it is possible to use commercially available analysis modules from microscope manufacturers or look for plugins from open sources like ImageJ.
In summary, the set-up presented here provides high versatility and easy switching between different imaging configurations at a reduced cost and space. This set-up is relatively easy to adopt by any research laboratory in biological sciences with a need for routine and diverse imaging experiments.
The authors have nothing to disclose.
J.F. acknowledges support from the Searle Scholars Program and the NIH Director's New Innovator Award. The authors acknowledge useful suggestions from Paul Selvin's lab (University of Illinois, Urbana-Champaign) for positioning the 3-D lens.
Nikon Ti-E microscope stand | Nikon | Ti-E | |
Objective lens | Nikon | 100X NA 1.49 CFI HP TIRF | |
Microscopy imaging software | Nikon | NIS-Elements Advanced Research/HC | HC includes "JOBS" module, the programmed acquisition module being used for SR imaging. |
The illumination arm | Nikon | Ti-TIRF-EM Motorized Illuminator Unit M | This arm has a slot for a magnification lens |
Analyze block | Nikon | Ti-A | This is installed in the filter turret. |
Z-drift correction system | Nikon | PFS | This system is composed by the stepmotor on the objective nosepiece, IR LED, and a detector. |
Optical table top | TMC | 783-655-02R | |
Optical table bases | TMC | 14-426-35 | |
647 nm laser | Cobolt | 90346 (0647-06-01-0120-100) | Modulated Laser Diode 647nm 120mW incl. laser head, CDRH control box, USB cable and PSU (Power Supply Unit) |
561 nm laser | Coherent | 1280721 | OBIS 561nm LS 150mW Laser System |
488 nm laser | Cobolt | 90308 (0488-06-01-0060-100) | Modulated Laser Diode 488nm 60mW incl. laser head, CDRH control box, USB cable and PSU (Power Supply Unit) |
405 nm laser | Crystalaser | DL405-025-O | 405 (+/-5)nm, 25mW, Circular , M2 <1.3, Low Noise, CW, TTL up to 20MHz. 2 BNC connectors for TTL & Analog adjust |
Heat sink | Cobolt | 11658 (HS-03) | Two units, Heat sink without fan HS-03, Heat sink for 647 nm and 488 nm lasers |
Heat sink | Coherent | 1193289 | Obis heat sink with fan, 165 x 50 x 50 mm for the 561 nm laser |
CAB-USB-miniUSB | Cobolt | 10908 | Two units, communication cable for 647 nm and 488 nm lasers |
aluminum for height adjustment | McMaster-Carr | 9146T35 | Multipurpose 6061 Aluminum, Rectangular Bar, 4MM X 40MM, 1' Long for raising 561 nm laser |
aluminum for height adjustment | McMaster-Carr | 8975K248 | Multipurpose 6061 Aluminum, 1-1/4" Thick X 3" Width X 1' Length for raising 405 nm laser |
BNC cable | L-com | CC58C-6 | RG58C Coaxial Cable, BNC Male / Male, 6.0 ft |
BNC adapter | L-com | BA1087 | Coaxial Adapter, BNC Bulkhead, Grounded |
SMA to BNC Adapter | HOD | SMA-870 | Cobolt MLD lasers have SMA interface, so this adapter is used for BNC connection. |
SMB to BNC Adapter | Fairview Microwave | FMC1638316-12 | SMB Plug to BNC Female Bulkhead Cable RG316 Coax in 12 Inch for Coherent Obis lasers |
Data Acquisition Card | National Instruments | PCI-6723 | 13-Bit, 32 Channels, 800 kS/s Analog Output Device for controlling lasers, DIC LED, and etc |
Barrier Filter Wheel controller | Sutter Instrument | Lambda 10-B | Optical Filter Changer |
Emission Splitter | Cairn | OptoSplit III | |
Dichroic beamsplitter | Chroma | T640LPXR-UF2 | Dichroic beamsplitter separating red emission from green emission in OptoSplit III |
Dichroic beamsplitter | Chroma | T565LPXR-UF2 | Dichroic beamsplitter separating green & red emission from blue emission in OptoSplit III |
Emission filter | Chroma | ET700/75M | Two units, Emission filter for red emission (like Alexa Fluor 647) in OptoSplit III as well as in the Barrier filter wheel |
Emission filter | Chroma | ET595/50M | Two units, Emission filter for yellow/green emission (like Cy3B) in OptoSplit III as well as in the Barrier filter wheel |
Emission filter | Chroma | ET525/50M | Two units, Emission filter for blue emission(like Alexa Fluor 488/GFP) in OptoSplit III as well as in the Barrier filter wheel |
Emission filter | Semrock | FF02-447/60-25 | Emission filter for violet emission (like DAPI/Alexa Fluor 405), installed in the Barrier filter wheel |
Dichroic beamsplitter | Chroma | zt405/488/561/647/752rpc-UF3 | Multiband dichroic beam splitter for 647, 561, 488, and 405 nm laser excitations inside of the microscope body |
DAPI Filter set | Chroma | 49000 | installed in the microscope body |
Nikon laser/TIRF filtercube | Chroma | 91032 | |
590 long pass filter | Chroma | T590LPXR-UF1 | for combining 647 nm laser and 561 nm laser |
525 long pass filter | Chroma | T525LPXR-UF1 | for combining already combined 647 nm and 561nm lasers with 488 nm laser |
470 long pass filter | Chroma | T470LPXR-UF1 | for combining already combined 647 nm, 561 nm and 488 nm lasers with 405 nm laser |
Laser clean-up filter (647) | Chroma | zet640/20x | for cleaning up other wavelengths from the 647 nm laser |
Laser clean up filter (488) | Semrock | LL01-488-25 | for cleaning up other wavelengths from the 488 nm laser |
LED light source | Excelitas | X-Cite120LED | used only for DAPI imaging |
Mirror mount | Newport | SU100-F3K | |
Optical posts | Newport | PS-2 | |
Clamping fork | Newport | PS-F | |
Power Meter | Newport | PMKIT | For measuring laser power |
Dichroic beamcombiner mount | Edmund Optics | 58-872 | C-Mount Kinematic Mount, for holding dichroic beamcombiners in the laser excitation assembly |
Retaining ring | Thorlabs | CMRR | used for dichroic beamcombiner mounts |
Fiber Adapter Plate | Thorlabs | SM1FC | FC/PC Fiber Adapter Plate with External SM1 (1.035"-40) Thread |
Z-axis translational mount | Thorlabs | SM1Z | Z-Axis Translation Mount, 30 mm Cage Compatible |
Achromatic Doublet lens | Thorlabs | AC050-008-A-ML | Ø5 mm, Mounted Achromatic Doublets, AR Coated: 400 – 700 nm |
Cage Plate | Thorlabs | CP1TM09 | 30 mm Cage Plate with M9 x 0.5 Internal Threads, 8-32 Tap |
Cage Assembly Rod | Thorlabs | ER4 | Cage Assembly Rod, 4" Long, Ø6 mm |
Cage Mounting Bracket | Thorlabs | CP02B | 30 mm Cage Mounting Bracket |
Single mode optical fiber | Thorlabs | P5-405BPM-FC-2 | Patch Cable, PM, FC/PC to FC/APC, 405 nm, Panda, 2 m |
Multi mode optical fiber | Thorlabs | M42L01 | Ø50 µm, 0.22 NA, FC/PC-FC/PC Fiber Patch Cable, 1 m |
Achromatic Doublet lens (mag lens) | Thorlabs | ACN127-025-A | ACN127-025-A – f=-25.0 mm, Ø1/2" Achromatic Doublet, ARC: 400-700 nm , a concave lens in the "mag lens" |
Achromatic Doublet lens (mag lens) | Thorlabs | AC127-050-A | f=50.0 mm, Ø1/2" Achromatic Doublet, ARC: 400-700 nm, a convex lens in the "mag lens" |
Retaining ring | Thorlabs | SM05PRR | SM05 Plastic Retaining Ring for Ø1/2" Lens Tubes and Mounts, for "mag lens" |
Nylon-tipped screw | Thorlabs | SS3MN6 | M3 x 0.5 Nylon-Tipped Setscrew, 6 mm Long, for holding "3D lens" |
3D lens | CVI Laser Optics | RCX-25.4-50.8-5000.0-C-415-700 | f=10 m, rectangular cylindrical lens |
EMCCD camera | Andor | iXon Ultra 888 | |
100 nm multichannel beads | Thermo | T7279, TetraSpeck microspheres | |
red dye | Thermo | Alexa Fluor 647 | |
yellow-green dye | GE Healthcare | Cy3 | |
green dye | GE Healthcare | Cy3B | |
blue dye | Thermo | Alexa Fluor 488 |