The differentiation of stem cells into islet cells provides an alternative solution to conventional diabetes treatment and disease modeling. We describe a detailed stem cell culture protocol that combines a commercial differentiation kit with a previously validated method to aid in producing insulin-secreting, stem cell-derived islets in a dish.
Method Article
Differentiation of Human Pluripotent Stem Cells into Insulin-Producing Islet Clusters
* These authors contributed equally
In This Article
Summary
Abstract
Differentiation of human pluripotent stem cells (hPSCs) into insulin-secreting beta cells provides material for investigating beta cell function and diabetes treatment. However, challenges remain in obtaining stem cell-derived beta cells that adequately mimic native human beta cells. Building upon previous studies, hPSC-derived islet cells have been generated to create a protocol with improved differentiation outcomes and consistency. The protocol described here utilizes a pancreatic progenitor kit during Stages 1-4, followed by a protocol modified from a paper previously published in 2014 (termed "R-protocol" hereafter) during Stages 5-7. Detailed procedures for using the pancreatic progenitor kit and 400 µm diameter microwell plates to generate pancreatic progenitor clusters, R-protocol for endocrine differentiation in a 96-well static suspension format, and in vitro characterization and functional evaluation of hPSC-derived islets, are included. The complete protocol takes 1 week for initial hPSC expansion followed by ~5 weeks to obtain insulin-producing hPSC islets. Personnel with basic stem cell culture techniques and training in biological assays can reproduce this protocol.
Introduction
Pancreatic beta cells secrete insulin responding to rises in blood glucose levels. Patients lacking sufficient insulin production due to the autoimmune destruction of beta cells in type 1 diabetes (T1D)1, or due to beta cell dysfunction in type 2 diabetes (T2D)2, are typically treated with the administration of exogenous insulin. Despite this life-saving therapy, it cannot precisely match the exquisite control of blood glucose as achieved by dynamic insulin secretion from bona fide beta cells. As such, patients often suffer the consequences of life-threatening hypoglycemic episodes and other complications resulting from chronic hyperglycemic excursions. Transplantation of human cadaveric islets successfully restores tight glycemic control in T1D patients but is limited by the availability of islet donors and difficulties in purifying healthy islets for transplantation3,4. This challenge can, in principle, be solved by using hPSCs as an alternative starting material.
Current strategies for generating insulin-secreting islets from hPSCs in vitro often aim to mimic the process of embryonic pancreas development in vivo5,6. This requires knowledge of the responsible signaling pathways and timed addition of corresponding soluble factors to mimic critical stages of the developing embryonic pancreas. The pancreatic program initiates with the commitment into definitive endoderm, which is marked by transcription factors forkhead box A2 (FOXA2) and sex-determining region Y-box 17 (SOX17)7. Successive differentiation of definitive endoderm involves the formation of a primitive gut tube, patterning into a posterior foregut that expresses the pancreatic and duodenal homeobox 1 (PDX1)7,8,9, and epithelial expansion into pancreatic progenitors that co-express PDX1 and NK6 homeobox 1 (NKX6.1)10,11.
Further commitment to endocrine islet cells is accompanied by the transient expression of pro-endocrine master regulator neurogenin-3 (NGN3)12 and stable induction of key transcription factors neuronal differentiation 1 (NEUROD1) and NK2 homeobox 2 (NKX2.2)13. The major hormone-expressing cells, such as insulin-producing beta cells, glucagon-producing alpha cells, somatostatin-producing delta cells, and pancreatic polypeptide-producing PPY cells, are subsequently programmed. With this knowledge, as well as discoveries from extensive, high-throughput drug screening studies, recent advancements have enabled the generation of hPSC-islets with cells resembling beta cells capable of insulin secretion14,15,16,17,18,19.
Step-wise protocols have been reported for generating glucose-responsive beta cells6,14,18,19. Built upon these studies, the present protocol involves the use of a pancreatic progenitor kit for generating PDX1+/NKX6.1+ pancreatic progenitor cells in a planar culture, followed by microwell plate aggregation into uniform-sized clusters and further differentiation toward insulin-secreting hPSC-islets with the R-protocol in a static 3D suspension culture. Quality control analyses, including flow cytometry, immunostaining, and functional assessment, are performed for rigorous characterization of the differentiating cells. This paper provides a detailed description of each step of the directed differentiation and outlines the in vitro characterization approaches.
Protocol
This protocol is based on work with hPSC lines, including H1, HUES4 PDXeG, and Mel1 INSGFP/W, in feeder-free conditions. A step-by-step procedure is detailed in this section, with supporting data from the differentiation of Mel1 INSGFP/W in the representative results section. We recommend that further optimization is needed when working with other hPSC lines that are not stated here. See the Table of Materials for details related to all reagents and solutions used in this protocol.
1. Preparation of differentiation media and solutions
NOTE: See Table 1 for all solutions to be prepared and Table 2 for the differentiation media.
- Prepare all media and reagents for cell culture in a sterile biosafety cabinet. Briefly warm up cell culture-related solutions and basal media to 37 °C in a bath before use.
NOTE: As described below, make fresh differentiation media daily by adding supplements and use them on the same day. Alternatively, the pancreatic progenitor kit provides the option to prepare a larger volume in advance that can be used over several days following the manufacturer's protocol. Both methods for media preparation prove to work well. Note that it is not recommended to leave media for an extended time in the water bath. When preparing media fresh each day, it is recommended to aliquot supplements to avoid repeated freeze-thaw cycles.
2. Differentiation of hPSCs into pancreatic progenitor cells
- Maintain undifferentiated hPSCs on Matrigel-coated vessels in mTeSR1 complete medium and perform medium changes daily. During maintenance culture, passage hPSCs every 3-4 days when cells reach ~70% confluency using the cell dissociation reagent following the manufacturer's protocol. To initiate differentiation, dissociate the cells into single cells and seed them onto 6-well or 12-well tissue culture-treated plates (with media volumes of 2 mL or 1 mL per well, respectively).
NOTE: See Table 1 for instructions related to the storage of endoderm basal medium and its aliquots. - Precoat culture wells with hESC-qualified Matrigel (diluted in ice-cold DMEM/F12 as recommended by the manufacturer's protocol) and place the plate in a humidified 37 °C, 5% CO2 incubator for 30 min.
- Move the Matrigel-coated plate to room temperature (use within 3 h).
- Aspirate the spent medium from the hPSC culture and rinse once with DPBS. Dissociate hPSC culture into single cells with cell dissociation enzyme at 37 °C for 3-5 min. Rinse the cells off by adding warm DMEM/F12 medium, transfer into a 15 mL or 50 mL conical tube, and spin at 300 × g for 5 min.
- Resuspend the cell pellet with stem cell complete medium plus 10 µM Y-27632 and perform live cell (trypan blue negative) counting with a hemocytometer or automated cell counter. Aspirate diluted Matrigel and immediately seed live cells at a density of 1.60-1.80 × 10⁵/cm2 on Matrigel-coated wells and incubate in a humidified 37 °C, 5% CO2 incubator for 24 h. Proceed to Stage 1.
NOTE: This will result in ~95% starting confluency for initiating differentiation. According to the manufacturer's protocol, a seeding density of 2.6 × 10⁵/cm2 is recommended. It is recommended to test various seeding densities to determine the optimal value for a cell line and to check cell viability. If the viability is below 80%, do not proceed with differentiation. Low cell viability can be a result of overdigestion or overtrituration during harvest or leaving cells for an extended time in DMEM/F12 medium prior to seeding. - On Stage 1 day 1, briefly warm endoderm basal medium to 37 °C in a bath and thaw Supplement MR and CJ. Prepare Stage 1A medium by adding Supplement MR and CJ to the endoderm basal medium. Mix well and use immediately.
- Aspirate the spent medium from wells, add Stage 1A medium and incubate in a humidified 37 °C, 5% CO2 incubator for 24 h.
NOTE: Washing steps are unnecessary. Remove any unattached cells from the culture by gently shaking the culture plate before the medium exchange. Avoid disrupting the monolayer by not touching the pipette tip to the well bottom during medium removal and through gentle medium addition. - On Stage 1 day 2, briefly warm the endoderm basal medium in a 37 °C bath and thaw Supplement CJ. Prepare Stage 1B medium by adding Supplement CJ to the endoderm basal medium. Mix well and use immediately.
- Aspirate the spent medium from the wells, add Stage 1B medium, and incubate in a humidified 37 °C, 5% CO2 incubator for 24 h.
- On Stage 1 day 3, repeat steps 2.8-2.9. Proceed to Stage 2.
- On Stage 2 day 1, warm pancreatic Stage 2-4 Basal Medium in a 37 °C bath and thaw Supplement 2A and 2B. Prepare Stage 2A medium by adding Supplement 2A and 2B to the pancreatic Stage 2-4 Basal Medium. Mix well and use immediately.
- Aspirate the spent medium from wells, add Stage 2A medium, and incubate in a humidified 37 °C, 5% CO2 incubator for 24 h.
- On Stage 2 day 2, warm pancreatic Stage 2-4 Basal Medium in a 37 °C bath and thaw Supplement 2B. Prepare Stage 2B medium by adding Supplement 2B to the pancreatic Stage 2-4 Basal Medium. Mix well and use immediately.
- Aspirate the spent medium from wells, add Stage 2B medium, and incubate in a humidified 37 °C, 5% CO2 incubator for 24 h.
- On Stage 2 day 3, repeat steps 2.13-2.14. Proceed to Stage 3.
- On Stage 3 day 1, warm pancreatic Stage 2-4 Basal Medium in a 37 °C bath and thaw Supplement 3. Prepare Stage 3 medium by adding Supplement 3 to the pancreatic Stage 2-4 Basal Medium. Mix well and use immediately.
- Aspirate the spent medium from wells, add Stage 3 medium, and incubate in a humidified 37 °C, 5% CO2 incubator for 24 h.
- On Stage 3 day 2 and day 3, repeat steps 2.16-2.17. Proceed to Stage 4.
- On Stage 4 day 1, warm pancreatic Stage 2-4 Basal Medium in a 37 °C bath and thaw Supplement 4. Prepare Stage 4 medium by adding Supplement 4 to the pancreatic Stage 2-4 Basal Medium. Mix well and use immediately.
- Aspirate the spent medium from wells, add Stage 4 medium, and incubate in a humidified 37 °C, 5% CO2 incubator for 24 h.
- On Stage 4 day 2 to day 4, repeat steps 2.19-2.20. Proceed to aggregation steps.
3. Aggregation into pancreatic progenitor clusters using 400 µm diameter microwell plates
- On Stage 4 day 5, pretreat the microwells (e.g., 24-well plate format) with 500 µL of Anti-Adherence Rinsing Solution per well.
- Prepare a balance plate and centrifuge the microwell plate at 1,300 × g for 5 min.
NOTE: Check the plate under a microscope to ensure no bubbles are left in the microwells. Centrifuge again for another 5 min if bubbles remain trapped in any microwells. - Aspirate the Anti-Adherence Rinsing Solution from the wells and rinse once with 1 mL of DPBS. Aspirate the DPBS from the wells and add 1 mL of Aggregation medium to each well.
- Remove the spent medium from the pancreatic progenitor cultures and wash once with DPBS. Dissociate the cultures into single cells with dissociation reagent at 37 °C for 10-12 min. Rinse the cells off with warm DMEM/F12, transfer them into a tube, and spin at 300 × g for 5 min.
- Resuspend the cell pellet in the Aggregation medium and perform live cell counting. Seed 2.4-3.6 million total cells per well (i.e., 2,000-3,000 cells per microwell) and add Aggregation medium to each well to achieve a final volume of 2 mL per well.
- Gently pipette the cells up and down several times with a P1000 pipette tip to ensure an even distribution of cells throughout the well. Do not introduce bubbles into microwells. Centrifuge the microwell plate at 300 × g for 5 min to capture the cells in the microwells. Incubate the microwell plate in a humidified 37 °C, 5% CO2 incubator for 24 h aggregation and proceed to Stages 5-7 differentiation.
NOTE: Be careful not to disturb the plate during the time of aggregation. Up to 48 h of incubation time may be needed for optimal aggregate formation.
4. Differentiation of kit-derived pancreatic progenitor clusters into hPSC-islets
- On Stage 5 day 1, warm Stage 5-7 basal medium in a 37 °C bath and thaw supplements (see Table 1 and Table 2). Prepare Stage 5 medium by adding supplements (to final working concentrations) to the Stage 5-7 basal medium. Mix well and use immediately.
- After aggregate formation, gently pipette the aggregates up and down several times with a P1000 pipette tip to float any non-aggregated cells. Allow the aggregates to settle down by gravity (wait for ~1 min). Gently remove the spent medium (containing the floating non-aggregated cells) from the well as much as possible while avoiding aspirating aggregates.
- Dispense fresh Stage 5 medium vigorously onto the surface of the microwell plate to dislodge aggregates from the microwells. Transfer aggregates into ultralow attachment (ULA) 6-wells. Rinse once with Stage 5 medium to completely retrieve aggregates from the microwells.
- Collect all aggregates in the ULA 6-wells, resuspend aggregates in Stage 5 medium, and adjust the density to 20 clusters per 100 µL (e.g., ~1,200 clusters are expected to be retrieved from each well. Resuspend 1,200 clusters in 6 mL of Stage 5 medium). Use a multichannel pipette to dispense 50 µL of Stage 5 medium into each well of a ULA flat bottom 96-well plate. Fill the corner and edge wells with 200 µL of DPBS.
NOTE: Avoid using the edge wells for culturing aggregates since they are prone to more evaporation; otherwise, use a 96-well plate that is designed to minimize evaporation along the edges (e.g., 96-well plates with built-in moats) or place the culture plate in a high-humidity microclimate cell culture incubator. - Add 100 µL of the cluster resuspension into each well of the ULA flat bottom 96-well plate, resulting in a total of 150 µL culture medium containing an average of 20 clusters per well.
NOTE: Gently mix the cluster resuspension every time before dispensing into 96-wells. - Place culture plates on a level surface in a humidified 37 °C, 5% CO2 incubator for 24 h.
- On Stage 5 day 2, prepare Stage 5 medium following step 4.1.
- Use a multichannel pipette to remove ~90 µL of the spent medium from each well, and refresh with 100 µL of Stage 5 medium.
- On Stage 5 day 3, repeat steps 4.7-4.8. Proceed to Stage 6.
- On Stage 6 day 1, warm Stage 5-7 basal medium in a 37 °C bath and thaw supplements (see Table 1 and Table 2). Prepare Stage 6 medium by adding supplements (to final working concentrations) to the Stage 5-7 basal medium. Mix well and use immediately.
- Use a multichannel pipette to remove ~90 µL of the spent medium and refresh with 100 µL of Stage 6 medium per well.
- On Stage 6 day 2 to day 8, repeat steps 4.10-4.11. Proceed to Stage 7.
- On Stage 7 day 1, warm Stage 5-7 basal medium in a 37 °C bath and thaw supplements (see Table 1 and Table 2). Prepare Stage 7 medium by adding supplements (to final working concentrations) to the Stage 5-7 basal medium. Mix well and use immediately.
- Use a multichannel pipette to remove ~90 µL of the spent medium and refresh with 100 µL of Stage 7 medium per well.
- On Stage 7 day 2 to day 12, repeat steps 4.13-4.14. Proceed to in vitro characterization.
5. Flow cytometric analysis
- Remove culture media and wash once with DPBS. Dissociate the cultures (planar progenitor cells or differentiating clusters) into single cells with dissociation reagent by incubating at 37 °C for 10-12 min. Rinse with FACS buffer and spin at 300 × g for 5 min.
- Resuspend the cell pellet in FACS buffer and perform cell counting. Spin cells at 300 × g for 5 min. Resuspend single cells in 500 µL of Fix/Perm buffer for 10 min at room temperature.
NOTE: Bring the Fix/Perm buffer to room temperature before use. The Fix/Perm buffer contains paraformaldehyde (PFA). Carefully handle PFA in a fume hood and dispose according to institutional guidelines. - Spin at 500 × g for 3 min, wash twice with 500 µL of 1x Perm/Wash buffer, and resuspend in 300 µL of 1x Perm/Wash buffer. Transfer 100 µL of single-cell resuspension (each containing 2.5-3 × 10⁵ cells) to three microfuge tubes for unstained control, isotype control, and antibody staining (see Table of Materials for sample antibody and dilution information). Incubate for 45 min at room temperature and cover with foil.
- Spin at 500 × g for 3 min. Wash twice with 500 µL of 1x Perm/Wash buffer. Resuspend the samples in 100 µL of FACS buffer and analyze the stained cells (see Table of Materials for intracellular staining of markers at specific stages) with a flow cytometer and software (e.g., FlowJo).
NOTE: If the samples are not assayed immediately, store them at 4°C protected from light. For the gating strategy, the flow data are first gated by scatter properties (FSC-A and SSC-A) to remove small cellular debris followed by FSC-A and FSC-width properties to identify singlets. Positive and negative gating is determined by stem cell controls and/or unstained, isotype controls.
6. Whole mount immunostaining
- Collect clusters in a microfuge tube. Settle clusters by gravity. Aspirate the spent medium and rinse once with 1 mL of PBS (with calcium and magnesium). Fix the clusters with 1 mL of 4% PFA at 4°C overnight.
- Rinse once with PBST and permeabilize 20-30 clusters with 500 µL of 0.3% TritonX-100 in a microfuge tube at ambient temperature for at least 6 h on a tilt shaker.
NOTE: A longer permeabilization time (up to 24 h) is needed for large clusters. - Incubate the clusters in 100 µL of blocking buffer at ambient temperature for 1 h on a tilt shaker. Remove the blocking buffer and incubate the clusters with 100 µL of primary antibodies diluted in antibody dilution buffer at ambient temperature overnight on a tilt shaker.
NOTE: If the background is strong during imaging, incubate with primary antibodies at 4 °C. - Wash 3 x 30 min with 500 µL of PBST thoroughly on a tilt shaker (tilt angle set at 8, speed set at 20).
- Incubate the clusters with 100 µL of secondary antibodies in antibody dilution buffer at ambient temperature overnight on a tilt shaker. Cover the tubes with foil.
NOTE: If the background is strong during imaging, incubate with secondary antibodies at 4 °C. - Rinse once with 500 µL of PBST. Add 100 µL of 4',6-diamidino-2-phenylindole (DAPI) solution (10 µg/mL in PBST) and stain at ambient temperature for 10-15 min. Cover with foil and protect from light.
- Wash 3 x 30 min with 500 µL of PBST thoroughly on a tilt shaker. Cover tubes with foil during the washing step.
- Attach the clusters onto imaging chamber slides (see the Table of Materials) precoated with tissue adhesive according to the manufacturer's protocol and published protocols20,21.
- Mount with tissue clearing medium (80% glycerol in PBS solution) and cover with glass coverslips. Protect from light until confocal imaging.
NOTE: If samples are not imaged immediately, store them at 4 °C protected from light.
7. Static GSIS assay
- Warm low-glucose Kreb's Ringer bicarbonate (3.3G KRB) buffer, high-glucose (16.7G) KRB buffer, and 30 mM KCl KRB buffer in a 37 °C bath.
- Hand-pick size-matched clusters and rinse with 2 mL of warm 3.3G KRB buffer. Transfer the clusters into non-tissue culture-treated 6-well plate and equilibrate in 2 mL o warm 3.3G KRB buffer for 1 h in a humidified 37 °C, 5% CO2 incubator.
- After equilibration, fill the assay chamber (see the Table of Materials) with 100 µL of warm 3.3G KRB buffer. Hand-pick five clusters and transfer them to the center of the assay chamber. Incubate for 30 min in a humidified 37 °C, 5% CO2 incubator.
NOTE: Use 10 µL pipette tips for transferring clusters with minimal medium volume. - Carefully collect ~100 µL of the supernatant and store it at -30 °C until measurement of the basal insulin secretion (see step 7.9). Do not dry or lose any clusters in this step. Immediately add 100 µL of warm 16.7G KRB buffer into the assay chamber and incubate the same clusters for 30 min in a humidified 37 °C, 5% CO2 incubator.
- Carefully collect ~100 µL of the supernatant and store it at -30 °C until measurement of the glucose-stimulated insulin secretion (see step 7.9). Immediately add 100 µL of warm 30 mM KCl KRB buffer into the assay chamber and incubate the same clusters for 30 min in a humidified 37 °C, 5% CO2 incubator.
- Carefully collect ~100 µL of the supernatant and store at -30 °C until measurement of the KCl-stimulated insulin secretion (see step 7.9). Immediately add 100 µL of RIPA lysis buffer into the assay chamber and transfer the lysis buffer containing all five clusters into a microfuge tube.
- Optional) Break the clusters manually by vigorous trituration with a P200 pipette tip. Vortex for 30 s and incubate on ice for 30 min followed by another 30 s of vortexing.
NOTE: Ensure complete lysis by vortexing and sufficient time of incubation on ice. - Spin at 8,000 × g for 1 min. Collect the supernatant and store at -30 °C until measurement of total insulin content (see step 7.9).
- Measure human insulin in the supernatant samples using a Human Insulin ELISA Kit according to the manufacturer's protocol and published protocols20,22.
NOTE: Avoid repeated freeze and thaw of supernatant samples. Samples with more than three freeze-and-thaw cycles should not be assayed.
Results
We developed a hybrid strategy to differentiate stem cells into insulin-secreting hPSC-islets in seven steps, which utilizes a pancreatic progenitor kit for the first four stages in planar culture, followed by a modified protocol built upon a previously reported method6 in a static suspension culture for the last three stages (Figure 1). With this protocol, ensuring a near confluency (90%-100%) culture at 24 h after cell seeding (Stage 0) is critical for initiating an efficient differentiation for most hPSC lines (Figure 2A). Testing different seeding densities is strongly recommended to determine the optimal condition for a particular cell line. During Stage 1 culture, the media will likely appear cloudy due to floating dead cells, which are commonly observed at this stage. This does not compromise the differentiation efficiency of the kit as long as the attached cells fully cover the vessel surface. During Stages 2-4, as cells proliferate and cell death diminishes, the monolayers become more compacted and the spent media are not as cloudy as during Stage 1 (Figure 2A). As demonstrated with the insulin reporter Mel1 INSGFP/W hESCs, at least 95% FOXA2+/SOX17+ definitive endoderm cells at the end of Stage 1 and 80% PDX1+/NKX6.1+ pancreatic progenitor cells at the end of Stage 4 can be achieved routinely (Figure 2B-E). The transition of pancreatic progenitor cells from planar culture to suspension culture has been shown to promote subsequent endocrine cell induction23,24. In this updated protocol, we use microwell plates and allow for 24 h of cell aggregation. This generates thousands of pancreatic progenitor clusters with uniform size and morphology at a time (Figure 3A, B), and the average aggregation efficiency (by calculating the percentage of cells that are incorporated into aggregates) is 74.1% ± 4.4% (Figure 3C). Importantly, expression of PDX1 and NKX6.1 is maintained at high levels in these clusters post aggregation (Figure 3D, E), suggesting an efficient production of pancreatic progenitors in vitro with the differentiation kit and microwell plate.
We next use R-protocol (a method modified from Rezania et al.6) for the last 3-stage differentiation in a static suspension culture system using ULA flat bottom 96-well plates to further differentiate these kit-derived pancreatic progenitors toward hPSC-islets (Figure 1). Insulin-expressing cells are gradually induced within endocrine clusters, as indicated by the increased INS-GFP signals in living cultures over time (Figure 4A, B). Quantification of cluster size reveals that the average diameter of Stage 5 clusters is 150 µm and by Stage 7, the average diameter increases to 220 µm (Figure 4C). The clusters predominantly maintain their smooth, spherical appearance as they grow between Stage 5 and Stage 7, suggesting that the static culture method limits cluster clumping compared to orbital shaker-based suspension cultures (which typically generate some oversized clusters)25. Maintenance of compacted clusters with smooth spherical morphology is an indicator of good viability of the differentiating cells, which is important for a successful differentiation toward functional hPSC-islets in the end.
Characterization of cell composition shows that Stage 7 hPSC-islets generated by the hybrid protocol are primarily endocrine and comprised of four major islet cell types, including insulin-positive beta cells, glucagon-positive alpha cells, somatostatin-positive delta cells, and pancreatic polypeptide-positive PPY cells, while enterochromaffin cells (derived from an off-target lineage26) are also present (Figure 5A-C). Notably, this hybrid protocol generates largely monohormonal islet cells (~50% CPEP+/GCG-/SST- cells, ~17% GCG+/CPEP- cells, and ~12% SST+/CPEP- cells) and only a minority of bi-hormonal cells (CPEP+/GCG+ or CPEP+/SST+) in Stage 7 cultures (Figure 5B-D). Examination of several key transcription factors and mature beta cell markers in Stage 7 hPSC-islets reveals that differentiating beta cells express PDX1, NKX6.1, NEUROD1, MAFA, and glucose transporter GLUT1 (Figure 6A). Furthermore, ~60% INS+/PDX1+ cells (Figure 6B) and 50% CPEP+/NKX6.1+ cells (Figure 6C) are induced in the Stage 7 cultures, suggesting an efficient generation of functional beta cells using the hybrid strategy as presented here. Indeed, in vitro static glucose-stimulated insulin secretion (GSIS) assays demonstrate that Stage 7 hPSC-islets can secrete high levels of insulin responding to both high glucose and direct depolarization (Figure 6D). While this function is encouraging, the in vitro glucose responsiveness from hPSC-islets is still not equivalent to that of cadaveric islets in terms of the magnitude of insulin secretion (Figure 6D) and the total insulin content of hPSC-islets is approximately half the amount of that in cadaveric islets (Figure 6E). Continued optimization is required to achieve hPSC-islets with more mature beta-cell phenotypes.
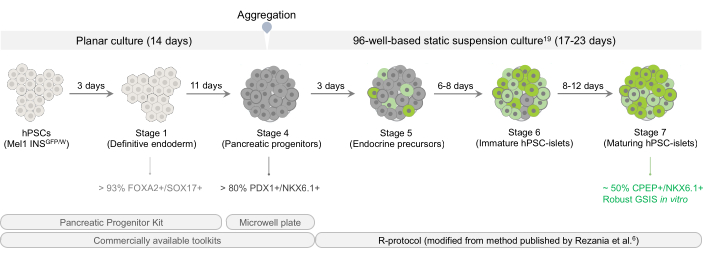
Figure 1: Overview of differentiation scheme for generating functional hPSC-islets in vitro. The workflow diagram provides an overview of the seven-step procedure involved in the differentiation of hPSCs into pancreatic progenitor cells in a planar culture using the pancreatic progenitor kit, aggregation into pancreatic progenitor clusters using microwell plates, and transition toward hPSC-islets in a static suspension culture. An insulin reporter hESC line, Mel1 INSGFP/W, is used throughout this study as an example to demonstrate the efficacy of this hybrid method. Abbreviations: hPSCs = human pluripotent stem cells; GSIS = glucose-stimulated insulin secretion. Please click here to view a larger version of this figure.
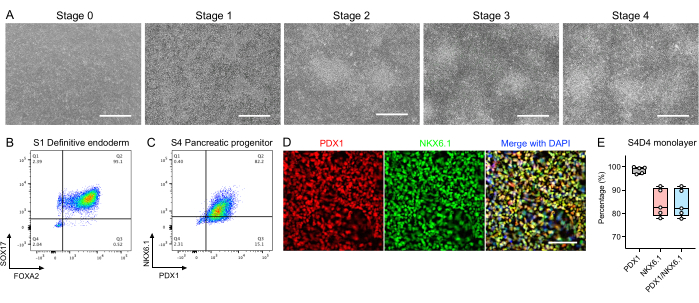
Figure 2: Directed differentiation of hPSCs into pancreatic progenitor cells using the pancreatic progenitor kit. (A) Representative phase contrast images showing cell morphology at the indicated stages. Scale bars = 750 µm. (B, C) Representative flow cytometry plots for key markers of (B) Stage 1 definitive endoderm cells (FOXA2+/SOX17+) and (C) Stage 4 pancreatic progenitor cells (PDX1+/NKX6.1+). (D) Representative immunostaining images of pancreatic progenitor cells for PDX1 (red) and NKX6.1 (green). Nuclei were stained with DAPI (blue). Scale bar = 200 µm. (E) Flow cytometric quantification of PDX1+/NKX6.1+ cells in Stage 4 Day 4 pancreatic progenitor monolayer cells (n = 5 biological replicates). Abbreviations: hPSCs = human pluripotent stem cells; DAPI = 4',6-diamidino-2-phenylindole. Please click here to view a larger version of this figure.
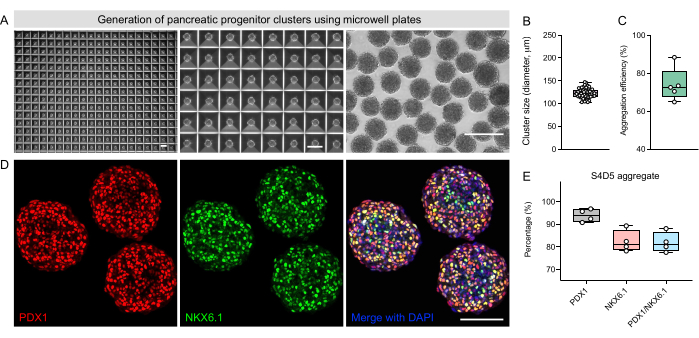
Figure 3: Aggregation into uniform-sized pancreatic progenitor clusters using 400 µm diameter microwell plates. (A) Representative phase contrast images at the end of Stage 4 showing cluster morphology in the microwell and after retrieval from the microwell. Scale bars = 300 µm. (B) Quantification of cluster diameter at the end of Stage 4 (n = 60 clusters from 3 biological replicates). (C) Quantification of aggregation efficiency at the end of Stage 4 (n = 5 biological replicates). (D) Representative immunostaining images of pancreatic progenitor clusters for PDX1 (red) and NKX6.1 (green). Nuclei were stained with DAPI (blue). Scale bar = 100 µm. (E) Flow cytometric quantification of PDX1+/NKX6.1+ cells in Stage 4 Day 5 pancreatic progenitor aggregates (n = 4 biological replicates). Abbreviation: DAPI = 4',6-diamidino-2-phenylindole. Please click here to view a larger version of this figure.
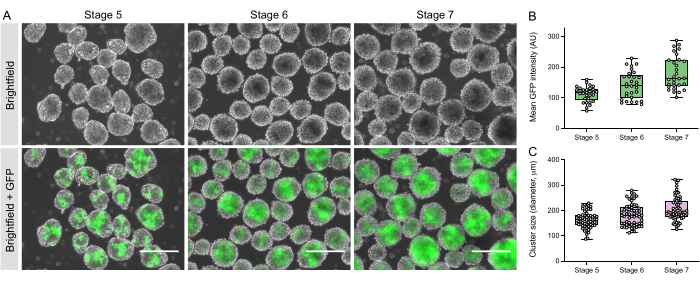
Figure 4: Differentiation of pancreatic progenitors into hPSC-islets in a static suspension culture system. (A) Representative phase contrast images (top panel) and fluorescent images (bottom panel) showing cluster morphology and insulin expression pattern at indicated stages. Scale bars = 300 µm. (B) Quantification of mean INS-GFP fluorescent intensities per cluster at indicated stages (n = 30 clusters from two biological replicates). (C) Quantification of cluster diameter at indicated stages (n = 60 clusters from three biological replicates). Abbreviations: hPSC = human pluripotent stem cell; INS = insulin; GFP = green fluorescent protein. Please click here to view a larger version of this figure.
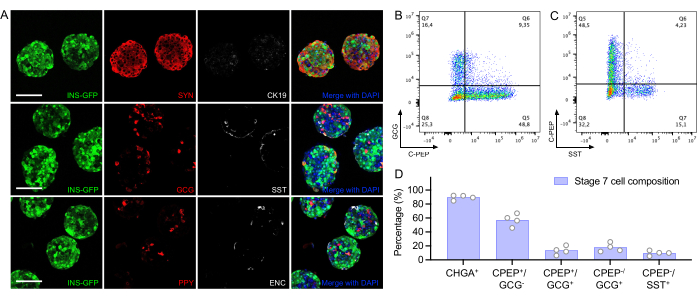
Figure 5: Characterization of cell composition in Stage 7 hPSC-islets. (A) Representative immunostaining images of Stage 7 hPSC-islets showing different cell types (SYN, pan-endocrine marker; CK19, ductal marker; INS-GFP, insulin is indicated by reporter GFP signals; GCG; SST; PPY; ENC was stained by SLC18A1 antibody). Nuclei were stained with DAPI (blue). Scale bars = 100 µm. (B,C) Representative flow cytometry plots of the (B) percentage of CPEP+ and GCG+ cells in Stage 7 hPSC-islets and (C) the percentage of CPEP+ and SST+ cells in Stage 7 hPSC-islets. (D) Flow cytometry quantification of indicated cell markers in Stage 7 hPSC-islets (n = 4 biological replicates). Abbreviations: hPSC = human pluripotent stem cell; INS= insulin; GFP = green fluorescent protein; SYN = synaptophysin; GCG = glucagon; SST = somatostatin; PPY = pancreatic polypeptide; ENC = enterochromaffin; CPEP = C-peptide; DAPI = 4',6-diamidino-2-phenylindole. Please click here to view a larger version of this figure.
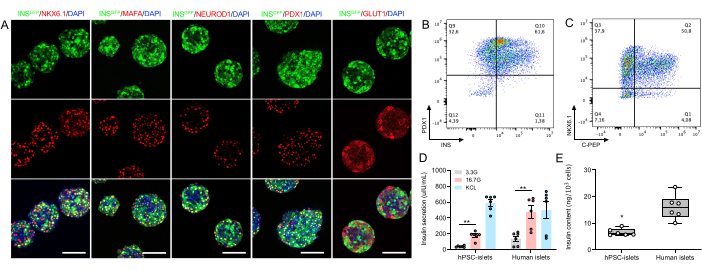
Figure 6: In vitro characterization and functional assessment of Stage 7 hPSC-islets. (A) Representative immunostaining images of Stage 7 hPSC-islets showing co-expression of insulin (indicated by reporter INS-GFP signals) with several key beta cell markers, such as NKX6.1, MAFA, NEUROD1, PDX1, and glucose transporter GLUT1. Nuclei were stained with DAPI (blue). Scale bars = 100 µm. (B,C) Representative flow cytometry plots of the (B) percentage of INS+/PDX1+ cells and the (C) percentage of CPEP+/NKX6.1+ cells. (D) Static GSIS assays showing insulin release from Stage 7 hPSC-islets (n = 6 including 3 biological and 2 technical replicates) and human islets (n = 6 including 3 biological and 2 technical replicates) in response to high glucose (16.7G, 16.7 mM glucose) and 30 mM KCl depolarization. Data are presented as mean ± SEM. An unpaired two-tailed t-test (**p < 0.01) was used to compare between two indicated groups. (E) Total insulin content of Stage 7 hPSC-islets (n = 6 including 3 biological and 2 technical replicates) and human islets (n = 6 including 3 biological and 2 technical replicates). An unpaired two-tailed t-test (*p < 0.05) was used to compare the two groups. Abbreviations: hPSC = human pluripotent stem cell; INS = insulin; GFP = green fluorescent protein; DAPI = 4',6-diamidino-2-phenylindole. Please click here to view a larger version of this figure.
Table 1: Formulation of all solutions and media used in this protocol. Please click here to download this Table.
Table 2: Formulation of Stages 1-7 differentiation media. The table provides the recipe to prepare the Stages 1-7 differentiation media. Please click here to download this Table.
Discussion
This paper describes a seven-stage hybrid protocol that allows for the generation of hPSC islets capable of secreting insulin upon glucose challenge within 40 days of culture in vitro. Among these multiple steps, efficient induction of definitive endoderm is believed to set an important starting point for the final differentiation outcomes18,27,28. In the manufacturer's protocol, a seeding density at 2.6 × 10⁵/cm2 is recommended to initiate differentiation, and cells are exposed to Stage 1 media for 2 days. To ensure that cells reach near confluency on Day 1 (90%-100%), we highly recommend testing seeding densities when working on a new hPSC line as the optimal seeding density may vary. For example, with all three hPSC lines tested in our hands, 1.6-1.80 × 10⁵/cm2, rather than 2.60 × 10⁵/cm2, was found to be an optimal seeding density. Extending the culture duration of Stage 1 from 2 days to 3 days with one additional day in Stage 1B medium increases the purity of FOXA2+/SOX17+ cells from 80% to > 93% (data not shown). If the proportion of FOXA2+/SOX17+ cells is lower than 70% at the end of Stage 1, induction of PDX1+ cells and PDX1+/NKX6.1+ cells will likely be compromised.
It is important to note that some cell death may be observed during the entire Stage 1 culture while the attached cells are required to cover 100% of the surface area. During Stages 2-4, the decrease in cell death concurrent with cell proliferation results in compacted and multilayered cells, which has been reported to be critical for the efficient induction of pancreatic progenitor markers PDX1 and NKX6.1 and their nuclear localization29,30. On the last day of Stage 4, the cells are dissociated and aggregated into clusters using the AggreWell 400 µm diameter microwell plates. Compared to other approaches such as suspended aggregation, manual aggregation, or using U-bottom 96-well plates, AggreWell aggregation generates thousands of spherical uniform-sized clusters, illustrating the robustness of this method.
For endocrine induction during Stages 5-7 in a static 3D culture, we transfer an average number of ~20 kit-derived pancreatic progenitor clusters into each well of ULA flat bottom 96-well plates. This method greatly reduces the formation of oversized clusters and improves cell viability, possibly by limiting cluster fusion and/or lowering shear stress-mediated cell loss during orbital shaker culture. To remove floating dead cells in spent media while reducing the risk of losing clusters during media change, we recommend refreshing about two-thirds of the total medium volume. We note that this partial medium change does not hamper endocrine differentiation and instead may offer a gentle transition when switching between different stages. Nevertheless, some cell death may still be observed during Stage 5 and early Stage 6 with this hybrid protocol when transitioning from planar culture to static suspension culture. Reporter hPSC lines (for instance, Mel1 INSGFP/W hESCs) are useful for monitoring late-stage differentiation in living cultures. Running flow cytometry will help examine NKX6.1+/NEUROD1+ at the end of Stage 5, INS+/NKX6.1+ at the end of Stage 6, and CPEP+/NKX6.1+ at the end of Stage 7. Efficient induction of CPEP+ populations co-expressed with NKX6.1 is critical for achieving glucose responsiveness in beta cells31,32. In this regard, this protocol consistently generates >50% CPEP+/NKX6.1+ cells in the resulting Stage 7 hPSC-islets that can secrete insulin in response to a high glucose challenge in vitro.
Although the present protocol has demonstrated an efficient generation of insulin-producing hPSC islets, there are limitations to this method. Differentiation efficiencies at the end of Stage 4 from various hPSC lines, particularly iPSCs, with this pancreatic progenitor kit could still be variable (data not shown). Optimization should be performed on a case-by-case basis. This method for the last three stages of differentiation relies on the use of static suspension culture in 96-well plates, which is labor-intensive and not scalable, thus limiting its use to research only. While it is encouraging to obtain insulin-secreting capability, the in vitro glucose responsiveness and insulin content of hPSC islets are significantly lower than those of cadaveric islets. Future efforts are still required for continued protocol optimization. Despite these limitations, we believe that the protocol presented here provides hPSC-derived materials suitable for screening differentiation-inducing factors and regulators of islet hormone secretion, as well as for modeling islet cell dysfunction.
Disclosures
Timothy J. Kieffer was an employee of ViaCyte during the preparation of this manuscript. The other authors declare no competing interests.
Acknowledgements
We gratefully acknowledge the support from STEMCELL Technologies, Michael Smith Health Research BC, Stem Cell Network, JDRF, and the Canadian Institutes of Health Research. Jia Zhao and Shenghui Liang are recipients of the Michael Smith Health Research BC Trainee Award. Mitchell J.S. Braam is a recipient of the Mitacs Accelerate Fellowship. Diepiriye G. Iworima is a recipient of the Alexander Graham Bell Canada Graduate Scholarship and the CFUW 1989 Ecole Polytechnique Commemorative Award. We sincerely thank Dr. Edouard G. Stanley from MCRI and Monash University for sharing the Mel1 INS GFP/W line and the Alberta Diabetes Institute Islet Core for isolating and distributing human islets. We also acknowledge the support from the Life Sciences Institute Imaging and Flow Cytometry facilities at the University of British Columbia. Figure 1 was created with BioRender.com.
Materials
| Name | Company | Catalog Number | Comments |
|---|---|---|---|
| 3,3’,5-Triiodo-L-thyronine (T3) | Sigma | T6397 | Thyroid hormone |
| 4% PFA solution | Santa Cruz Biotechnology | sc-281692 | Should be handled in fume hood |
| 96-Well, Ultralow Attachment, flat bottom | Corning Costar (VWR) | CLS3474 | Flat bottom; for static suspension culture in the last three stages |
| Accutase | STEMCELL Technologies | 07920 | Dissociation reagent for Stage 4 cells |
| Aggrewell400 plates | STEMCELL Technologies | 34415 | 400 µm diameter microwell plates |
| Aggrewell800 plates | STEMCELL Technologies | 34815 | 800 µm diameter microwell plates |
| Alexa Fluor 488 Goat anti-Human FOXA2 (goat IgG) | R&D Systems | IC2400G | 1:100 in flow cytometry; used for assaying Stage 1 cells |
| Alexa Fluor 488 Goat IgG Isotype Control | R&D Systems | IC108G | 1:100 in flow cytometry |
| Alexa Fluor 488 Mouse anti-Human SST (mouse IgG2B) | BD Sciences | 566032 | 1:250 in flow cytometry; used for assaying Stage 7 cells |
| Alexa Fluor 488 Mouse IgG2B Isotype Control | R&D Systems | IC0041G | 1:500 in flow cytometry |
| Alexa Fluor 647 Mouse anti-Human C-peptide (mouse IgG1κ) | BD Pharmingen | 565831 | 1:2,000 in flow cytometry; used for assaying Stage 7 cells |
| Alexa Fluor 647 Mouse anti-Human INS (mouse IgG1κ) | BD Sciences | 565689 | 1:2,000 in flow cytometry |
| Alexa Fluor 647 Mouse anti-Human NKX6.1 (mouse IgG1κ) | BD Sciences | 563338 | 1:33 in flow cytometry; used for assaying Stage 4 cells |
| Alexa Fluor 647 Mouse anti-Human SOX17 (mouse IgG1κ) | BD Sciences | 562594 | 1:50 in flow cytometry; used for assaying Stage 1 cells |
| Alexa Fluor 647 Mouse IgG1κ Isotype Control | BD Sciences | 557714 | 1:50 in flow cytometry |
| ALK5i II | Cayman Chemicals | 14794 | TGF-beta signaling inhibitor |
| Anti-Adherence Rinsing Solution | STEMCELL Technologies | 7010 | Microwell Rinsing Solution |
| Assay chamber | Cellvis | D35-10-1-N | For static GSIS and confocal imaging purposes |
| Bovine serum albumin (BSA) | Thermo Fisher Scientific | BP1600-100 | For immunostaining procedure |
| CK19 antibody | DAKO | M0888 | 1:50 in whole mount immunofluorescence |
| D-glucose | Sigma | G8769 | Medium supplement |
| DAPI | Sigma | D9542 | For nuclear counterstaining |
| DMEM/F12, HEPES | Thermo Fisher Scientific | 11330032 | Matrix diluting solution |
| Donkey anti-goat Alexa Fluor 555 | Life technologies | A21432 | 1:500 in whole mount immunofluorescence |
| Donkey anti-goat Alexa Fluor 647 | Life technologies | A21447 | 1:500 in whole mount immunofluorescence |
| Donkey anti-mouse Alexa Fluor 555 | Life technologies | A31570 | 1:500 in whole mount immunofluorescence |
| Donkey anti-mouse Alexa Fluor 647 | Life technologies | A31571 | 1:500 in whole mount immunofluorescence |
| Donkey anti-rabbit Alexa Fluor 555 | Life technologies | A31572 | 1:500 in whole mount immunofluorescence |
| Donkey anti-rabbit Alexa Fluor 647 | Life technologies | A31573 | 1:500 in whole mount immunofluorescence |
| Donkey anti-sheep Alexa Fluor 647 | Life technologies | A21448 | 1:500 in whole mount immunofluorescence |
| DPBS | Sigma | D8537 | Without Ca2+ and Mg2+ |
| ELISA, insulin, human | Alpco | 80-INSHU-E01.1 | For human insulin measurement |
| Fatty acid-free BSA | Proliant | 68700 | Medium supplement |
| Fixation and Permeabilization Solution Kit | BD Sciences | 554714 | Fix/Perm and 10x Perm/Wash solutions included |
| Gentle Cell Dissociation Reagent | STEMCELL Technologies | 7174 | For clump passaging hPSCs during maintenance culture |
| Glucagon antibody | Sigma | G2654 | 1:400 in whole mount immunofluorescence |
| GLUT1 antibody | Thermo Fisher Scientific | PA1-37782 | 1:200 in whole mount immunofluorescence |
| GlutaMAX-I (100x) | Gibco | 35050061 | L-glutamine supplement |
| Glycerol | Thermo Fisher Scientific | G33-4 | For tissue clearing and mounting |
| GSi XX | Sigma Millipore | 565789 | Notch inhibitor |
| Heparin | Sigma | H3149 | Medium supplement |
| ITS-X (100x) | Thermo Fisher Scientific | 51500056 | Insulin-Transferrin-Selenium-Ethanolamine; medium supplement |
| LDN193189 | STEMCELL Technologies | 72147 | BMP antagonist |
| MAFA antibody | Abcam | ab26405 | 1:200 in whole mount immunofluorescence |
| Matrigel, hESC-qualified | Thermo Fisher Scientific | 08-774-552 | Extracellular matrix for vessel surface coating |
| MCDB131 medium | Life technologies | 10372019 | Base medium |
| mTeSR1 Complete Kit | STEMCELL Technologies | 85850 | stem cell medium and 5x supplement included |
| N-Cys (N-acetyl cysteine) | Sigma | A9165 | Antioxidant |
| NaHCO3 | Sigma | S6297 | Medium supplement |
| NEUROD1 antibody | R&D Systems | AF2746 | 1:20 in whole mount immunofluorescence |
| NKX6.1 antibody | DSHB | F55A12-c | 1:50 in whole mount immunofluorescence |
| Pancreatic polypeptide antibody | R&D Systems | AF6297 | 1:200 in whole mount immunofluorescence |
| PBS | Sigma | D8662 | With Ca2+ and Mg2+ |
| PDX1 antibody | Abcam | ab47267 | 1:200 in whole mount immunofluorescence |
| PE Mouse anti-Human GCG (mouse IgG1κ) | BD Sciences | 565860 | 1:2,000 in flow cytometry; used for assaying Stage 7 cells |
| PE Mouse anti-Human NKX6.1 (mouse IgG1k) | BD Sciences | 563023 | 1:250 in flow cytometry |
| PE Mouse anti-Human PDX1 (mouse IgG1k) | BD Sciences | 562161 | 1:200 in flow cytometry; used for assaying Stage 4 cells |
| PE Mouse IgG1κ Isotype Control | BD Sciences | 554680 | 1:2,000 in flow cytometry |
| PE Mouse-Human Chromogranin A (CHGA, mouse IgG1k) | BD Sciences | 564563 | 1:200 in flow cytometry |
| R428 | Cayman Chemicals | 21523 | AXL tyrosine kinase inhibitor |
| Retinoid acid, all-trans | Sigma | R2625 | Light-sensitive |
| RIPA lysis buffer, 10x | Sigma | 20-188 | For hormone extraction |
| SANT-1 | Sigma | S4572 | SHH inhibitor |
| SLC18A1 antibody | Sigma | HPA063797 | 1:200 in whole mount immunofluorescence |
| Somatostatin antibody | Sigma | HPA019472 | 1:100 in whole mount immunofluorescence |
| STEMdiff Pancreatic Progenitor Kit | STEMCELL Technologies | 05120 | Basal media and supplements included |
| Synaptophysin antibody | Novus | NB120-16659 | 1:25 in whole mount immunofluorescence |
| Triton X-100 | Sigma | X100 | For permeabilization |
| Trolox | Sigma Millipore | 648471 | Vitamin E analog |
| TrypLE Enzyme Express | Life technologies | 12604-021 | cell dissociation enzyme reagent for single cell passaging hPSCs |
| Trypsin1/2/3 antibody | R&D Systems | AF3586 | 1:25 in whole mount immunofluorescence |
| Y-27632 | STEMCELL Technologies | 72304 | ROCK inhibitor |
| Zinc sulfate | Sigma | Z0251 | Medium supplement |
References
- Atkinson, M. A., Eisenbarth, G. S., Michels, A. W. Type 1 diabetes. Lancet. 383 (9911), 69-82 (2014).
- Petersen, M. C., Shulman, G. I. Mechanisms of insulin action and insulin resistance. Physiological Reviews. 98 (4), 2133-2223 (2018).
- Shapiro, A. M., et al. Islet transplantation in seven patients with type 1 diabetes mellitus using a glucocorticoid-free immunosuppressive regimen. The New England Journal of Medicine. 343 (4), 230-238 (2000).
- Gamble, A., Pepper, A. R., Bruni, A., Shapiro, A. M. J. The journey of islet cell transplantation and future development. Islets. 10 (2), 80-94 (2018).
- Pagliuca, F. W., et al. Generation of functional human pancreatic beta cells in vitro. Cell. 159 (2), 428-439 (2014).
- Rezania, A., et al. Reversal of diabetes with insulin-producing cells derived in vitro from human pluripotent stem cells. Nature Biotechnology. 32 (11), 1121-1133 (2014).
- Jennings, R. E., et al. Development of the human pancreas from foregut to endocrine commitment. Diabetes. 62 (10), 3514-3522 (2013).
- Jorgensen, M. C., et al. An illustrated review of early pancreas development in the mouse. Endocrine Reviews. 28 (6), 685-705 (2007).
- Jensen, J. Gene regulatory factors in pancreatic development. Developmental Dynamics. 229 (1), 176-200 (2004).
- Hald, J., et al. Generation and characterization of Ptf1a antiserum and localization of Ptf1a in relation to Nkx6.1 and Pdx1 during the earliest stages of mouse pancreas development. Journal of Histochemistry and Cytochemistry. 56 (6), 587-595 (2008).
- Villasenor, A., Chong, D. C., Henkemeyer, M., Cleaver, O. Epithelial dynamics of pancreatic branching morphogenesis. Development. 137 (24), 4295-4305 (2010).
- Rukstalis, J. M., Habener, J. F. Neurogenin3: a master regulator of pancreatic islet differentiation and regeneration. Islets. 1 (3), 177-184 (2009).
- Mastracci, T. L., Anderson, K. R., Papizan, J. B., Sussel, L. Regulation of Neurod1 contributes to the lineage potential of Neurogenin3+ endocrine precursor cells in the pancreas. PLoS Genetics. 9 (2), e1003278(2013).
- Balboa, D., et al. Functional, metabolic and transcriptional maturation of human pancreatic islets derived from stem cells. Nature Biotechnology. 40 (7), 1042-1055 (2022).
- Du, Y., et al. Human pluripotent stem-cell-derived islets ameliorate diabetes in non-human primates. Nature Medicine. 28 (2), 272-282 (2022).
- Hogrebe, N. J., Augsornworawat, P., Maxwell, K. G., Velazco-Cruz, L., Millman, J. R. Targeting the cytoskeleton to direct pancreatic differentiation of human pluripotent stem cells. Nature Biotechnology. 38 (4), 460-470 (2020).
- Yoshihara, E., et al. Immune-evasive human islet-like organoids ameliorate diabetes. Nature. 586 (7830), 606-611 (2020).
- Mahaddalkar, P. U., et al. Generation of pancreatic beta cells from CD177(+) anterior definitive endoderm. Nature Biotechnology. 38 (9), 1061-1072 (2020).
- Liang, S., et al. Differentiation of stem cell-derived pancreatic progenitors into insulin-secreting islet clusters in a multiwell-based static 3D culture system. Cell Reports Methods. 3, 10046(2023).
- Zhao, J., et al. In vivo imaging of beta-cell function reveals glucose-mediated heterogeneity of beta-cell functional development. Elife. 8, e41540(2019).
- Zhao, J., et al. In vivo imaging of calcium activities from pancreatic beta-cells in zebrafish embryos using spinning-disc confocal and two-photon light-sheet microscopy. Bio-protocol. 11 (23), e4245(2021).
- Liang, S., et al. Carbon monoxide enhances calcium transients and glucose-stimulated insulin secretion from pancreatic beta-cells by activating phospholipase C signal pathway in diabetic mice. Biochemical and Biophysical Research Communications. 582, 1-7 (2021).
- Bruin, J. E., et al. Maturation and function of human embryonic stem cell-derived pancreatic progenitors in macroencapsulation devices following transplant into mice. Diabetologia. 56 (9), 1987-1998 (2013).
- Toyoda, T., et al. Cell aggregation optimizes the differentiation of human ESCs and iPSCs into pancreatic bud-like progenitor cells. Stem Cell Research. 14 (2), 185-197 (2015).
- Russ, H. A., et al. Controlled induction of human pancreatic progenitors produces functional beta-like cells in vitro. EMBO Journal. 34 (13), 1759-1772 (2015).
- Veres, A., et al. Charting cellular identity during human in vitro beta-cell differentiation. Nature. 569 (7756), 368-373 (2019).
- D'Amour, K. A., et al. Efficient differentiation of human embryonic stem cells to definitive endoderm. Nature Biotechnology. 23 (12), 1534-1541 (2005).
- Jiang, Y., et al. Generation of pancreatic progenitors from human pluripotent stem cells by small molecules. Stem Cell Reports. 16 (9), 2395-2409 (2021).
- Tran, R., Moraes, C., Hoesli, C. A. Controlled clustering enhances PDX1 and NKX6.1 expression in pancreatic endoderm cells derived from pluripotent stem cells. Scientific Reports. 10 (1), 1190(2020).
- Mamidi, A., et al. Mechanosignalling via integrins directs fate decisions of pancreatic progenitors. Nature. 564 (7734), 114-118 (2018).
- Rezania, A., et al. Enrichment of human embryonic stem cell-derived NKX6.1-expressing pancreatic progenitor cells accelerates the maturation of insulin-secreting cells in vivo. Stem Cells. 31 (11), 2432-2442 (2013).
- Sander, M., et al. Homeobox gene Nkx6.1 lies downstream of Nkx2.2 in the major pathway of beta-cell formation in the pancreas. Development. 127 (24), 5533-5540 (2000).
Reprints and Permissions
