Here we describe a reliable method to measure mitochondrial mass and membrane potential in ex vivo cultured hematopoietic stem cells and T cells.
A fine balance of quiescence, self-renewal, and differentiation is key to preserve the hematopoietic stem cell (HSC) pool and maintain lifelong production of all mature blood cells. In recent years cellular metabolism has emerged as a crucial regulator of HSC function and fate. We have previously demonstrated that modulation of mitochondrial metabolism influences HSC fate. Specifically, by chemically uncoupling the electron transport chain we were able to maintain HSC function in culture conditions that normally induce rapid differentiation. However, limiting HSC numbers often precludes the use of standard assays to measure HSC metabolism and therefore predict their function. Here, we report a simple flow cytometry assay that allows reliable measurement of mitochondrial membrane potential and mitochondrial mass in scarce cells such as HSCs. We discuss the isolation of HSCs from mouse bone marrow and measurement of mitochondrial mass and membrane potential post ex vivo culture. As an example, we show the modulation of these parameters in HSCs via treatment with a metabolic modulator. Moreover, we extend the application of this methodology on human peripheral blood-derived T cells and human tumor infiltrating lymphocytes (TILs), showing dramatic differences in their mitochondrial profiles, possibly reflecting different T cell functionality. We believe this assay can be employed in screenings to identify modulators of mitochondrial metabolism in various cell types in different contexts.
Hematopoietic stem cells (HSCs) are a small population of cells residing in the bone marrow ensuring blood production and homeostasis throughout an organism's lifetime. HSCs mediate this process by giving rise to progenitors that in turn produce terminally differentiated mature blood cell lineages via several rounds of cell division and well-orchestrated differentiation steps1. Importantly, HSCs produce their energy via anaerobic glycolysis. In contrast, more committed and active hematopoietic progenitors switch their metabolism toward mitochondrial metabolism2,3,4. This distinct metabolic state is believed to protect the HSCs from cellular damage inflicted by reactive oxygen species (ROS) produced by active mitochondria, thereby maintaining their long-term in vivo function5,6,7,8. Direct measurement of the HSC metabolic state is challenging and often low throughput due to their limited numbers. Here, we describe a flow cytometry-based assay for robust measurement of mitochondrial membrane potential (ΔΨm) using tetramethylrhodamine methyl ester (TMRM) fluorescence, and mitochondrial mass using a green fluorescent mitochondrial stain (Mitotracker Green) in HSCs. We have previously demonstrated that low ΔΨm is a bona-fide functional marker of highly purified HSCs9 and metabolic modulators capable of lowering ΔΨm enhance HSCs function9,10. Here we propose use of our method on HSCs mitochondrial profiling as strategy to identify novel molecules capable of improving the HSCs' long-term blood reconstitution potential.
As an example, we demonstrate that this assay reliably measures the lowering of HSC ΔΨm upon exposure to vitamin B3 analog nicotinamide riboside (NR). Accordingly, in our recently published study we demonstrate that NR strongly ameliorates blood recovery posttransplant in both mouse and humanized mouse systems by directly improving hematopoietic stem and progenitor functions10. The capacity of such metabolic modulators is of great clinical value considering that a 25% death rate is linked to delay in blood and immune recovery in posttransplanted patients11,12.
Moreover, we provide evidence that this methodology can be applied for the characterization of the metabolic profile and function of human T cells. In recent years, the development of adoptive cell therapy (ACT) using autologous tumor infiltrating lymphocytes (TILs) has become the most effective approach for certain types of advanced cancer with extremely unfavorable prognosis (e.g., metastatic melanoma, where >50% of patients respond to treatment and up to 24% of patients have complete regression)13. However, TILs harboring sufficient antitumor activity are difficult to generate14. The extensive proliferation and stimulation that TILs undergo during ex vivo expansion cause T cell exhaustion and senescence that dramatically impair T cell antitumor response15. Importantly, the TILs' antitumoral capacity is tightly linked to their metabolism16,17 and approaches aimed to modulate metabolism through the inhibition of the PI3K/Akt pathway have produced encouraging results18,19. For this reason, we compare the ΔΨm of T cells derived from peripheral blood mononuclear cells (PBMCs) and patient-derived TILs, and show that less differentiated PBMC-derived T cells have lower ΔΨm and mitochondrial mass as compared to terminally differentiated TILs.
We envision that this assay can be used to identify novel metabolic modulators that improve HSC and T cell function via the modulation of ΔΨm.
All experiments described in the manuscript follow the guidelines of our institution and were carried out in accordance with Swiss law for animal experimentation (Authorization: VD3194) and for research involving human samples (Protocol: 235/14; CER-VD 2017-00490)
1. Hematopoietic Stem Cell Extraction
2. Ex Vivo Culture of Hematopoietic Stem Cells
3. Measurement of Mitochondrial Mass and Membrane Potential
In Figure 1 we show the gating strategy for the isolation of hematopoietic stem cells from the mouse bone marrow and the layout of the plate for their ex vivo culture. Figure 1A shows the identification of the lymphocyte fraction in the SSC-A/FSC-A plot. Doublets were removed in the singlet gate followed by identification of live cells by the absence of DAPI signal. The LKS population, defined by lineage- Sca1+cKit+, was identified. This population is known to contain stem and progenitor cells. HSCs form around 5–10% of the cells in the LKS population and were identified by gating for CD150+CD48– population. Figure 1B represents the layout of the 96-well plate for ex vivo culture. Sorted HSCs were plated in different culture conditions:In this case, control and NR supplemented culture conditions. Whole bone marrow cells were also plated as single-color controls as described in the protocol. It is important to fill all surrounding wells with water to avoid evaporation of media from cell-containing wells. Moreover, as mentioned previously, marginal wells were avoided for cell culture because they are more susceptible to evaporation.
Figure 2 shows the measurement of mitochondrial membrane potential (ΔΨm) and mass in HSCs post culture. Figure 2A shows representative plots of TMRM levels (above) and green fluorescent mitochondrial stain (below) in HSCs cultured in control and NR supplemented conditions. NR treatment showed a clear increase in the TMRMlow population. Figure 2B shows the quantification from three independent samples. NR treatment significantly increased the proportion of cells in the TMRMlow gate and showed a significant lowering of TMRM fluorescence intensity. Mitochondrial mass (represented by green-fluorescence intensity) did not change upon NR supplementation. Additionally, we combined stem cell marker staining with mitochondrial staining post culture. Figure 2C shows the gating strategy to identify HSCs from lineage negative and LKS populations post culture in the two culture conditions. The TMRM and green fluorescent mitochondrial stain profile of these gated HSCs is seen in Figure 2D. Exposure to NR showed a significant increase in the %TMRMlow population and a significant decrease in the TMRM fluorescence intensity in gated HSCs. The green fluorescent mitochondrial stain green signal remained unchanged in the two conditions.
Figure 3 shows the measurement of mitochondrial membrane potential (ΔΨm) and mass in different human T cells: peripheral blood mononuclear cells (PBMCs) CD4+ and CD8+ T cells, as well as CD4+ and CD8+ tumor infiltrating lymphocytes (TILs) after the rapid expansion protocol (REP). Figure 3A shows representative plots of the TMRM levels (above) and green-fluorescent mitochondrial stain levels (below) of circulating (PBMC) and tumor-infiltrating (TIL) CD4+ and CD8+ T cells. TILs showed a clear increase in TMRM and green fluorescent mitochondrial stain signal compared to circulating T cells. Figure 3B shows the MFI quantification of TMRM and green fluorescent mitochondrial staining. TILs displayed higher TMRM and green fluorescent mitochondrial staining signals compared to PBMC-derived T cells. These data indicate that TILs have a distinguished metabolic profile with increased ΔΨm and mitochondrial mass.
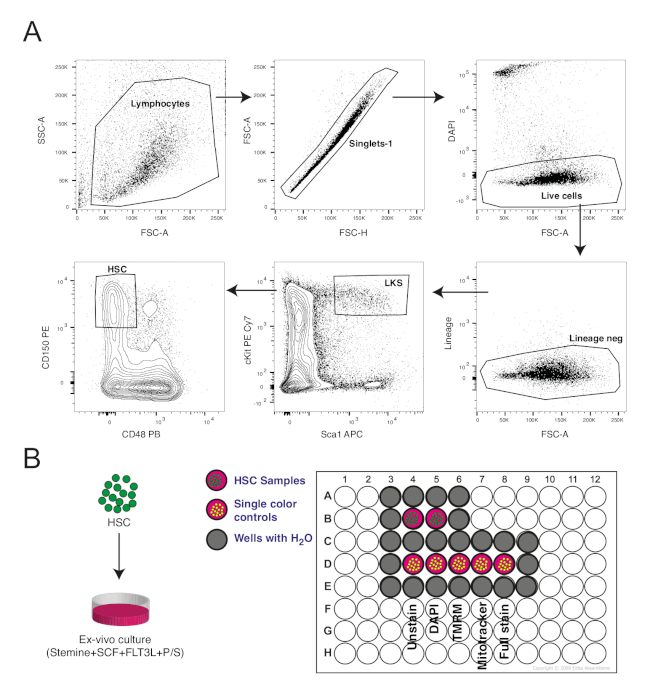
Figure 1: Isolation and culture of hematopoietic stem cells. (A) Gating strategy for isolation of hematopoietic stem cells (HSCs) based on cell surface markers. HSCs were identified as lineage- Sca1+ cKit+ (LKS) CD150+CD48–. (B) Design of 96 well plate put in culture. Please click here to view a larger version of this figure.
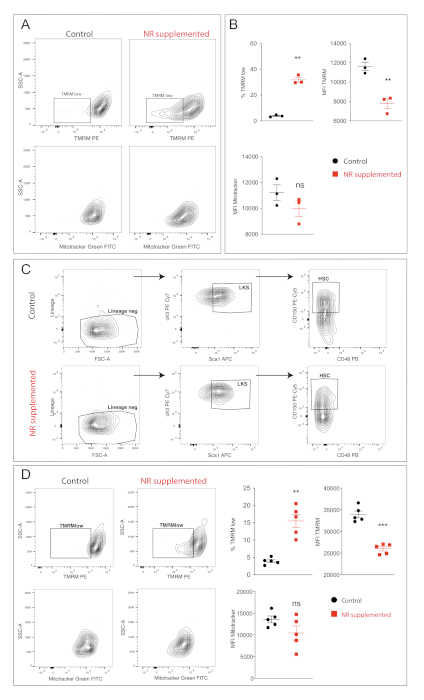
Figure 2: Mitochondrial profiles of HSCs. (A) FACS contour plot showing HSCs post culture in basal or NR supplemented conditions. TMRM (above) and green fluorescent mitochondrial stain (Mitotracker) (below) profiles are shown. (B) Quantification of TMRM and green fluorescent mitochondrial stain signal. NR supplementation resulted in a decrease in TMRM profile while maintaining the green fluorescent mitochondrial stain signal. (C) Contour plots showing identification of HSC population in control and NR supplemented conditions post culture. (D) Contour plots and quantification of TMRM and green fluorescent mitochondrial stain signal in phenotypic HSCs post culture. NR supplementation reduced the TMRM signal while the green fluorescent mitochondrial stain signal remained unchanged in HSCs. Student t test ***p < 0.001, ** p < 0.01, * p < 0.05, not significant > 0.05, error bars = SEM. Please click here to view a larger version of this figure.
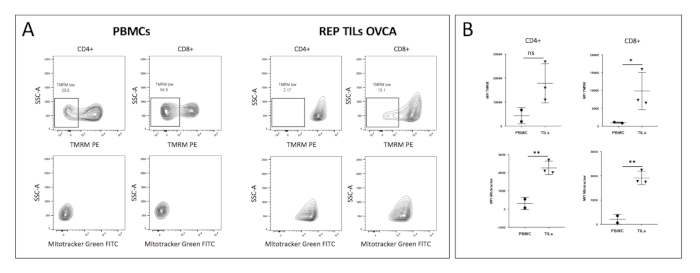
Figure 3: Mitochondrial profiles of human PBMCs and TILs: (A) FACS contour plot showing CD4+ and CD8+ freshly isolated from PBMCs or tumor-derived CD4+ and CD8+ post REP (rapid expansion protocol). TMRM (above) and green fluorescent mitochondrial stain (Mitotracker) (below) profiles are shown. (B) Quantification of TMRM and green fluorescent mitochondrial stain signal. TILs displayed lower mitochondrial activity and mass. Student t-test ***p < 0.001, **p < 0.01, *p < 0.05, not significant > 0.05, error bars = SD. Please click here to view a larger version of this figure.
S.No | Antibody name | Working dilution |
1 | Streptavidin Tx red | 1/200 |
2 | Sca1 APC | 1/200 |
3 | Ckit PeCy7 | 1/100 |
4 | CD150 PE | 1/100 |
5 | CD48 PB | 1/100 |
To be used only if stem cell and mitochondrial markers combined. | ||
6 | Streptavidin Pac orange | 1/200 |
7 | CD150 PE-Cy5 | 1/100 |
Table 1: Antibody dilutions.
A tight regulation of HSC function is important to maintain stable hematopoiesis during an organism's lifetime. Like various other cell types in the body, a key component that contributes to the regulation of HSC function is cellular metabolism. Previous studies from our lab9 and others2,3 have implicated the importance of mitochondria in maintaining a distinct metabolic state in HSCs. Due to the extremely low number of HSCs isolated from murine bone marrow, it is difficult to analyze them via standard metabolic assays (e.g., oxygen consumption with SeaHorse). Based on our previous work, we standardized a simple flow cytometry assay to reliably measure mitochondrial mass and membrane potential (an indirect readout for activity) in a low number of cells (i.e., HSCs). This assay allows measurement on living cells without compromising their viability9, making them available for any downstream functional assays (such as CFUs or bone marrow transplantations) that users may wish to perform. We foresee this assay being employed in screening experiments, allowing for a quick readout on the mitochondrial profile of HSCs from different genetic backgrounds or knockout models. Importantly, our assay can be combined with CFSE staining to have a dual readout on HSC proliferation and its mitochondrial profile9,10, allowing the analysis of the metabolic fate of dividing HSCs. Considering that it is a difficult staining procedure and we are working with a low number of cells (HSCs), it is important that post centrifugation the users always leave 80–100 µL of solution in the tubes in order to minimize cell loss. Additionally, during all post staining steps the tubes or plates should be protected from light, either by covering them in foil or working in a low light environment. If the users decide to combine HSC stain with mitochondrial dyes they must check if the compensation is performed correctly, especially between TMRM (PE), PeCy5, and APC.
Importantly, a recent publication questions the use of mitochondrial dyes in HSCs because they might be susceptible to pump efflux. These studies report that most primitive hematopoietic compartments have higher numbers of mitochondria compared to their committed progenitors20. In our experience, the use of mouse genetic models (mito eGFP mice21), mitochondria dye-independent staining methods (TOM20 antibody), QPCR analysis supports the notion that most primitive hematopoietic compartments have lower mitochondrial content10. We believe that further studies have to be performed in order to clarify this discrepancy in the field.
In parallel, we demonstrate that the use of mitochondrial profiling could be exploited to determine the metabolic fitness of human TILs and develop metabolic strategies aimed to restore the function of exhausted T cells. In fact, T cells isolated from PBMCs display lower mitochondrial activity (TMRM) and mass (Mitotracker Green), while more exhausted T cells such as TILs have higher mitochondrial activity and mass, suggesting a possible metabolic reprogramming occurring during exhaustion. Accordingly, previous published studies have demonstrated that stem cell-like memory T cells (TSCM), T cells with enhanced persistence and capable of long-term recall response, have lower ΔΨm and treatments targeting T cell metabolism can strongly influence their function22,23.
Finally, we believe that our approach could be a valuable tool for the identification of novel compounds that can repair dysfunctional HSCs (e.g., aging or hematological malignancies) by restoring their mitochondrial fitness.
The authors have nothing to disclose.
We thank the UNIL Flow Cytometry Core Facility for their support especially Dr. Romain Bedel. This work was supported by the Kristian Gerhard Jebsen foundation grant to N.V and O.N.
5 mL FACS tubes | Falcon | 352235 | Sample preparation |
96-U bottom plate | Corning | 3799 | Cell culture |
AutoMACS pro separator | Miltenyi Biotec | Automatic Cell separation | |
BD FACS AriaIII | Becton and Dickinson | Cell sorting | |
BD IMag mouse hematopoietic progenitor cell enrichment kit | BD | 558451 | Lineage depletion |
BD LSRII | Becton and Dickinson | FACS acquisition machine | |
BD-DIVA | Becton and Dickinson | Acquisition software | |
CD150 PE | Biolegend | 115904 | Antibody staining mix |
CD150 PE-Cy5 | Biolegend | 115912 | Antibody staining mix |
CD48 PB | Biolegend | 103418 | Antibody staining mix |
Centrifuge- 5810R | Eppendorf | Centrifugation | |
Ckit PeCy7 | Biolegend | 105814 | Antibody staining mix |
Flow jo | FlowJo LLC | FACS Analysis software | |
GraphPad-Prism | GraphPad | Plotting data into graphs | |
Mitotracker Green | Invitrogen | M7514 | Green-fluorescent mitocondrial stain to measure mitochondrial mass; working concentration = 100 nM; stock concentration = 1 mM |
Nicotinamide Riboside (NR) | Custom synthesized in house | Metabolic modulator; working concentration = 500 µM; stock concentration = 50 mM | |
PBS | CHUV | 1000324 | Buffer preparation; working concentration = 1x; stock concentration = 1x |
Pen-Strep (P/S) | Life technologies | 15140122 | Ex vivo culture; working concentration = 1x; stock concentration = 1x |
RBC Lysis buffer | Biolegend | 420301 | Lysing Red blood cells; working concentration = 1x; stock concentration = 10x |
Recombinant Mouse Flt-3 Ligand (FLT3) | RnD | 427-FL-005/CF | Ex vivo culture; working concentration = 2 ng/mL; stock concentration = 10 µg/mL |
Recombinant mouse stem cell factor (SCF) | RnD | 455-MC-010/CF | Ex vivo culture; working concentration = 100 ng/mL; stock concentration = 50 µg/mL |
Sca1 APC | Thermo Fisher Scientific | 17-5981-82 | Antibody staining mix |
StemlineII Hematopoietic Stem Cell Expansion Medium | SIGMA | S0192 | Ex vivo culture |
Streptavidin Pac orange | Life Technologies | S32365 | Antibody staining mix |
Streptavidin Tx red | Life Technologies | S872 | Antibody staining mix |
TMRM | Invitrogen | T668 | Staining mitochondrial membrane potential; working concentration = 200 nM; stock concentration = 10 mM |
Ultra pure EDTA | Invitrogen | 15575-038 | Buffer preparation; working concentration = 0.5 M; stock concentration = 1 mM |