1. Prepare DQ-substrates
- Allow lyophilized DQ-substrates to warm to room temperature before opening vials, prepare stock solution of 1 mg/ml of DQ-substrate in deionized water, divide into 50 μl aliquots and store at 4 °C.
It may be necessary to agitate DQ-substrate in an ultrasonic water bath for ~5 min and heat to 50 °C to facilitate dispersion.
- Thaw rBM on ice overnight at 4 °C; rBM should be handled on ice at all times.
- To make 10X phosphate buffered saline (PBS), dissolve 80 g NaCl (1.37 M), 2 g KCl (0.027 M), 14.4 g Na2HPO4 (1 M), and 2.4 g KH2PO4 ( 0.02 M) in 800 ml ultrapure water. Adjust pH of PBS buffer solution to 7.4 with 1.0 M HCl. Bring volume to 1 liter, sterilize by filtration.
- Prepare collagen I solution on ice: 8 parts of chilled collagen I to 1 part of chilled 10X PBS. Adjust pH of mixture to 7.2-7.6 using sterile 0.1 M NaOH. Check pH with pH strips and adjust the final volume to 10 parts with sterile water.
- Prepare DQ-collagen I:collagen I matrix by diluting DQ-collagen I in collagen I solution in a prechilled tube to a final concentration of 25 μg/ml and 2.4 mg/ml, respectively.
- Prepare DQ-collagen IV:reconstituted basement membrane (rBM) matrix by diluting DQ-collagen IV in rBM (Cultrex or Matrigel) in a prechilled tube to a final concentration of 25 μg/ml and 12-15 mg/ml, respectively. Mix on ice using gentle pipetting to avoid creating bubbles.
2. Prepare MAME cocultures
See Figure 1 for a schematic diagram of cocultures.
- Place two rectangular plastic coverslips (sterilized in 70% alcohol for 10 min and air-dried) in a 35-mm culture dish or use an IbiTreat 35-mm μ-Dish. Directions here are for both coverslips and μ-Dishes, which we use for studies on an upright microscope. For studies on an inverted microscope, we use only μ-Dishes.
- Mix the desired number of fibroblasts with DQ-collagen I:collagen I matrix. For the long-term cocultures illustrated in Figures 2 and 3, we use 500 fibroblasts in 10 μl of media plus 60 μl of DQ-collagen I:collagen I matrix.
- Using a 100-μl micropipettor, carefully pipette and spread 70 μl of fibroblast:DQ-collagen I:collagen I matrix over the entire surface of each coverslip and leave at 37 °C in a humidified incubator without CO2 for 30 min to solidify.
- Transfer 35-mm dishes containing coverslips to 37 °C incubator with 5% CO2 for 10 min to equilibrate.
- Remove from incubator and leave the 35-mm dishes under the hood until they come to room temperature.
- Add 60 μl of DQ-collagen IV:rBM matrix on top of the solidified DQ-collagen I:collagen I matrix with embedded fibroblasts. With pipette tip, carefully spread DQ-collagen IV:rBM matrix evenly, avoiding scratching the fibroblast:DQ-collagen I:collagen I matrix.
- Transfer 35-mm dishes containing coverslips to 37 °C incubator with 5% CO2 for 10 min to solidify. While the DQ-collagen IV:rBM matrix is solidifying, trypsinize and count epithelial cells.
- Place 50 μl of an epithelial/tumor cell suspension onto coverslips coated with DQ-collagen IV:rBM matrix. Place 35-mm dishes containing the coverslips into a 37 °C incubator. Allow 40 to 60 min for the cells to attach to DQ-collagen IV:rBM matrix. For the long-term cocultures illustrated in Figures 2 and 3, we use 2500 epithelial or tumor cells.
- Add 2 ml of culture medium containing 2% rBM to each 35-mm dish. If doing any drug treatments, the drugs should be added at this time.
- Incubate for desired period of time before imaging. For long-term cultures, media should be changed every 3-4 days. The cells can be maintained in their normal culture medium. For MAME cocultures of breast cell lines, we use Epithelial Basal Medium (MEBM-PRF) supplemented with MEGM SingleQuots.
3. Perform 4D (3D + time) imaging of live MAME cocultures by confocal microscopy
- For the proof-of-principle studies illustrated, MAME cocultures were labeled with a fluorescent cell tracking dye according to our published procedure1. After washing with PBS, cocultures were incubated with 5 μM CellTracker Orange in MEGM medium for 45 min in a 37 °C incubator, washed again with PBS and incubated with prewarmed MEGMmedium for 30 min in 37 °C with 5% CO2 incubator before imaging.
- Image MAME cocultures live at a low magnification (10X, water dipping lens) on a Zeiss LSM-510 META confocal microscope.
- Optical sections are captured at intervals throughout the entire depth of the structures. For our studies, we capture optical sections at 10 μm intervals.
- Use optical sections to reconstruct images in 3D. We use Volocity software to generate 3D reconstructions.
- Make movies of the 3D reconstructions so that structures, cell:cell interactions and interactions with the surrounding matrices can be visualized. We made movies with QuikTime Player 7.
4. Representative Results
The MAME cocultures that we developed are a tractable experimental model for live-cell imaging in real-time of interactions among the various cellular constituents that comprise a breast tumor and its microenvironment. Here we demonstrate the capability of MAME models to recapitulate cell:cell interactions during breast cancer progression and of live-cell imaging to follow those interactions over time. We illustrate the ability to image interactions between a preinvasive MCF10.DCIS human breast cell line and a human breast cancer-associated fibroblast line, WS-12Ti, over a period of more than three weeks in culture. The cocultures were imaged at 3, 16 and 23 days. Optical sections through the entire volume of the cocultures were reconstructed in 3D and representative examples are shown for each of the three timepoints in Figure 2. The red fluorescence in Figure 2 represents the MCF10.DCIS and WS-12Ti cells. To discriminate between the two cell types and for long-term cocultures, one can transfect or transduce individual cell types with fluorescent proteins prior to establishing the cultures. A MAME coculture of MCF10.DCIS and WS-12Ti cells that are differentially labeled with fluorescent proteins for identification is illustrated in Figure 3.
By incorporating substrates, in this case DQ-collagens, into the MAME cocultures, we can assess and quantify changes over time in proteolysis associated with transition to an invasive phenotype. We have established methods for quantifying the fluorescent cleavage products that result from DQ-collagen degradation2,3. We normalize degradation products throughout the entire 3D volume of the MAME cocultures on a per cell basis by labeling and counting cell nuclei. Furthermore, we can localize the degradation to extracellular and intracellular compartments and quantify the total, intracellular and extracellular degradation products as we have described previously2. The green fluorescence in Figures 2 and 3 represents cleavage products of the two DQ-collagen substrates. At this time, differentially-labeled collagens are not available that would allow us to distinguish between degradation of type IV collagen and degradation of type I collagen.
The interactions in the MAME cocultures are dynamic and can change over time. To obtain temporal and dynamic information, the same field of view can be imaged and optical sections taken through the entire specimen of the volume repeatedly over a period of time from minutes to weeks, thus collecting data in 4-D. In Figure 2, we illustrate rather dramatic changes that occur over 23 days: changes in cell number, cell migration and cell interactions, structure volumes, structure shapes, deviations of the structures from sphericity, invasive outgrowths and proteolysis. Furthermore, we also demonstrate an overall change in volume due to the MAME cocultures degrading their surrounding extracellular matrix over this time period. At three days as illustrated in Figure 2A, the volume is 110,000 μm3. In contrast, the volume of the MAME cocultures at 16 and 23 days is only 46,250 μm3, as illustrated in Figures 2B and C.
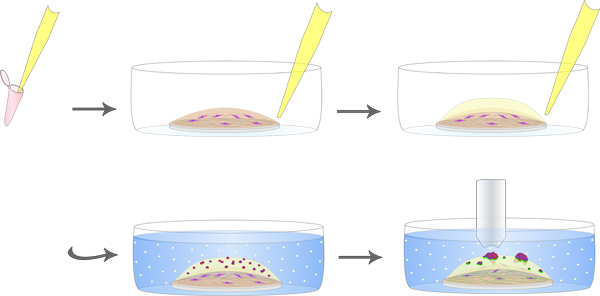
Figure 1. Schematic diagram of MAME cocultures. Plastic coverslip is coated with collagen I, containing DQ-collagen I and fibroblasts (magenta). A 2nd layer of reconstituted basement membrane (rBM) containing DQ-collagen IV is added. Tumor cells (red) are plated on top and 2% rBM in culture media is overlaid (white dots) with every change of media. Green represents the fluorescent cleavage products of DQ-collagen I and IV.
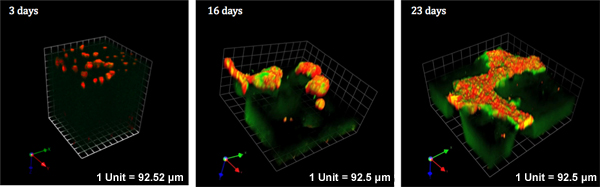
Figure 2. MAME cocultures of MCF10.DCIS human breast cells and WS-12Ti human breast fibroblasts. The fibroblasts were embedded in collagen I/DQ-collagen I and overlaid with rBM containing DQ-collagen IV. The DCIS cells were then seeded on the rBM and overlaid with media containing 2% rBM. Over the 23 days in coculture illustrated here, there was cell proliferation, degradation of DQ-collagen IV and I (green) and collagen matrices as indicated by the reduction in volume of the cocultures. Cells were localized by labeling with CellTracker Orange in situ before imaging (red). The same live cocultures were observed over the 23 days with images captured by confocal microscopy at 3, 16 and 23 days of coculture. The resulting optical slices were reconstructed in 3D with Volocity software. Magnification, 10X.
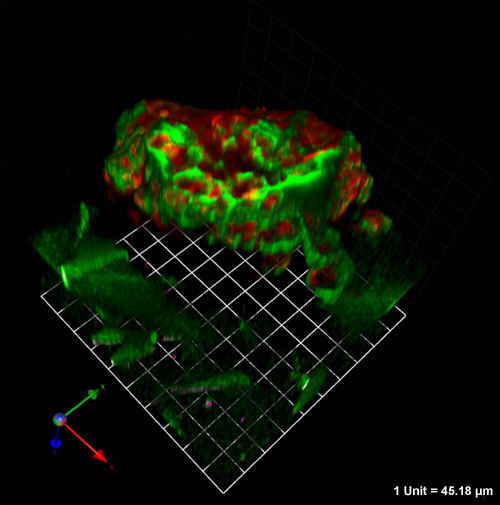
Figure 3. MAME 16 day cocultures of MCF10.DCIS human breast cells and WS-12Ti human breast fibroblasts that express RFP (red) and YFP (white), respectively. Cocultures were established and analyzed as in Figure 2. The two cell types shown here had, however, been differentially labeled so that they could be distinguished from one another. The higher magnification images in this figure, as compared to those in Figure 2, illustrate proteolysis of DQ-collagen IV at the surface of the DCIS cells and diffuse proteolysis of DQ-collagen I in areas near the fibroblasts. Magnification, 20X.
