The protocol here describes the methods for the assessment of the arbuscular mycorrhizal colonization patterns and strategy in roots for two species: Zea mays and Festuca rubra. The use of the MycoPatt method permits the calculation of parameters, the conversion of mycorrhizal structures into digital data, and the mapping of their real position in roots.
Arbuscular mycorrhizal fungi are symbionts in the roots of plants. Their role is to sustain host development and maintain the nutritional equilibrium in the ecosystems. The colonization process is dependent on several factors like soil ecology, the genetic diversity of the fungi and host, and agronomic practices. Their synchronized action leads to the development of a complex hyphal network and leads to the secondary development of vesicles and arbuscules in the root cells. The aim of this research was to analyze the efficiency of the mycorrhizal patterns (MycoPatt) method for the positioning of fungal structures in the roots of Festuca rubra and Zea mays. Another objective was to explore the fungal colonization strategy as revealed by mycorrhizal maps of each species. The acquisition and assemblage of multiple microscopic images allow mycorrhizal colonization assessment in both corn and red fescue plants to provide information on the realistic position of the developed structures. The observed mycorrhizal patterns highlight the variable efficiency of each plant in terms of developing connections with soil symbiotic fungi, caused by applied treatments and growth stage. Mycorrhizal detailed maps obtained through the MycoPatt method are useful for the early detection of plant efficiency in symbiotic acquisition from the soil.
Arbuscular mycorrhiza (AM) fungi are a category of soil-borne endophytes that are constantly an area of interest for researchers. Their presence in the roots of most plants and their involvement in nutrient cycles makes them vital components in the stability of every ecosystem where herbaceous plants are present1,2. Through their extra-radicular mycelium, AM act as a fungal extension for plant roots, especially in hard-to-reach areas3. The main activity is in host plant roots, where AM develops large hyphae networks and specific intracellular structures called arbuscules. The lack of host specificity allows the symbiont to colonize multiple species at the same time. This ability provides AM with the role of resource allocation and nutrient regulation in the ecosystem; the fungus also provides support in plant survival and aids in plant performance4,5,6,7. The reaction of AM species to host roots is visible in the extension and location of the intra-radicular mycelium and the presence and shape of the arbuscules developed intracellularly. The intracellular arbuscules act as an interchange point between the two symbionts and represent areas characterized by fast transfer processes. The structures that the AM produce are species-dependent, and, in addition to arbuscules, in the roots, they also develop vesicles, spores, and auxiliary cells.
There are many challenges in the assessment of AM symbionts in plant roots8,9. The first one is their constant development during the entire vegetation period of hosts, which leads to multiple changes in the hyphal arbuscular structure. The different stages of arbuscular growth, up to their collapse, are clearly present in roots, but the senescent AM structures are sometimes digested, which makes them only partially visible10. The second challenge is represented by the staining method and protocol, the large diversity of root systems, the dimension of their cells, and the differences in thickness, which make it hard to propose a unified method. The last challenge is represented by the assessment and scoring of AM colonization. There are numerous methods that score AM with different degrees of objectivity, and most of them are still restricted to microscopy techniques. The simple ones are based on the presence/absence of structures in the root cortex, while the more complex ones are based on visual scoring and the use of colonization classes, with the integration of the frequency and intensity of the colonization phenomenon. A lot of data have been produced in the last decades on the mycorrhizal status of multiple species, but most of the methods are restricted to the observed value of colonization without pointing to the real position of each structure in the root cortex. As a response to the necessity of more accurate results on AM colonization, a method based on microscopic analysis of mycorrhizal patterns (MycoPatt) in roots was developed to assemble, in a digital form, the detailed mycorrhizal maps11. Also, the method allows the objective calculation of colonization parameters and the determination of the actual position of each structure in the root.
The position of the AM fungal structures can be important in answering the following two questions. The first one is related to the analysis of the colonization in one specific moment from the vegetation cycle of a plant. In this context, it is very useful to observe the arbuscular/vesicle abundance, report how are they located in the root, and provide a very clear colonization image and parameters. The second one is related to the detection of fungal strategy and its orientation and even the forecast of its future development. One application of the MycoPatt can be for plants analyzed daily, every 2-3 days, weekly, or during various growth stages. In this context, the location of the vesicles/arbuscules is important to better understand the biological mechanism of AM colonization. These parameters and observations are very useful to supplement the mathematical parameters.
The aim of this article is to demonstrate the ability of the MycoPatt system to explore the native AM fungi colonization potential and strategy in Zea mays (corn) roots during different development stages and in Festuca rubra (red fescue) roots under different long-term fertilization conditions. To fulfill the aim, two large databases from two experiments were analyzed. The corn experiment was established at Cojocna (46°44′56″ lat. N and 23°50′0″ long. E), in the Experimental Didactic Farm of the University of Agricultural Sciences and Veterinary Medicine Cluj on a phaeoziom with a loamy texture soil12. The red fescue experiment is a part of a larger experimental site established in 2001 in Ghețari, Apuseni Mountains (46°49'064" lat. N and 22°81'418'' long. E), on a preluvosol (terra rossa) soil type13,14. Corn was collected in five different growth phenophases12: B1 = 2-4 leaves (as a control point for the start of mycorrhizal colonization); B2 = 6 leaves; B3 = 8-10 leaves; B4 = cob formation; B5 = physiological maturity. Starting from the 2-4 leaves stage (A0), an organic treatment was applied, which resulted in a two-graduation factor (A1 = control and A2 = treated). Roots of red fescue were collected at flowering from an experiment with five long-term fertilizations13,14: V1 = control, non-fertilized; V2 = 10 t·ha-1 manure; V3 = 10 t·ha-1 manure + N 50 kg·ha-1, P2O5 25 kg·ha-1, K2O 25 kg·ha-1; V4 = N 100 kg·ha-1, P2O5 50 kg·ha-1, K2O 50 kg·ha-1; V5 = 10 t·ha-1 manure + N 100 kg·ha-1, P2O5 50 kg·ha-1, K2O 50 kg·ha-1. Five plants were collected in each development stage from every fertilization variant. The staining protocols and their performance in terms of sample processing time and quality of staining were analyzed. The relation between AM hyphae development and the presence of its structures in roots was analyzed separately for each species and continued with the identification of the most permissive roots for colonization. The specific colonization patterns of each root system were analyzed based on colonization maps and the value of AM parameters.
Corn is an annual plant, which implies continuous growth of the roots, and that was the main reason to apply the MycoPatt in the growing stages. Red fescue is a perennial plant from a grassland treated for a long time with different fertilizers. Its roots have a shorter development of 1 year, and the anthesis is considered as the vegetation point when the plant changes its metabolism from vegetative to generative. To catch these plants during these intense activity periods, the abovementioned time points were chosen. Sampling during the vegetation period is difficult for this species when grown in natural grasslands.
1. Selection of biological material, root sampling, and storage
2. Root processing, clearing, and staining for microscopy
NOTE: Use gloves, a mask, and a microbiological/chemical hood for this step of the protocol.
3. Root processing for microscopy
4. Microscopic analysis of the root samples
5. Post-microscopy image assemblage
6. Scoring of mycorrhizal colonization
7. Raw data analysis and result extraction
The correct use of the gentle crushing method of the roots after the staining procedures provides good details of mycorrhizal structures, both for Zea mays (Figure 8A–C) and Festuca rubra (Figure 9A–E), good contrast between mycorrhizal structures and root cells, and a confirmation of the stele due to the blue color. If the clearing and staining procedures fail to succeed, root samples are hard to crush and do not clearly show mycorrhizal structures (Figure 10A–E). In this case, repeat the entire clearing-staining procedure.
The use of the mycorrhizal pattern method and the MycoPatt tool allowed a complete exploration of the colonization mechanism. The method provides a deep, small-scale exploration of colonization patterns and strategies for each species (Figure 11 and Figure 12) with an additional visual expression of colonization parameters (Table 1 and Table 2). The two studies conducted on Zea mays, described extensively by Pop-Moldovan et al.12, and Festuca rubra, detailed by Corcoz et al.13,14, provided a large database of observations, mycorrhizal maps, and colonization parameters. Both databases scored frequency of colonization (%), intensity of colonization (%), arbuscules (%) and vesicles (%), the percentage of non-mycorrhizal areas (%), overall colonization degree (%), and the report of mycorrhizal/non-mycorrhizal areas as colonization parameters. For Zea mays, the database consisted of 5,850 line entries in the spreadsheet database, compiled in 390 colonization maps. The Zea mays experiment proposed the report of mycorrhizal/non-mycorrhizal areas as a parameter for the description of alternation and disruption between colonized areas in the roots. The approach permits the in-depth analysis of the colonization mechanism and its development along the roots. Festuca rubra provided a database of 4,500 line entries in the spreadsheet, compiled in 300 maps. One new index was proposed, the arbuscules/vesicles report, which was further used as an indicator of colonization strategy. The overall assessment of colonization strategy proposed four different scenarios of mycorrhizal development: 1) propagative strategy, 2) transfer strategy, 3) storage strategy, and 4) plant-resistance strategy. For the extraction of the most representative mycorrhizal maps, both databases were explored based on transformed average values of frequency and intensity of colonization, resulting in the extraction of three different maps for each variant analyzed (Table 1 and Table 2). The three maps represent the AM colonization from the root segments that have the closest values to the following: the average (Av) of each variant, which is calculated based on all data available for a variant; the Av−, which represents a value calculated by the difference between average and average/2 (Av−Av/2) and shows a lower normal colonization potential; and the Av+, which represents a value calculated by the sum between average and average/2 (Av+Av/2) and shows a higher normal colonization potential. The use of this extraction formula permits the user to avoid the extremes (highest or lowest) of the colonization. The method permits the extraction of the most possible cases of mycorrhizal colonization.
Zea mays presented highly fluctuating colonization potential, which depended on the development stage of the plant (Table 1, Figure 11). The values of colonization frequency varied greatly between 3.67%-69.60%, supported by values at 50% for the intensity of the colonization. The main reason for this phenomenon is that the root system continuously develops during the entire vegetation period. Arbuscules presented maximum values in the 6 leaves (B2) development stage, with a decrease in the following growth stages. Vesicles appeared sporadically, with values lower than 1%. The exploration of mycorrhizal patterns revealed that hyphae were developed in different areas of the roots, with limited extension. Large discontinuities between colonized areas were observed, with an irregular development of hyphae around the central point of colonization. The colonization strategy showed large variations in the interval of the plant-resistance to the proliferative and transfer strategies. The stage of 6 leaves (B2), followed by the stage of cob formation (B4), exhibited a transfer strategy of colonization, sustained by the mycorrhized/non-mycorrhized area reports being lower than 0.14. The only case with a visible high transfer strategy was recorded in the B2 stage when large areas of roots presented arbuscules. Their overall positioning showed a clear separation between the area where arbuscules were developed and the area where arbuscules were in an emergent stage. The most homogenous average colonization pattern was observed in the B5 development stage, with constant non-colonized areas between the colonized ones. The overall assessment of this visual phenomenon corresponded to the final vegetation period, with small values of arbuscules, which indicated the regression of these structures.
Festuca rubra is a dominant species in mountain grasslands with a perennial root system. Due to this adaptation, most of the colonization processes take place inside the roots, and the development of hyphal networks is correlated with a low development speed of the roots (Table 2, Figure 12). Due to the application of fertilizers, the colonization parameters presented high differences between variants. The differences in the colonization frequency were 65%, sustained by a 36% difference in the recorded intensities. Each variant showed a different colonization pattern, correlated with the long-term application of treatments, and accompanied with avariation between 0.09-0.96 in the mycorrhized/non-mycorrhized areas report and 0-9.43 in the arbuscules/vesicles report. The control variant (V1) showed an average storage-oriented strategy, with a limited area restricting the development of arbuscules for the Av+ colonization map. The simplified image of the colonization (Av−) showed linear as well as lateral development of the hyphae, which was completely oriented to irregular colonization for the two upper models (Av− and Av+). The application of organic treatments (V2) induced dual, linear, and irregular hyphal development in the roots. The colonization strategy identified for the organic treatment showed an orientation toward a storage strategy, associated with the slow release of manure in soil and its persistence from one season to the next. The Av+ model presented the highest colonization potential, with an intense presence of vesicles. The mycorrhized/non-mycorrhized areas report presented homogenous colonization, with rare discontinuities between colonized areas. Contrary to this, the application of mineral fertilizers (V4) induced the regression of mycorrhizal colonization. The colonized areas presented an irregular pattern, with large uncolonized discontinuities between them. The observed strategy was generally oriented toward a plant-resistance one, with small areas where either a punctual storage or transfer strategy was visible. The comparative analysis between low-mineral organic (V3) and high-mineral organic (V5) treatments showed a continuous regression of colonization and shifts in colonization strategy, fitted between the two opposite treatments (V2 and V4). All the areas colonized developed irregularly around a central point, with a homogenous presence of non-colonized areas. The colonization strategy was oriented toward a proliferative-transfer one, with the presence of vesicles in limited areas. The largest non-colonized discontinuities were identified in the variant with a higher amount of mineral fertilizer (V5).
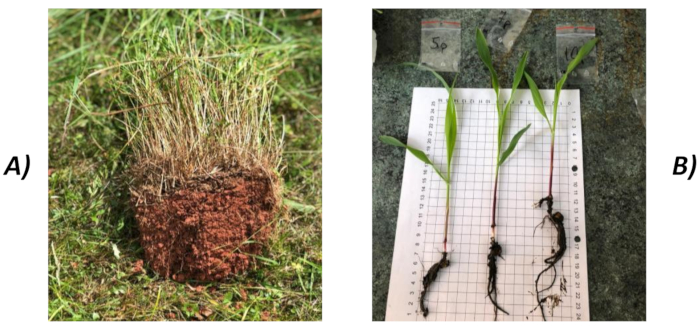
Figure 1: Root sampling procedures. (A) Extraction of samples with soil to protect the integrity of the roots. (B) Measurements of the root system after the first clearing procedure. Please click here to view a larger version of this figure.
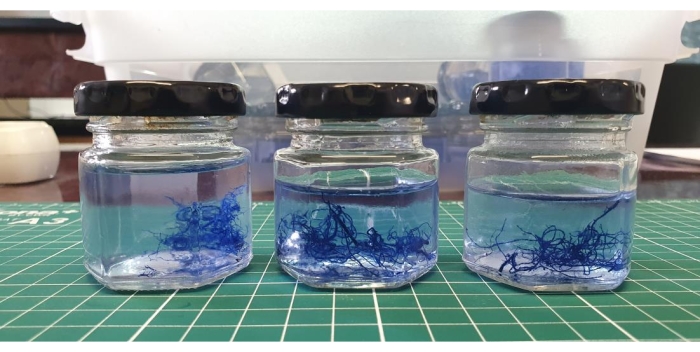
Figure 2: Stained roots maintained in a jar with tap water until processing. Roots maintain their color for up to 1 week at room temperature. Please click here to view a larger version of this figure.
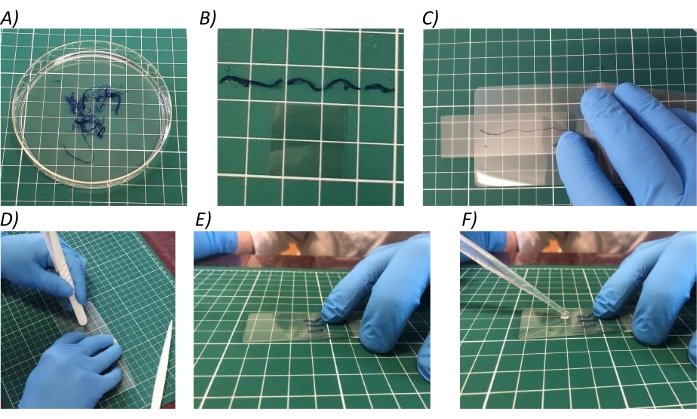
Figure 3: Root processing. (A) Keep all the roots from one sample in water in a Petri dish. (B) Cut the roots in segments of 1 cm length. (C-D) Gently press on the laminating pouch to crush the roots and slowly display them on a slide. (E-F) Cover the root segments with a coverslip and add one drop of tap water at one corner. Please click here to view a larger version of this figure.
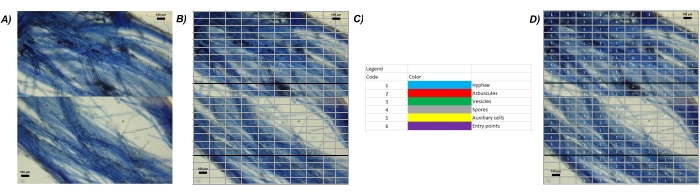
Figure 4: Image processing. (A) Add all the images captured from one sample in a presentation. Align all the images in order to reconstruct the microscopic view of each root. (B) Add a table to prepare the grid, with a width of 10 cells x 10 cells length for each image. Set the internal borders to none. The internal border will be still visible, but their transparency will not interfere with the mycorrhizal analysis. (C–D) Use the legend of MycoPatt to score each structure visible on the image. Please click here to view a larger version of this figure.
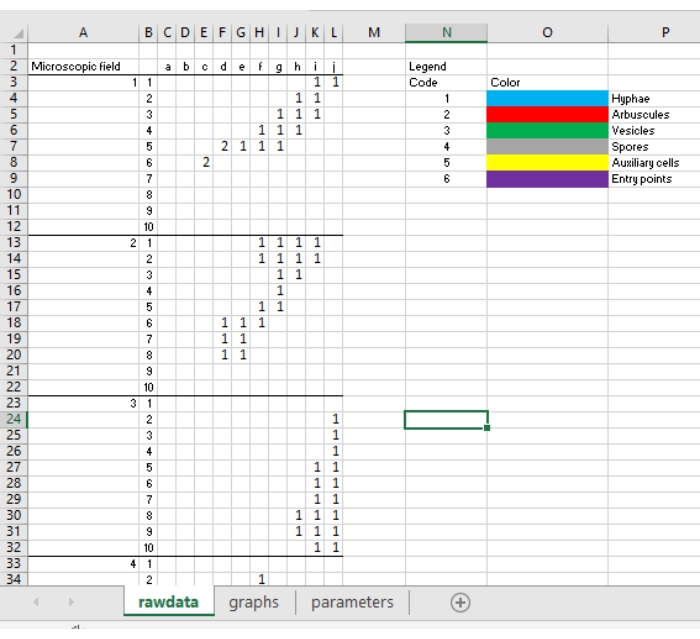
Figure 5: Insertion of data in MycoPatt. Copy the entire database with observations from the presentation to MycoPatt. Paste it as numbers. Please click here to view a larger version of this figure.
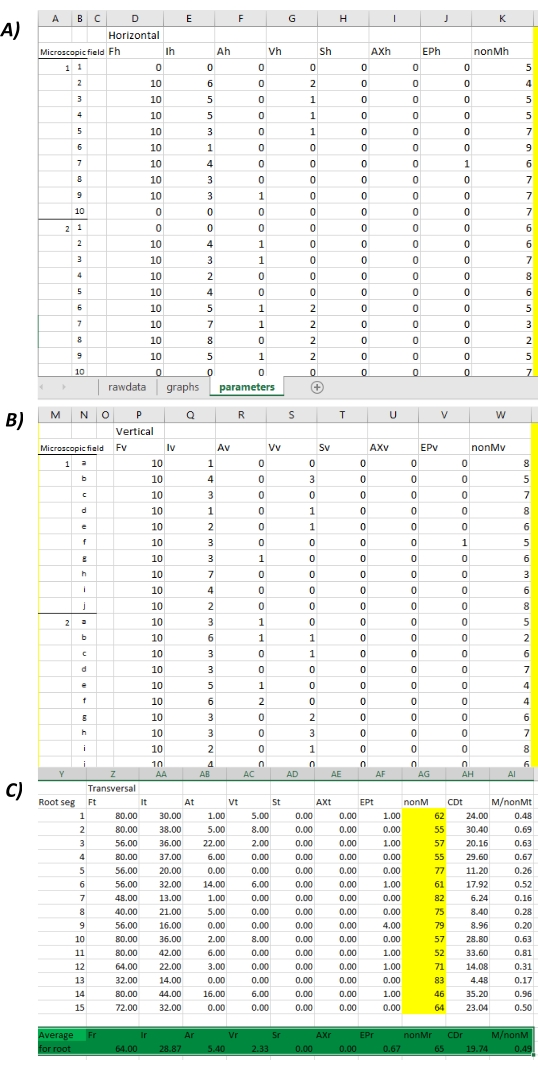
Figure 6: Raw data extraction and primary data analysis. (A) Colonization assessment for all 10 horizontal cells from one row. (B) Colonization assessment for all 10 cells from one column (vertical) in each of the 10 cells x 10 cells squares from MycoPatt. (C) Transversal colonization assessment and the calculation of average colonization parameters. Please click here to view a larger version of this figure.
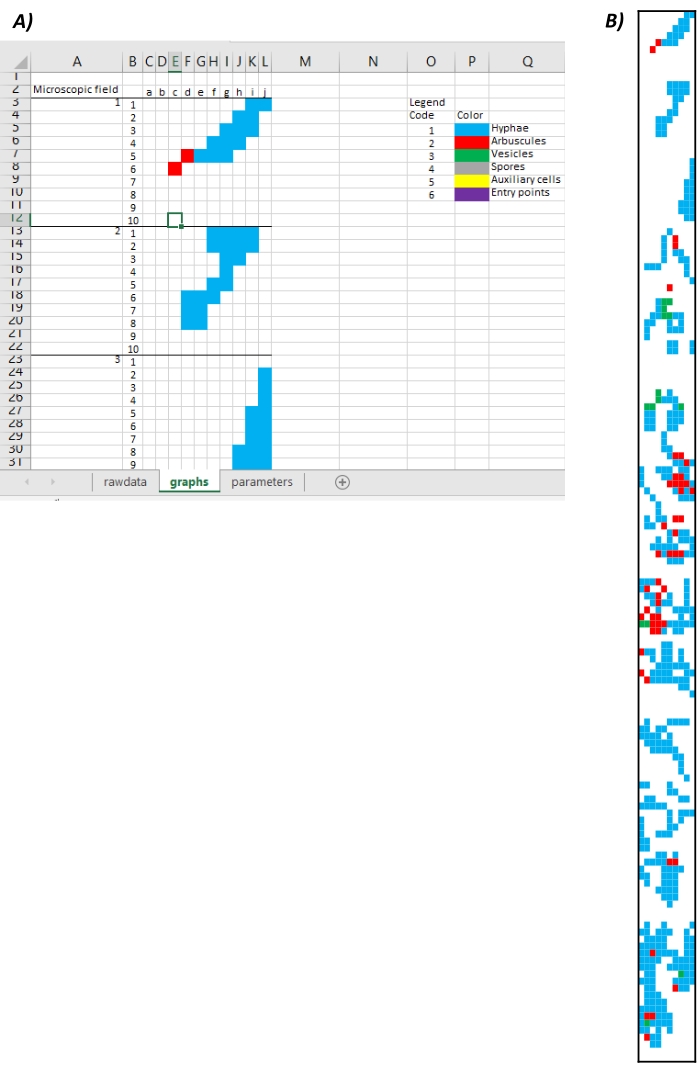
Figure 7: Extraction of mycorrhizal patterns maps. (A) For the entire data set, a large map of 10 cells x 150 cells is available in the graphs sheet of MycoPatt. (B) Extract the colonization map as an image. Please click here to view a larger version of this figure.
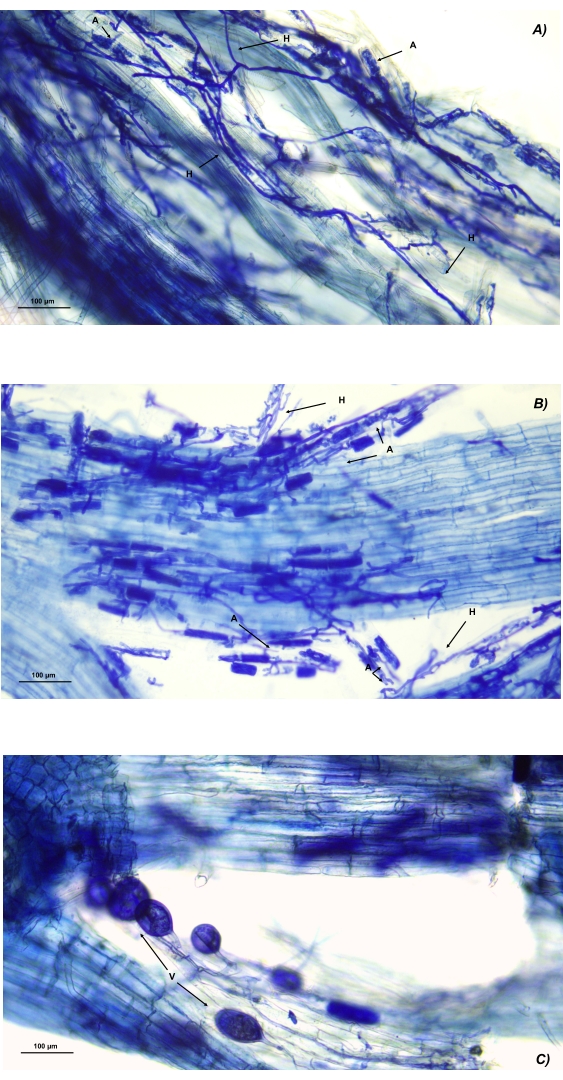
Figure 8: Microscopic images of AMF structures in processed roots of Zea mays. (A) Hyphal network intercellular and intracellular development of arbuscules. (B) Dense hyphal network with numerous arbuscules developing intracellularly. (C) Series of vesicles of different dimensions. Abbreviations: H = hyphae; A = arbuscules; V = vesicles. Please click here to view a larger version of this figure.
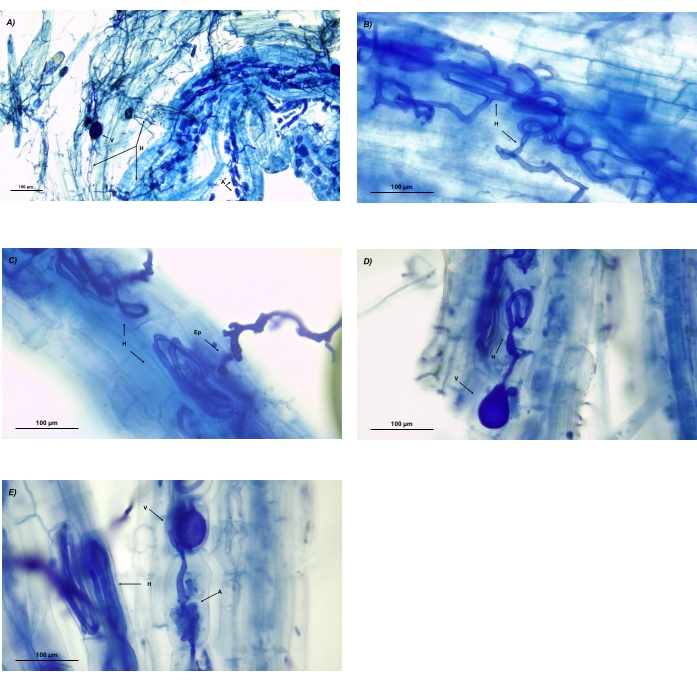
Figure 9: Microscopic images of AMF structures in processed roots of Festuca rubra. (A) Multiple hyphal networks with vesicles and arbuscules developed in separate areas. (B) Detail of a coiled hyphal network. (C) Detail of an entry point and two coiled hyphae. (D) Detail of a vesicle at the end of a coiled hypha. (E) Detail of an intracellular arbuscule, detail of a coiled hypha, and the presence of a vesicle at the end of a hypha. Abbreviations: H = hyphae; A = arbuscules; V = vesicles; Ep = entry points. Please click here to view a larger version of this figure.
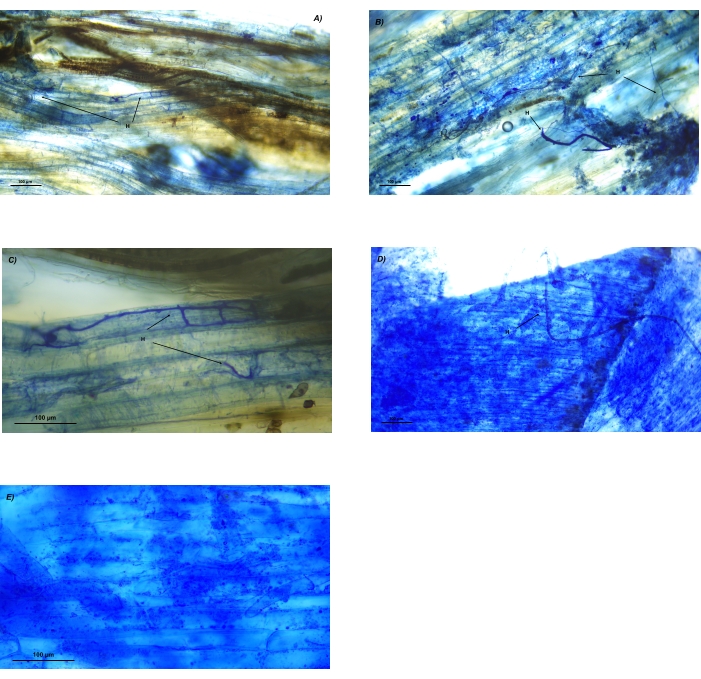
Figure 10: Unclear microscopic images of AMF structures in roots of Festuca rubra (A-C) and Zea mays (D-E) in incomplete cleared and stained roots. (A) Unclear stained root with a low number of hyphae visible and the native color of roots visible. (B) Hyphae of blue and intense blue color gradient with unclear distinction between the root cells and hyphae. (C) Clear stained hyphal network in the upper part of the image and incomplete stained hyphae in the lower part of the image. (D) Intense stained root and hyphae, which makes the identification of AM structures impossible. (E) Detail of an intense stained root with artifacts present in the cells, which makes the identification of AM structures impossible. Abbreviations: H = hyphae. Please click here to view a larger version of this figure.
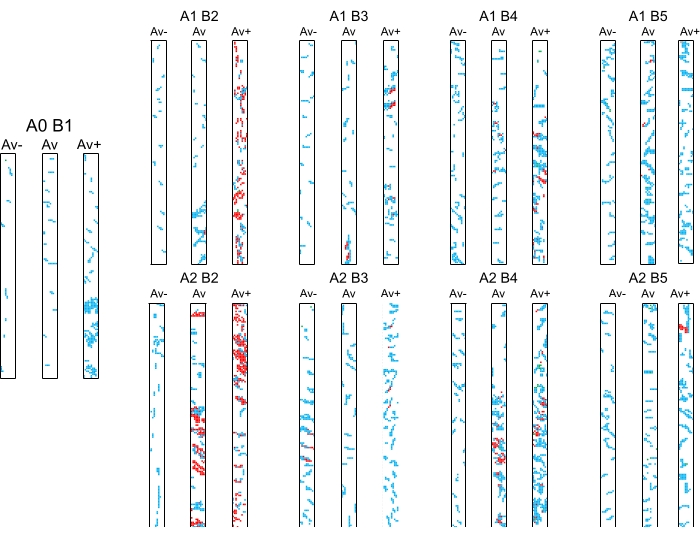
Figure 11: Mycorrhizal colonization patterns (Av, Av−, and Av+) in roots of treated Zea mays. Abbreviations: A0 = moment of treatment application; A1 = control variant (no treatment)/A2 = treated variant; B1 = 2-4 leaves (as a control point for the start of mycorrhizal colonization); B2 = 6 leaves; B3 = 8-10 leaves; B4 = cob formation; B5 = physiological maturity. Variant combinations are A0-B1; A1-B2/A2-B2; A1-B3/A2-B3; A1-B4/A2-B4; and A1B5/A2-B5. The full description of treatments can be found in Pop-Moldovan et al.12. Please click here to view a larger version of this figure.
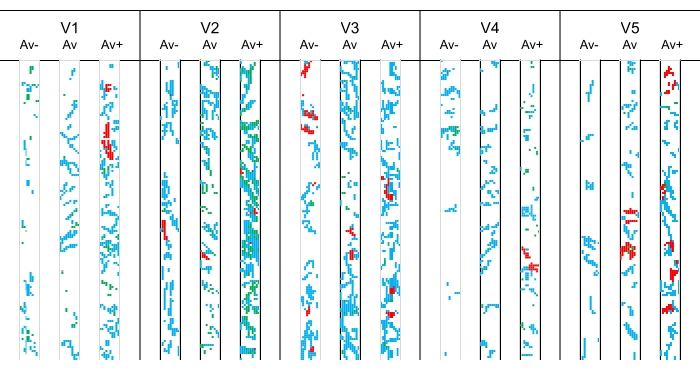
Figure 12: Mycorrhizal colonization patterns (Av, Av−, and Av+) in roots of long-term treated Festuca rubra. Abbreviations: V1 = control, non-fertilized; V2 = 10 t·ha−1 manure; V3 = 10 t·ha−1 manure + N 50 kg·ha-1, P2O5 25 kg·ha−1, K2O 25 kg·ha−1; V4 = N 100 kg·ha−1, P2O5 50 kg·ha−1, K2O 50 kg·ha−1; V5 = 10 t·ha−1 manure + N 100 kg·ha-1, P2O5 50 kg·ha−1, K2O 50 kg·ha−1. The full description of treatments can be found in previous work13,14. Please click here to view a larger version of this figure.
Table 1: Values of mycorrhizal colonization parameters in roots of Zea mays based on development stage. Legend: A0 = moment of treatment application; A1 = control variant (no treatment)/A2 = treated variant; B1 = 2-4 leaves (as a control point for the start of mycorrhizal colonization); B2 = 6 leaves; B3 = 8-10 leaves; B4 = cob formation; B5 = physiological maturity. Variant combinations are A0-B1; A1-B2/A2-B2; A1-B3/A2-B3; A1-B4/A2-B4; and A1B5/A2-B5. The full description of treatments can be found in Pop-Moldovan et al.12. Please click here to download this Table.
Table 2: Values of mycorrhizal colonization parameters in roots of Festuca rubra based on applied fertilization. Legend: V1 = control, non-fertilized; V2 = 10 t·ha−1 manure; V3 = 10 t·ha−1 manure + N 50 kg·ha-1, P2O5 25 kg·ha−1, K2O 25 kg·ha−1; V4 = N 100 kg·ha−1, P2O5 50 kg·ha−1 K2O 50 kg·ha−1; V5 = 10 t·ha−1 manure + N 100 kg·ha-1, P2O5 50 kg·ha−1 K2O 50 kg·ha−1. The full description of treatments can be found in previous work13,14. Please click here to download this Table.
Table 3: Detailed protocol steps from field sampling of roots to raw data analysis and mycorrhizal map extraction. Please click here to download this Table.
Studies on mycorrhizal colonization are vital for new strategy development in the agronomic field. The potential of multiple cultivated plants to form a symbiotic association with arbuscular mycorrhizas made them an important component of the agroecosystem's sustainable development and the maintenance of its health16,17,18,19,20. Thus, there is a need for a better understanding of the colonization mechanism and fungal strategies, which provide essential data on how a plant can connect with nutritional networks from the soil, its yield, and its survival potential. Therefore, in the smart agriculture context, this is a must-have of this century, it is vital to perform an in-depth assessment of colonization, and studies need to provide a realistic image of the fungal position in the roots.
The root mycorrhizal patterns method provides such a deep scan of the roots, but it comes with both limitations and advantages11. The limitations presented are the large number of samples that need to be scored when a plant is analyzed for the first time, the necessity for image manipulation, and the manual allocation of mycorrhizal structures in roots, but all of these can be overcome by multiple long-term benefits. The large database resulting from the application of this method and the integration of microscopy with the MycoPatt tool provides stability, statistical assurance of results, and perenniality in terms of results comparison. Mycorrhizal pattern identification for the roots of one specific plant will facilitate subsequent studies in terms of comparison. Also, it improves the identification of new patterns, which can provide information about the evolution of colonization mechanisms and fungal strategy. The calculation of average colonization parameters based on horizontal and vertical development permits the acquisition of more realistic and complex values compared to the visual estimation methods, like grid intersection, root segment estimation, and magnified intersection9,11. Overall, the mycorrhizal pattern method permits the assessment of fungal advance and branching in roots and the identification of new points of external colonization and the extension of hyphae along the roots. It permits the positioning of arbuscules and vesicles and allocates them a realistic position and dimension in the global pattern.
The correct application of the MycoPatt method relies on the successful completion of each step of the protocol (Table 3). For higher efficiency, the entire flow of the method is designed to be conducted by one or multiple persons with different training levels. In this way, multiple results are extracted from each step and continuous analysis is possible. For the selection of biological material, root sampling, and the storage step, it is necessary that a highly trained person correctly identifies the species, regardless of its growth stage. Once the species is identified, the root sampling can be done by any person, with minimal training for gentle soil particle removal. The second step, root processing, clearing, and staining for microscopy, requires trained persons; the process has multiple verification steps, and each step is necessary for the success of the procedure. Multiple samples can be processed at the same time in the first two steps. Root processing for microscopy (step 3) and the microscopic analysis of root samples (step 4) are very important due to the high attention required for cutting the segments into 1 cm pieces combined with their gentle crushing for slide preparation. Microscopy needs attention for the calibration of light and the software to obtain high-quality images. Both steps require highly trained persons or medium trained ones under the supervision of an expert. Post-microscopy image assemblage requires highly trained personnel for the correct overlap and order of images to reconstruct the segment. Scoring of mycorrhizal colonization is a step that requires a specialist in AM fungi to identify their structures and colonization performance, as well as to allocate scores for each structure on gridded images. The last step, raw data analysis, and result extraction require a highly trained data analyst who compiles the databases and manages the statistics behind data filtering and the extraction of the most relevant maps. This step can be combined with the work of the mycorrhizal specialist for maximum efficiency of the process. Overall, the entire flow allows the involvement of multiple specialists within an interdisciplinary study, which leads to high-quality results.
Like any new method, the mycorrhizal pattern method needs to evolve and improve. There are some modifications that, in the future, will make this method easier to use and provide multiple results. If it is done by the slow clearing and staining technique, this method allows the manipulation of multiple samples at a time to pause/restart the analysis after each step of the procedure and obtain multiple digital databases. An important improvement will be the use of performant scanners for faster image acquisition and, after the development of suitable and efficient tools for mycorrhizal structure recognition, the automatization of this process. In the context of technique evolution, quick acquisition of mycorrhizal patterns will sustain future studies in the field.
There are several difficulties in the use of automatic software. 1) Due to the different positions of AM structures – hyphae and vesicles – outside the root cells and arbuscules inside the root cells, it is difficult to calibrate and train software to recognize them in the same picture. 2) For the assemblage of the pictures from one segment, the software will not always align the pictures to recreate the segment, and it is possible that it may place them randomly, which will alter the process. 3) Another problem is that software cannot discriminate if some parts of two pictures are identical or if, in the microscopy procedures, some fields were overlapped. Thus, the process requires to be carried out manually by trained experts.
Overall, 60 cm of root from each variant was analyzed from multiple plants. The current manuscript is designed to present the concept of using the MycoPatt system and tool, and the results present the functionality of this method. Compared to this method, the grid intersection method has higher subjectivity due to the random placement of stained roots. We believe that it will be necessary for the future to establish for each AM plant the number of segments to be used. This is research that needs to be done by all the researchers in the field of mycorrhizas. One of the articles that compared multiple methods9 presented a similar colonization rate of 50 up to 200 root segments/plant. Their conclusions stated that a more objective method is needed to analyze each segment. Based on our research, MycoPatt reduces the subjectivity to 0. Each segment is scanned and analyzed in depth. Also, an image database for all analyzed segment results can be developed using this method. This can also be used for reanalyzing the data if needed.
The entire method provides results that are necessary for multiple research and commercial fields. Plant breeders try constantly to create more resistant varieties and hybrids that adapt to specific soil conditions. In this context, plant breeding processes will benefit in terms of plant connectivity to mycorrhizal networks from the soil from the initial selection stages. Mycorrhizal pattern analysis will show the differences between hybrids in terms of mycorrhizal harvesting from soil and acclimation to site conditions. Researchers in the breeding field can use this method to detect, even from the early stages of the selection processes, the suitability of new varieties/hybrids for soil mycorrhizal conditions. In this way, there will be varieties/hybrids that adapt easily to a large number of conditions and technologies but also varieties/hybrids with lower acceptance and high specificity for narrow conditions. For grassland ecosystems, the mycorrhizal pattern method will fit perfectly for multiple applications: a better understanding of plant survival in diverse vegetation assemblages related to fungal support; the analysis of specific colonization patterns in endemic and endangered species; the invasive potential of exogenous species; and the dominance-codominance fluctuations due to the application of various inputs21. The patterns can be further used by inoculum producers that need to calculate the potential doses based on active propagules and entry points. Also, highly specific biofertilizers can be developed that will contain suitable inoculum for plants that share the same genitors. In research, mycorrhizal patterns represent a highly comparative study, both from a visual and numeric point of view. There are multiple databases22,23,24 that present mycorrhizal species and the structures they can develop in the roots of tester plants, but none of them, to date, present the full colonization image. All of these requirements and the need for more realistic and applicative studies support the integration of the mycorrhizal patterns method in soil-microbe-plant interaction studies.
The authors have nothing to disclose.
This paper uses data resulting from two Ph.D. studies in the thematic area of "Corn Mycorrhizal Patterns Driven by Agronomic Inputs", conducted by Victoria Pop-Moldovan, and "Mycorrhizal Status and Development of Colonization in Mountain Grassland Dominant Species", conducted by Larisa Corcoz, under the coordination of Prof. Dr. Roxana Vidican.
Apple vinegar 5% | FABRICA DE CONSERVE RAURENI S.R.L. | OȚET DE MERE | https://www.raureni.ro/ro-ro/produs/otet-de-mere |
Blue Ink | Pelikan | 4001 | https://www.pelikan.com/pulse/Pulsar/ro_RO.Store.displayStore.224848./cerneal%C4%83-4001-de-la-pelikan |
Cover slips | Menzel-Glaser | D 263 M | https://si.vwr.com/store/product/20545757/cover-glasses-menzel-glaser |
Forceps, PMP | Vitalab | 9.171 411 | http://shop.llg.de/info881_Forceps_PMP_lang_UK. htm?UID=55005bf838d8000000000000 &OFS=33 |
Glass jar 47 mL | Indigo Cards | BORCAN 47 ML HEXAGONAL | https://indigo.com.ro/borcan-47-ml-hexagonal |
Laminating Pouches | Peach | PP525-08 | Business Card (60x90mm) / https://supremoffice.ro/folie-laminare-60x90mm-125mic-carte-vizita-100-top-peach-pp525-08-510328 |
Microflow Class II ABS Cabinet | Bioquell UK Ltd | Microflow Class II ABS Cabinet | http://www.laboratoryanalysis.co.uk/graphics/products/034_11%20CLASS%202BSC%20(STD).pdf |
Microscope slides | Deltalab | D100001 | https://distrimed.ro/lame-microscop-matuite-la-un-capat-26×76-mm-deltalab/?utm_source=Google%20Shopping&utm_campaign= google%20shopping%20distrimed&utm_medium=cpc& utm_term=1647&gclid=CjwKCAjwu YWSBhByEiwAKd_n_odzr8CaCXQ hl9VQkAB3p-ODo2Ssuou9cnoRtz1Gb xsjqPY7F05HmhoCj6oQAvD_BwE |
Microsoft Office 365 | Microsoft | Office 365 | Excel and Powerpoint; spreadsheet and presentation |
NaOH | Oltchim | 01-2119457892-27-0065 | http://www.sodacaustica.com.ro/pdf/fisa-tehnica-soda-caustica.pdf |
Nitrile gloves | SemperGuard | 816780637 | https://www.sigmaaldrich.com/RO/en/product/aldrich/816780637?gclid=CjwKCAjwuYWSBhByEiwAKd _n_rmo4RRt8zBql7ul8ox AAYhwhxuXHWZcw4hlR x0Iro_4IyVt69aFHRoCmd wQAvD_BwE |
Optika camera | OPTIKA | CP-8; P8 Pro Camera, 8.3 MP CMOS, USB 3.0 | https://www.optikamicroscopes.com/optikamicroscopes/product/c-p-series/ |
Optika Microscope | OPTIKA | B383pL | https://www.optikamicroscopes.com/optikamicroscopes/product/b-380-series/ |
Protective mask FFP3 | Hermes Gift | HERMES000100 | EN 149-2001+A1:2009 / https://www.emag.ro/set-10-masti-de-protectie-respiratorie-hermes-gift-ffp3-5-straturi-albe-hermes000100/pd/DTZ8CXMBM/#specification-section |
Scalpel | Cutfix | 9409814 | https://shop.thgeyer-lab.com/erp/catalog/search/search.action;jsessionid=C258CA 663588CD1CBE65BF 100F85241B?model.query=9409809 |
White wine vinegar 9% | FABRICA DE CONSERVE RAURENI S.R.L. | OȚET DE VIN ALB | https://www.raureni.ro/ro-ro/produs/otet-de-vin-alb |