Correlative Light- and Electron Microscopy Using Quantum Dot Nanoparticles
Summary
A method is described whereby quantum dot (QD) nanoparticles can be used for correlative immunocytochemical studies of epoxy embedded human pathology tissue. We employ commercial antibody fragment conjugated QDs that are visualized by widefield fluorescence light microscopy and transmission electron microscopy.
Abstract
A method is described whereby quantum dot (QD) nanoparticles can be used for correlative immunocytochemical studies of human pathology tissue using widefield fluorescence light microscopy and transmission electron microscopy (TEM). To demonstrate the protocol we have immunolabeled ultrathin epoxy sections of human somatostatinoma tumor using a primary antibody to somatostatin, followed by a biotinylated secondary antibody and visualization with streptavidin conjugated 585 nm cadmium-selenium (CdSe) quantum dots (QDs). The sections are mounted on a TEM specimen grid then placed on a glass slide for observation by widefield fluorescence light microscopy. Light microscopy reveals 585 nm QD labeling as bright orange fluorescence forming a granular pattern within the tumor cell cytoplasm. At low to mid-range magnification by light microscopy the labeling pattern can be easily recognized and the level of non-specific or background labeling assessed. This is a critical step for subsequent interpretation of the immunolabeling pattern by TEM and evaluation of the morphological context. The same section is then blotted dry and viewed by TEM. QD probes are seen to be attached to amorphous material contained in individual secretory granules. Images are acquired from the same region of interest (ROI) seen by light microscopy for correlative analysis. Corresponding images from each modality may then be blended to overlay fluorescence data on TEM ultrastructure of the corresponding region.
Introduction
Correlative light- and electron microscopy (CLEM) is a powerful approach for the analysis of transient dynamic events1, rare events2, 3 and complex systems4. There are many different technical permutations available5 depending on the question being asked however a common requirement is that the same structure in a single sample6 is imaged by multiple microscopy modalities. Our particular approach to CLEM was developed for the study of archival human pathology tissue and the case used here has been well characterized and published previously7. The aim was firstly, to maximize the analytical data from a single biopsy or surgical sample and secondly, to use fluorescence light microscopy to help clarify the context of the immunocytochemical labeling pattern seen at the ultrastructural level.
Quantum dot nanocrystals (QDs) offer the potential of a universal marker system able to be viewed by both, fluorescence light microscopy and electron microscopy8, 9, 10. Their crystalline core structure allows QDs of different sizes to generate a wide range of fluorescence emission peaks when excited by light at wavelengths far from their emission spectra11. Their atomic weight is sufficient to yield electron density that is detectable by transmission electron microscopy, scanning transmission electron microscopy (STEM) or field emission scanning electron microscopy. They are particularly suited to immunocytochemical studies as even single QDs may be observed giving an ultimate sensitivity of one QD per target molecule12. Furthermore, depending on the QD used they can possess an individual elemental signature suitable for mapping.
Human pathology samples offer significant benefits for translational biomedical research. Surgical tissue and biopsy samples are routinely submitted for biobanking and with appropriate ethics clearances can be accessed for research studies. Human tissue does not have issues of relevance or interpretation that can occur in animal or in vitro models of disease. However, specimen preparation of pathology samples often is not optimal. There can be delay in tissue being placed in fixative, inappropriate fixative used such as formalin rather than glutaraldehyde for TEM and inappropriate sampling. CLEM methods have the potential to optimize the diagnostic and prognostic information available from a single human sample. However, some newly developed correlative approaches such as those employing mini Singlet Oxygen Generator (miniSOG) are not available for use in pathology due to the need for the tag to be genetically encoded into the cell of interest13. For this reason we have explored the utility of QD labeling of routinely prepared TEM tissue for correlative immunocytochemical studies. QDs applied to etched epoxy or acrylic resin sections from lightly aldehyde fixed biopsy and tissue samples offer the possibility of obtaining correlative fluorescence light microscopy and TEM data from a single sample.
Protocol
1. Tissue Dissection and Fixation
- Tissue Dissection
- Dissect tissue pieces from a surgically resected tumor specimen or tissue biopsy.
Note: The tissue used in this study was routinely fixed in formalin but fresh tissue is also suitable. We selected an area confirmed and reported by an anatomical pathologist to contain somatostatinoma tumor after routine histological staining and anti-somatostatin immunostaining (not shown). - Use tissue pieces no larger than approximately 1.0 mm3.
- Dissect tissue pieces from a surgically resected tumor specimen or tissue biopsy.
- Cacodylate Buffer Preparation
- Prepare a stock buffer solution (1 M) by adding 21.4 g of sodium cacodylate (see Materials List) and 3.0 ml of 1% calcium chloride solution to 90 ml of distilled water and then topping up the solution to a final volume of 100 ml. Stir the solution and leave it to stand overnight so that the crystalline reagent fully dissolves.
- Prepare a buffer working solution by adding 20 ml of stock solution to 170 ml of water and then checking the pH with indicator strips. Adjust the pH to 7.4 by the addition of 3 – 4 drops of 3% HCl. Top up the solution to a final volume of 200 ml with final molarity of 0.1 M.
- Fixative Preparation and Use
- Add one 10 ml ampoule of 50% glutaraldehyde solution to 20 ml of sodium cacodylate stock solution (1 M). Top up with distilled water to 190 ml. Check the pH and adjust to 7.4 by adding 1 – 4 drops of 3% hydrochloric acid (HCl) if necessary.
- Top up with distilled water to make a final volume of 200 ml.
- Immerse the tissue in fixative containing 2.5% glutaraldehyde in 0.1 M sodium cacodylate buffer pH 7.4 for 24 hr at 4 oC in a glass sample tube. Discard unused fixative after 1 week.
2. Tissue Processing and Embedding
- Osmium Tetroxide Staining
- After fixation is complete, immerse the tissue in sodium cacodylate buffer (0.1 M) for 20 min then repeat for another 20 min.
- Prepare a 2% aqueous osmium tetroxide (OsO4) working solution by adding 8.0 ml of a 5% OsO4 stock solution to 2.0 ml of sodium cacodylate buffer stock solution (1 M) and 10.0 ml of distilled water to make a final volume of 20.0 ml.
- Remove the buffer then immerse the tissue in 2% OsO4 at pH 7.4 for 4 hr at room temperature.
CAUTION! Use caution when decanting and preparing OsO4 solutions, wear appropriate personal protective equipment and work in a fume hood at all times.
- Uranyl Acetate Staining
- After tissue osmication is complete, remove the OsO4 solution and immerse tissue in 2% sodium acetate for 10 min. Remove 2% sodium acetate then immerse in 2% uranyl acetate for 1 hr at room temperature.
- Dehydration
- Dehydrate tissue through graded alcohols. Use 50% ethanol for 10 mins, 70% ethanol for 10 min, 95% ethanol for 10 min and two changes of 100% ethanol for 20 min each at room temperature.
- Perform two changes of 100% acetone for 30 min each.
- Resin Impregnation and Curing
- Mix low-viscosity epoxy resin in a disposable polyethylene cup. Add 10.0 g of vinyl cyclohexene dioxide (ERL 4221) epoxy monomer, 6 g of diglycidyl ether of polypropylene glycol (DER 732) and 26.0 g of nonenyl succinic anhydride (NSA). Stir thoroughly by hand using wooden sticks for 2 min.
- Add fifteen drops of 2-dimethylaminoethanol (DMAE) epoxy accelerator and stir again for 2 min. Take care to fully mix the ERL, DER and NSA components before adding the DMAE accelerator.
- Start resin impregnation of the tissue by replacing 100% acetone with 1:1 resin to acetone for 1 hr, then replace with 6:1 resin to acetone for 3 hr, and finally 100% resin overnight.
- Transfer the tissue into fresh resin in 8 mm micromoulds. Cure at 70 oC overnight. Resin should be hard but not brittle after curing.
3. Ultramicrotomy
- Knife, Cutting Parameters and Section Thickness
- Place a semithin diamond knife in the ultramicrotome and cut sections from the tissue at a thickness of 500 nm.
- Float sections onto the water bath behind the knife edge. Pick up the sections on a glass slide and dry them down for 10 to 20 sec using a hotplate at approximately 110 oC.
- Etch the sections with sodium ethoxide solution for 20 sec and then wash off with 100% ethanol then distilled water. Stain with 2% methylene blue in 1% borax for 20 sec on the hotplate, rinse with running tap water for 5 sec and dry on the hotplate for 5 sec. Then stain with 1.5% basic fuchsin on the hotplate for 5 sec then dry on the hotplate for 20 sec.
- Examine by bright-field light microscopy and confirm that tumor cells and a region of interest (ROI) are present in the section.
- Change the semithin diamond knife to an ultrathin diamond knife and set the correct knife angle and cutting speed as recommended by the knife manufacturer.
- Cut ultrathin sections at 90 nm thickness. Observe the gold coloration of the sections when floating on the water bath.
- Stretch and flatten the sections by waving chloroform vapor from a 1 cm2 piece of filter paper within a few millimeters of the sections. Take care not to bring the chloroform soaked paper into contact with the water surface.
- Ultrathin Section Grid Mounting
- Lift up the ultrathin sections from the water surface using a 300-mesh thin-bar nickel TEM grid that has been dipped in section adhesive solution. Locate the sections on the dull side of the grid. The grids have a dull or matt surface on one side and a polished or shiny surface on the other side. No support film is required. Note: It is necessary to handle these grids with anti-magnetic forceps to avoid grids sticking to the forceps.
- Prepare the section adhesive by placing 20 cm of clear adhesive tape in a 5 ml vial with 2.0 ml of acetone. Cap and shake the vial, let stand for 10 min then remove the tape leaving the adhesive solution.
4. Immunolabeling
- Antigen Unmasking
- Prepare 1 ml of fresh saturated sodium metaperiodate etching solution in distilled water and use it immediately. Place droplets of the etching solution on a clean labfilm surface.
- Place completely dry grids with sections down on droplets of sodium metaperiodate solution at room temperature for 30 min. Transfer the grids to distilled water droplets for 60 sec of washing.
- Antibody Incubation and QD Probe Labeling
- Perform all incubations and labeling on droplets of solution placed on a clean Parafilm surface.
- Place the grid on a droplet of 0.05 M glycine in PBS for 10 min to block residual aldehyde in the section. Remove the aldehyde block by briefly blotting the edge of the grid.
- Place the grid on a droplet of 1% normal goat serum (NGS) and 1% BSAc (10%) in PBS for 10 min. Prepare the blocking solution by adding 10 μl of NGS and 100 μl of BSAc to 890 μl of PBS to give a final volume of 1,000 μl.
- Condition the sections by placing on a droplet of antibody diluent for 10 min.
- Perform the immunolabeling incubation using anti-somatostatin polyclonal antibody diluted 1:10 with antibody diluent giving a concentration of 3.47 g/L. Note: Antibody incubation is done by placing grids on droplets for 1 hr at room temperature in a moist chamber.
- Remove antibody reagent from step 4.2.5 by blotting the edge of the grid then wash sections on diluent for 2 x 5 min.
- Incubate in secondary antibody (biotinylated goat anti-rabbit polyclonal) diluted 1:10 for 1 hr at room temperature. Remove the secondary antibody solution. Wash in diluent for 2 x 5 min.
- Incubate in streptavidin conjugated QDs (585 nm) diluted 1:10 for 1 hr at room temperature. Cover with aluminum foil to reduce light exposure during the incubation.
- Wash grids in fresh distilled water for 2 min. Blot the edges of the grid dry.
5. Fluorescence Light Microscopy
- Light Source and Filter Cubes
- Use 365 nm light emitting diode (LED) illumination for wide-field fluorescence light microscopy. Insert a filter cube with the following characteristics: (Ex G 365 nm, BS FT 395 and EM LP 420 nm).
Note: This filter cube will permit the emission spectra of all QDs sizes to be visualized simultaneously under the same excitation wavelength.
- Use 365 nm light emitting diode (LED) illumination for wide-field fluorescence light microscopy. Insert a filter cube with the following characteristics: (Ex G 365 nm, BS FT 395 and EM LP 420 nm).
- Viewing and Imaging Sections
- Place the immunostained grid section down on a glass slide in a droplet of water and cover with a glass cover slip (thickness number 1.5). Use light microscopy to evaluate the labeling pattern, the level of any non-specific labeling and to establish that negative controls are clear of labeling.
- Identify ROI in relation to grid bars. Finder grids may be helpful for establishing co-ordinates of target structures.
- Acquire images of positive labeling on the section using a full color digital camera with the camera setting at "FL auto colour" and "White Balance" set at 3,200K. Use the camera in "Automatic exposure" mode with a "Gamma" setting between 0.45 and 1.00 to optimize the appearance of the images and "Analog Gain" set at 1x. Click the camera icon in the Zen 2 Lite software graphical interface to "Live", focus the image then click "Snap" to capture the image to the framestore.
- Save images as .tif files to avoid compression and pixelation becoming apparent.
- Prepare a print showing the position of the ROI in relation to the grid bars or other significant tissue landmarks. These prints will be useful for subsequent navigation of the section and re-finding ROIs by transmission electron microscopy (TEM).
- Remove the grid from the slide, wash in distilled water and gently blot the edges dry.
Note: Do not use overly intense illumination to acquire fluorescence images. The photostability of QDs allows imaging times of up to a few seconds but take care not to prolong exposure as quenching of the QD signal can occur after approximately 1 min in water. Extended or permanent photostability is only obtained when QD labeled sections are dehydrated with toluene and embedded under coverslips as per the manufacturers specifications. However, this process will then exclude the possibility of correlative examination of the same section by TEM.
6. Transmission Electron Microscopy
- TEM Set Up and Viewing
- Transfer the grid to the TEM for examination using an accelerating voltage of 100 kV. Use low magnification of approximately 1,400X to navigate around the grid and find ROIs that correlate with the light microscopy views. View clusters of QDs at magnifications around 50,000X.
- Observe individual QDs at 70,000X magnification or above. Observe the QDs as irregular crystalline structures with moderate electron density.
- Imaging
- Use a digital camera for TEM imaging. A monochrome 1,392 x 1,040 pixel sensor is adequate.
- Acquire images by clicking the "Camera" icon to "On" in the microscope graphical interface of the imaging software, then to "Off" to store the image in the framestore. Note: these operations will differ depending on the microscope system being used. Use the camera in automatic exposure mode with a "Gamma" setting of 1.00.
- Save images as .tif files.
7. CLEM Imaging
- Locating a Fluorescence ROI by TEM
- Use a print from the light microscopy image to locate corresponding ROIs by TEM. Tissue architectural features such as blood vessels and luminal structures are useful for navigation around the section using TEM.
- Capture an image of the corresponding ROI by TEM.
- CLEM Image Overlay
- Make sure the TEM image is correctly orientated with the light microscopy image and correct the enlargement of each so that the same structure seen in each modality is the same size.
- Orientate the light microscopy and TEM images and display them side-by-side or as overlays to highlight the ultrastructural features of immunolabeled ROIs.
- Create an overlay image using Photoshop CS2. First, enlarge the fluorescence image to the same magnification as a low power TEM image. Orientate both images and then paste them side by side on one canvas.
- Flatten the image.
- Create the fluorescence overlay from this composite image. Click on the "Rectangular Marquee Tool", select the fluorescence image and create a duplicate layer from it.
- Adjust the "Layer Style/Blending options" to 30 – 40% transparency.
- Click on the "Move Tool" and drag the fluorescence overlay layer over the corresponding TEM image. Align the images.
- After achieving the alignment, "Flatten" the layers to produce the final overlay image.
- Use the "Rectangular Marquee Tool" to select the new overlay image and copy it to a new canvas. Save this as a .tiff file.
Representative Results
The somatostatinoma tumor specimen used for this study comprised tumor cells forming ductal structures mixed with collagenous stomal tissue. By fluorescence light microscopy, individual tumor cells that contained abundant secretory granules showed positive labeling for the somatostatin hormone. Nuclei appeared as dark holes with minimal non-specific labeling detectable (Figure 1). At low magnifications, variably intense granular orange fluorescence was seen in the cytoplasm of these well characterized tumor cells. The orange color of fluorescence was determined by the size of QD used. For this study we used 585 nm QDs which emit an orange signal when excited with 365 nm light.
CLEM analysis of the same cell was possible (Figure 2). Using the same grid as viewed by light microscopy for TEM examination allowed ROIs to be recognized and imaged in both modalities. The same tissue architecture in relation to grid bars as seen by light microscopy was observed by TEM and used for navigation. The ROI was found by referring to a 20X light microscopy image and noting tissue features in relation to grid bars.
TEM showed the cytoplasm of the somatostatin positive cells to contain abundant round granules of varying electron density. Granules of various diameters were present in individual cells and QD immunolabeling density over the granules was also variable. The overlaying of fluorescence data on TEM images suggested strong positive labeling corresponded to granules containing moderately electron dense material within the vesicle limiting membrane (Figure 3).
At higher magnification the moderately electron dense granules could be seen to be intensely immunolabeled with QD nanocrystals (Figure 4).
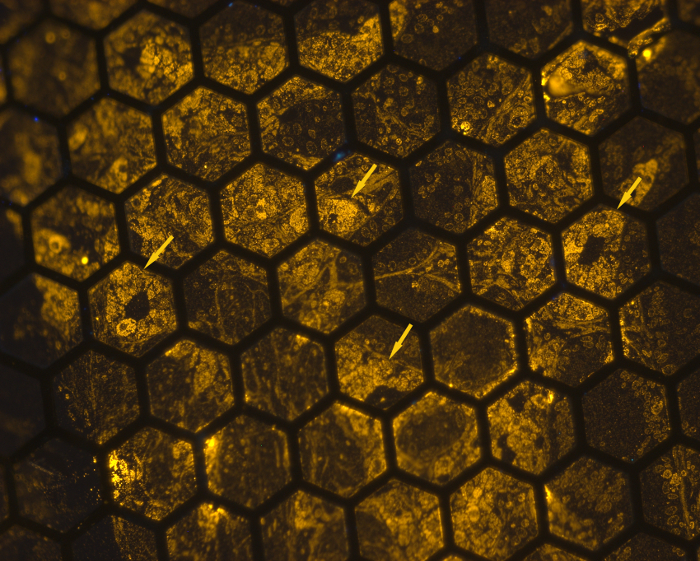
Figure 1: Light Microscopy View of an Ultra-thin Section with Somatostatinoma Cells Labeled for Somatostatin Hormone. The ultrathin section was mounted on a TEM grid, immunolabeled, then placed on a glass slide in water under a coverslip. Somatostatinoma cells (arrows) show round nuclei and abundant somatostatin hormone positive granules in the cytoplasm. Considerable variation in labeling density is seen in the somatostatinoma cell population (200X). Please click here to view a larger version of this figure.
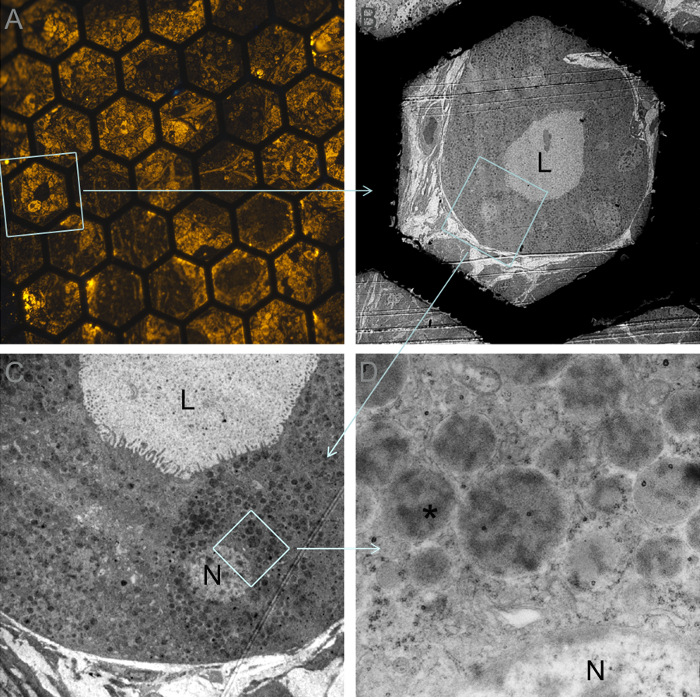
Figure 2: CLEM Composite View from an Ultrathin Section Through Somatostatinoma Tissue Labeled for Somatostatin. A) Somatostatinoma cells by widefield fluorescence microscopy (120X); B) Same cells surrounding a lumen (L) seen by TEM at low magnification (570X); C) Higher power TEM view showing brightly fluorescent cell from (A) with nucleus (N) (2,000X); D) Detail of cytoplasmic granules showing intense labeling with QDs over the amorphous material contained within the granule (asterisk) (20,000X). Please click here to view a larger version of this figure.
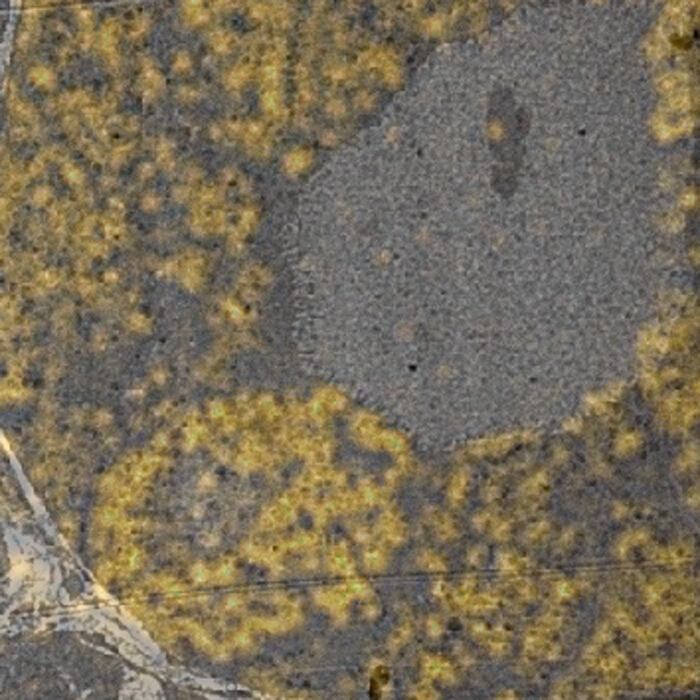
Figure 3: CLEM Overlay Image. A transparent image from fluorescence microscopy blended with a TEM image of the corresponding area (2,000X). Please click here to view a larger version of this figure.
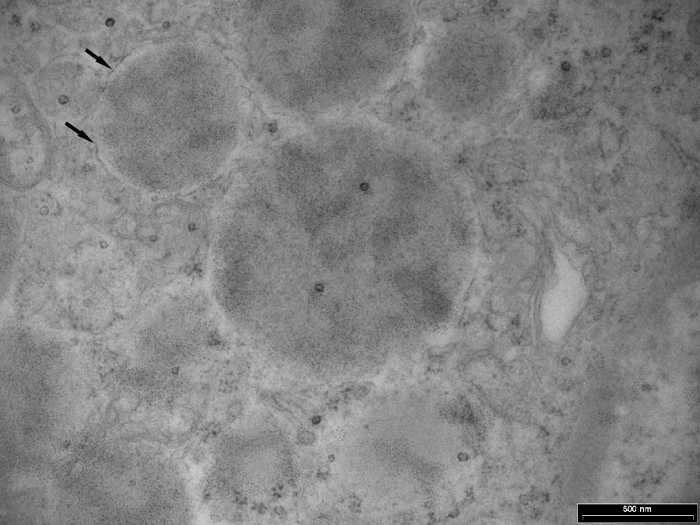
Figure 4: Transmission Electron Microscopy (TEM) View of Somatostatin Positive Granules from Somatostatinoma Cell Cytoplasm. Somatostatin hormone positive granules in the cytoplasm (arrows) show QD localization over the amorphous contents largely within the limiting membrane. Surrounding cytoplasmic background is clean with few QD probes evident. Some non-specific nuclear labeling is seen. The vesicle membrane surrounding the granules (arrows) is still visible (50,000X). Please click here to view a larger version of this figure.
Discussion
This study has demonstrated the potential utility of QDs as universal probes for CLEM studies. The 585 nm QD nanoparticles used showed bright and stable fluorescence when viewed by widefield light microscopy and were readily observed by TEM. A previous study by one of the present authors has shown QDs also to be suitable for super-resolution light microscopy7. Their photostability was particularly useful for extended viewing periods and long imaging exposures. QDs can also be used for multiplex immunohistochemistry with different sized probes simultaneously emitting different colored spectra under the same excitation wavelength.
QDs possess sufficient atomic weight to be visualized by TEM but this was found to be challenging depending on the size of the nanoparticle used. For light microscopy, we have found that 525 nm QDs (green) produce less background labeling compared to the larger 585 nm (orange) and 655 nm (red) forms. However, we chose to use the larger 585 nm QD in the present study to enable more convenient visualization of the labeling by TEM. The smaller 525 nm QDs are sized approximately 3 – 5 nm whereas the larger 585 nm forms are approximately 6 – 8 nm and the 655 nm QDs approximately 8 – 10 nm. The 585 nm QDs possessed an irregular crystalline shape with moderate electron density when viewed by TEM. They were not as round or as electron dense as the more traditional colloidal gold immunocytochemical probes. However, QDs have been shown to yield up to 10X more efficient labeling than colloidal gold9 and we have confirmed here that a high labeling density was readily achievable, particularly with the biotin-streptavidin probe linking system. CdSe QDs also possess a characteristic elemental signature that may allow detection and mapping using energy dispersive spectroscopy (EDS), electron energy loss spectroscopy (EELS) or energy filtered transmission electron microscopy (EFTEM)8. Scanning transmission electron microscopy (STEM) systems can also be employed due their exploitation of Z-contrast or atomic number imaging which would enhance contrast between nanoparticles and biological material of lower atomic number14. Large area mapping and visualization of 3D distribution information15 with field emission scanning electron microscopy should also be possible.
A critical step in our method is the antigen unmasking or section etching procedure. We use a single treatment with sodium metaperiodate for 30 min at room temperature. Longer than this and aggregation of structures or loss of membrane definition can occur. Others have used a two-step method involving deplasticizing with sodium methoxide followed by de-osmication with sodium periodate and this may provide more control over the process if necessary16.
CLEM was possible by using light microscopy to carefully log the structural features of ROIs in relation to grid bars. The same grid is then placed in the TEM and orientated so that the grid bars and landmarks correspond to the light microscopy view. A low magnification of approximately 1,400X is most suitable for this. Tissue structures such as ductal formations and patterns of nuclei proved to be most useful for re-finding ROIs in the tissue. However, accurate correlation with same cell resolution can be challenging. Care had to be taken with orientation of the grid to reflect the same orientation seen by light microscopy. We have achieved reasonably accurate subcellular spatial correlation between modalities with overlay images produced using Photoshop. The fluorescence overlay image was blended with the TEM background image however some misalignment was detectable. This may be due to the different imaging systems used by each modality or to radiation damage to our unsupported ultrathin sections in the TEM. Automated systems for storing coordinates of ROIs seen by light microscopy and transferring these to the electron microscope are now being marketed and would greatly simplify this procedure.
The utility of the CLEM approach we have presented for immunocytochemical studies is by necessity limited by the specimen preparation method used, i.e., heavy metal staining and epoxy resin embedding inevitably masking available epitopes. However, the technique does allow the considerable benefit of obtaining fluorescence and TEM data from pathology samples. Obtaining structural and functional information from different microscopy modalities using a single sample is something that has not generally been available to studies of human pathology cells and tissue that were processed primarily for diagnostic purposes.
It would be expected that more sensitive immunocytochemical localization could be obtained from a freeze fixation approach rather than a protocol based on chemical fixation. Adoption of cryofixation principles17 for biobanking of human tissue followed by cryoultramicrotomy and room temperature QD-based immunolabeling as in the classic Tokuyasu technique18, 19 would facilitate sensitive and specific correlative immunocytochemical studies of human disease pathogenesis.
Disclosures
The authors have nothing to disclose.
Acknowledgements
The authors wish to acknowledge the support of Xiao Juan Wu (Immunohistochemistry Laboratory) and the Department of Anatomical Pathology, Sydney South West Pathology Service (SSWPS), NSW Health Pathology, Liverpool, New South Wales, Australia.
Materials
| Sodium cacodylate | Proscitech | C0205 | Harmful chemical |
| Osmium tetroxide | Proscitech | C010 | Use only in fume hood |
| Uranyl acetate | Univar-Ajax | 569 | Hazardous chemical |
| Ethanol 100% | Fronine | JJ008 | |
| Acetone 100% | Fronine | JJ006 | |
| ERL 4221 | Proscitech | C056 | |
| DER 732 | Proscitech | C047 | |
| NSA | Proscitech | C059 | |
| DMAE | Proscitech | C050 | |
| Sodium metaperiodate | Analar BDH | 10259 | |
| anti-somatostatin antibody | Dako | A0566 | |
| Antibody diluent | Dako | S3022 | |
| Qdot 585 Streptavidin Conjugate | Invitrogen | Q10113MP | |
| Biotinylated goat anti-rabbit IgG antibody | Sigma | B7389-1ML | |
| Glutaraldehyde 50% | EMS | 16320 | |
| Normal goat serum | Invitrogen | PCN5000 | |
| PBS "Dulbecco A" | Oxoid | BR0014G | |
| BSAc (10%) | Aurion | 900.022 | |
| Parafilm | Pechiney PP | M | |
| pH indicator strips (pH 2.0 – 9.0) | Merck | 1.09584.0001 | |
| Micromoulds | Proscitech | RL063 | |
| Diamond knife | Diatome | Ultra 45 | |
| Transmission electron microscope | FEI | Morgagni 268D | |
| Fluorescence light microscope | Carl Zeiss | Axioscope A1 | |
| Grids 300 mesh nickel (thin bar) | Agar Scientific | G2740N | |
| Ultramicrotome | RMC | Powertome | |
| TEM camera control software | Soft Imaging System | AnalySIS | Version 3.0 |
| Image processing software | Adobe Systems Incorporated | Photoshop CS2 |
References
- Kukulski, W., Schorb, M., Welsch, S., Picco, A., Kaksonen, M., Briggs, J. A. Correlated fluorescence and 3D electron microscopy with high sensitivity and spatial precision. J Cell Biol. 192 (1), 111-119 (2011).
- Müller-Reichert, T., Verkade, P. Introduction to correlative light and electron microscopy. Methods Cell Biol. , (2012).
- De Boer, P., Hoogenboom, J. P., Giepmans, B. N. Correlated light and electron microscopy: ultrastructure lights up!. Nat Methods. 12 (6), 503-513 (2015).
- Faas, F. G., et al. Localization of fluorescently labeled structures in frozen-hydrated samples using integrated light electron microscopy. J Struct Biol. 181 (3), 283-290 (2013).
- Redemann, S., Müller-Reichert, T. Correlative light and electron microscopy for the analysis of cell division. J Microsc. 251 (2), 109-112 (2013).
- Spiegelhalter, C., et al. From dynamic live cell imaging to 3D ultrastructure: novel integrated methods for high pressure freezing and correlative light-electron microscopy. PLoS One. 5 (2), e9014 (2010).
- Killingsworth, M. C., Lai, K., Wu, X., Yong, J. L., Lee, C. S. Quantum dot immunocytochemical localization of somatostatin in somatostatinoma by widefield epifluorescence, super-resolution light, and immunoelectron microscopy. J Histochem Cytochem. 60 (11), 832-843 (2012).
- Nisman, R., Dellaire, G., Ren, Y., Li, R., Bazett-Jones, D. P. Application of quantum dots as probes for correlative fluorescence, conventional, and energy-filtered transmission electron microscopy. J Histochem Cytochem. 52 (1), 13-18 (2004).
- Giepmans, B. N., Deerinck, T. J., Smarr, B. L., Jones, Y. Z., Ellisman, M. H. Correlated light and electron microscopic imaging of multiple endogenous proteins using quantum dots. Nat Methods. 2 (10), 743-749 (2005).
- Kuipers, J., de Boer, P., Giepmans, B. N. Scanning EM of non-heavy metal stained biosamples: Large-field of view, high contrast and highly efficient immunolabeling. Exp Cell Res. 337 (2), 202-207 (2015).
- Barroso, M. M. Quantum dots in cell biology. J Histochem Cytochem. 59 (3), 237-251 (2011).
- Michalet, X., et al. Quantum dots for live cells, in vivo imaging, and diagnostics. Science. 5, 538-544 (2005).
- Shu, X., et al. A genetically encoded tag for correlated light and electron microscopy of intact cells, tissues and organisms. PLoS Biol. 9 (4), e1001041 (2011).
- Thomas, J. M., Midgley, P. A. High-resolution transmission electron microscopy: the ultimate nanoanalytical technique. Chem Commun. , 1253-1267 (2004).
- Loussert Fonta, C., Humbel, B. M. Correlative microscopy. Arch Biochem Biophys. 581, 98-110 (2015).
- Marc, R. E., Liu, W. Fundamental GABAergic amacrine cell circuitries in the retina: nested feedback, concatenated inhibition, and axosomatic synapses. J Comp Neurol. 425 (4), 560-582 (2000).
- Studer, D., Humbel, B. M., Chiquet, M. Electron microscopy of high pressure frozen samples: bridging the gap between cellular ultrastructure and atomic resolution. Histochem Cell Biol. 130 (5), 877-889 (2008).
- Tokuyasu, K. T. Immunochemistry on ultrathin frozen sections. Histochem J. 12 (4), 381-403 (1980).
- Loussert Fonta, C., et al. Analysis of acute brain slices by electron microscopy: a correlative light-electron microscopy workflow based on Tokuyasu cryo-sectioning. J Struct Biol. 189 (1), 53-61 (2015).
