We introduce four methods to evaluate the antimicrobial activities of nanoparticles and nanostructured surfaces using in vitro techniques. These methods can be adapted to study the interactions of different nanoparticles and nanostructured surfaces with a broad range of microbial species.
The antimicrobial activities of nanoparticles and nanostructured surfaces, such as silver, zinc oxide, titanium dioxide, and magnesium oxide, have been explored previously in clinical and environmental settings and in consumable food products. However, a lack of consistency in the experimental methods and materials used has culminated in conflicting results, even amongst studies of the same nanostructure types and bacterial species. For researchers who wish to employ nanostructures as an additive or coating in a product design, these conflicting data limit their utilization in clinical settings.
To confront this dilemma, in this article, we present four different methods to determine the antimicrobial activities of nanoparticles and nanostructured surfaces, and discuss their applicability in different scenarios. Adapting consistent methods is expected to lead to reproducible data that can be compared across studies and implemented for different nanostructure types and microbial species. We introduce two methods to determine the antimicrobial activities of nanoparticles and two methods for the antimicrobial activities of nanostructured surfaces.
For nanoparticles, the direct co-culture method can be used to determine the minimum inhibitory and minimum bactericidal concentrations of nanoparticles, and the direct exposure culture method can be used to assess real-time bacteriostatic versus bactericidal activity resulting from nanoparticle exposure. For nanostructured surfaces, the direct culture method is used to determine the viability of bacteria indirectly and directly in contact with nanostructured surfaces, and the focused-contact exposure method is used to examine antimicrobial activity on a specific area of a nanostructured surface. We discuss key experimental variables to consider for in vitro study design when determining the antimicrobial properties of nanoparticles and nanostructured surfaces. All these methods are relatively low cost, employ techniques that are relatively easy to master and repeatable for consistency, and are applicable to a broad range of nanostructure types and microbial species.
In the US alone, 1.7 million individuals develop a hospital-acquired infection (HAI) annually, with one in every 17 of these infections resulting in death1. In addition, it is estimated that the treatment costs for HAIs range from $28 billion to $45 billion annually1,2. These HAIs are predominated by methicillin-resistant Staphylococcus aureus (MRSA)3,4 and Pseudomonas aeruginosa4, which are commonly isolated from chronic wound infections and usually require extensive treatment and time to produce a favorable patient outcome.
Over the past several decades, multiple antibiotic classes have been developed to treat infections related to these and other pathogenic bacteria. For example, rifamycin analogs have been used to treat MRSA, other gram-positive and gram-negative infections, and Mycobacterium spp. infections5. In the 1990s, to effectively treat an increasing number of M. tuberculosis infections, additional drugs were combined with rifamycin analogs to increase their effectiveness. However, approximately 5% of M. tuberculosis cases remain resistant torifampicin5,6, and there is increasing concern regarding multi-drug resistant bacteria7. Currently, the use of antibiotics alone may not be sufficient in the treatment of HAIs, and this has provoked an ongoing search for alternative antimicrobial therapies1.
Heavy metals, such as silver (Ag)8,9,10 and gold (Au)11, and ceramics, such as titanium dioxide (TiO2)12 and zinc oxide (ZnO)13, in nanoparticle (NP) form (AgNP, AuNP, TiO2NP, and ZnONP, respectively) have been examined for their antimicrobial activities and have been identified as potential antibiotic alternatives. In addition, bioresorbable materials, such as magnesium alloys (Mg alloys)14,15,16, magnesium oxide nanoparticles17,18,19,20,21, and magnesium hydroxide nanoparticles [nMgO and nMg(OH)2, respectively]22,23,24, have also been examined. However, the previous antimicrobial studies of nanoparticles used inconsistent materials and research methods, resulting in data that are difficult or impossible to compare and are sometimes contradictory in nature18,19. For example, the minimum inhibitory concentration (MIC) and minimum bactericidal concentration (MBC) of silver nanoparticles varied significantly in different studies. Ipe et al.25 evaluated the antibacterial activities of AgNPs with an average particle size of ~26 nm to determine the MICs against gram-positive and gram-negative bacteria. The identified MICs for P. aeruginosa, E. coli, S. aureus, and MRSA were 2 µg/mL, 5 µg/mL, 10 µg/mL, and 10 µg/mL, respectively. In contrast, Parvekar et al.26 evaluated AgNPs with an average particle size of 5 nm. In this instance, the AgNP MIC and a MBC of 0.625 mg/mL were found to be effective against S. aureus. In addition, Loo et al.27 evaluated AgNPs with a size of 4.06 nm. When E. coli was exposed to these nanoparticles, the MIC and MBC were reported at 7.8 µg/mL. Finally, Ali et al.28 investigated the antibacterial properties of spherical AgNPs with an average size of 18 nm. When P. aeruginosa, E. coli, and MRSA were exposed to these nanoparticles, the MIC was identified at 27 µg/mL, 36 µg/mL, 27 µg/mL, and 36 µg/mL, respectively, and the MBC was identified at 36 µg/mL, 42 µg/mL, and 30 µg/mL, respectively.
Although the antibacterial activity of nanoparticles has been extensively studied and reported during recent decades, there is no standard for the materials and research methods used to allow for direct comparisons across studies. For this reason, we present two methods, the direct co-culture method (method A), and the direct exposure method (method B), to characterize and compare the antimicrobial activities of nanoparticles while keeping the materials and methods consistent.
In addition to nanoparticles, nanostructured surfaces have also been examined for antibacterial activities. These include carbon-based materials, such as graphene nanosheets, carbon nanotubes, and graphite29, as well as pure Mg and Mg alloys. Each of these materials has exhibited at least one antibacterial mechanism, including physical damage imposed on cell membranes by carbon-based materials and damage to metabolic processes or DNA through the release of reactive oxygen species (ROS) when Mg degrades. In addition, when zinc (Zn) and calcium (Ca) are combined in the formation of Mg alloys, the refinement of the Mg matrix grain size is enhanced, which leads to a reduction in bacterial adhesion to substrate surfaces in comparison to Mg-only samples14. To demonstrate antibacterial activity, we present the direct culture method (method C), which determines bacterial adhesion on and around nanostructured materials over time through the quantification of bacterial colony-forming units (CFUs) with direct and indirect surface contact.
The geometry of nanostructures on surfaces, including the size, shape, and orientation, could influence the bactericidal activities of materials. For example, Lin et al.16 fabricated different nanostructured MgO layers on the surfaces of Mg substrates through anodization and electrophoretic deposition (EPD). After a period of exposure to the nanostructured surface in vitro, the growth of S. aureus was substantially reduced in comparison to non-treated Mg. This indicated a greater potency of the nanostructured surface against bacterial adhesion versus the nontreated metallic Mg surface. To reveal the different mechanisms of the antibacterial properties of various nanostructured surfaces, a focused-contact exposure method (method D) that determines the cell-surface interactions within the area of interest is discussed in this article.
The objective of this article is to present four in vitro methods that are applicable to different nanoparticles, nanostructured surfaces, and microbial species. We discuss key considerations for each method to produce consistent, reproducible data for comparability. Specifically, the direct co-culture method17 and direct exposure method are used for examining the antimicrobial properties of nanoparticles. Through the direct co-culture method, the minimum inhibitory and minimum bactericidal concentrations (MIC and MBC90–99.99, respectively) can be determined for individual species, and the most potent concentration (MPC) can be determined for multiple species. Through the direct exposure method, the bacteriostatic or bactericidal effects of nanoparticles at minimum inhibitory concentrations can be characterized by real-time optical density readings over time. The direct culture14 method is suitable for examining bacteria directly and indirectly in contact with nanostructured surfaces. Finally, the focused-contact exposure16 method is presented to examine the antibacterial activity of a specific area on a nanostructured surface through the direct application of bacteria and the characterization of bacterial growth at the cell-nanostructure interface. This method is modified from the Japanese Industrial Standard JIS Z 2801:200016, and is intended to focus on microbe-surface interactions and exclude the effects of bulk sample degradation in microbial culture on antimicrobial activities.
To present the direct co-culture and direct exposure methods, we use magnesium oxide nanoparticles (nMgO) as a model material to demonstrate bacterial interactions. To present the direct culture and focused-contact exposure methods, we use an Mg alloy with nanostructured surfaces as examples.
1. Sterilization of nanomaterials
NOTE: All the nanomaterials must be sterilized or disinfected prior to microbial culture. The methods that can be used include heat, pressure, radiation, and disinfectants, but the tolerance of the materials for each method must be identified prior to the in vitro experiments.
2. Direct co-culture method (method A)
NOTE: In method A, bacteria in a lag-phase seeding culture are directly mixed with nanoparticles of certain concentrations. For the examination of nanoparticle antimicrobial activities, we follow a protocol described by Nguyen et al.17.
3. Direct exposure method (method B)
NOTE: If the growth rate of the chosen bacteria is unknown, then a standardization of growth curve must be completed prior to implementing this method.
4. Direct culture method (method C)
NOTE: In method C, bacteria in a lag-phase seeding culture are placed directly on the nanostructured surfaces of interest. For examination of the nanostructure antimicrobial activities, we follow a protocol described by Zhang et al.14. To demonstrate this direct culture method, ZC21 (Mg-Zn-Ca Alloy) and Mg pins were used as samples.
5. Focused-contact exposure method (method D)
NOTE: In method D, bacteria on a nitrocellulose filter paper are put in direct contact with an area of interest on the nanostructured surfaces. This method minimizes the interference of bulk sample degradation in bacterial cultures with the bacterial activities. To examine nanosurface antimicrobial activities, we follow a protocol described by Lin et al.16.
6. Post-culture characterization of bacteria and nanomaterials
The identification of the antibacterial activity of magnesium oxide nanoparticles and nanostructured surfaces has been presented using four in vitro methods that are applicable across different material types and microbial species.
Method A and method B examine bacterial activities when exposed to nanoparticles at a lag phase (method A) and log phase (method B) for a duration of 24 h or longer. Method A provides results regarding the MIC and MBC, while method B determines the inhibitory versus bactericidal effects of nanoparticles. Method C examines the bacterial activities with direct and indirect contact with nanostructured surfaces, and method D examines the bacterial activities on a select area of a cell-nanostructure interface for a duration of 24 h or longer.
The methods used are described in Figure 1 and Figure 2, and their results are presented in Figure 3, Figure 4, Figure 5, Figure 6, Figure 7, and Figure 8. Representative experimental results that quantify antimicrobial activity of nMgO against gram-negative and gram-positive bacteria and yeast can be viewed in Figure 3. The antibacterial activities of nMgO and nMg(OH)2 against MRSA can be viewed in Figure 4. The antibacterial activities of nanostructured surfaces against MRSA can be viewed in Figure 5 and Figure 6. Finally, the antibacterial activity of magnesium alloys against E. coli can be viewed in Figure 8B.
Using method A, it is possible to determine the MICs and MBCs for bacteria exposed to nanoparticles using consistent methods and materials. This consistency allows comparisons to be made between species using the identified MBCs to determine the most potent concentration of nanoparticles tested. In addition, this method can be applied to other classifications of microorganisms for comparisons of MICs and minimal lethal concentrations (MLCs17) as well. Here, sterilized nanoparticles were pre-measured at a quantity allowing triplicates of each concentration required. These nanoparticles were suspended in a lag-phase mono-bacteria seeding culture with a density of 6 × 10⁶-8 × 10⁶ cells/mL. The method described to suspend the pre-measured nanoparticles with seeding culture or broth successfully created triplicate samples that were relatively homologous in nanoparticle distribution, which may reduce the deviation in CFU/mL within triplicate samples. The experimental workflow for this method is illustrated in Figure 1A. A demonstration of the antimicrobial effects of nMgO on gram-negative and gram-positive bacteria and Candida spp. using method A can be seen in Figure 3. Here, an MIC of 1.0 mg/mL nMgO for gram-negative Escherichia coli and Pseudomonas aeruginosa, as well as an MBC99.99 of 1.0 mg/mL and 1.6 mg/mL nMgO, respectively, were identified for these species (Figure 3A). Gram-positive S. epidermidis, S. aureus, and MRSA demonstrated MICs of 0.5 mg/mL, 0.7 mg/mL, and 1.0 mg/mL nMgO, respectively. MBC99.99 values of 1.6 mg/mL and 1.2 mg/mL nMgO were identified for S. epidermidis and S. aureus, respectively, while MRSA was not reduced beyond MBC90 (Figure 3B). In drug-sensitive and drug-resistant Candida spp., C. albicans and C. albicans FR, MICs of 1.2 mg/mL and 1.0 mg/mL nMgO were identified, respectively. In contrast, nMgO demonstrated MIC values of 1.0 and 0.7 mg/mL for C. glabrata and C. glabrata ER, respectively. In addition, each Candida species reached an MBC90 of 0.7-1.2 mg/mL nMgO, but only C.glabrata ER was reduced to MBC99.99 at 1.2 mg/mL nMgO (Figure 3C). In addition, in most species tested, the identification of the most potent concentration (MPC) of nMgO was determined. The MPC indicates the nanoparticle concentration that is most effective across poly-microbial communities17.
Method B exposes bacteria in the logarithmic growth phase to nanoparticles of certain concentrations to determine if the nanoparticles are bacteriostatic (inhibitory) or bactericidal using the MBCs identified in method A. This method uses spectrophotometry (OD600) measurements over discrete time periods to identify alterations in bacterial growth in response to nanoparticle exposure. In addition, bacteria exposed to bacteriostatic or bactericidal antibiotics are concurrently grown with the nanoparticle-exposed bacteria in separate wells to provide a reference in the identification of these nanoparticle activities. The concentrations of nMgO and nMg(OH)2 used were derived from a previous study using bacteria of the logarithmic growth phase exposed to nMgO and nMg(OH)2. Concentrations of nMgO and nMg(OH)2 were identified using mM equivalents ranging from 5 mM to 50 mM. The results showed that nMgO was bactericidal to MRSA at 30 mM (1.2 mg/mL nMgO), while nMg(OH)2 was bacteriostatic at 50 mM (2.9 mg/mL nMg(OH)2). The concentrations of antibiotics used were identified from the literature and confirmed in our own experiments. The experimental workflow for this method is illustrated in Figure 1B. Representative results for method B can be seen in Figure 4. Here, MRSA unexposed to nanoparticles grew exponentially to an OD600 of 0.85. When exposed to 1.2 mg/mL nMgO and 6.25 µg/mL trimethoprim, bacterial growth was reduced to an OD600 of 0.18 (80.2% and 81.6%, respectively), and 2.9 mg/mL nMg(OH)2 reduced bacterial growth to an OD600 of 0.25 (70.3%). Exposure to 1.0 µl/mL vancomycin resulted in a 99.99% reduction in the growth of MRSA, suggesting that the concentrations of nMgO and nMg(OH)2 used here were bacteriostatic in activity.
Method C examines the antibacterial activity of nanostructured surfaces. A bacterial culture in lag-phase growth was seeded directly onto a nanostructured surface to measure CFUs with or without direct contact with the surface. Using this method, it was possible to determine the surface effects on bacterial adhesion and viability under direct contact conditions. Bacteria in direct contact with the nanostructured surfaces and in indirect contact (in culture suspension) were collected and quantified in CFU/mL to determine the bacterial growth under each condition. These data obtained may be useful in downstream applications of nanostructured materials on surfaces for clinical use, where a reduction in bacterial colonization on surface structures is desired. The experimental workflow for this method is illustrated in Figure 2A. Representative results for method C can be seen in Figure 5. Here, there was no inhibition of bacterial growth with indirect contact. However, bacterial adhesion was reduced for all substrates, most significantly with the ZC21 alloy, followed by T64 (titanium), magnesium, glass only, and the ZSr41 alloy, respectively. These results indicate that ZC21 had the strongest antibacterial activity against the adhesion and growth of MRSA for all the samples tested14.
Method D examines antibacterial activity at a select area of interest at the cell-nanostructure interface through the direct placement of bacteria in filter paper onto a nanostructured surface. Using this method, a correlation between antibacterial activity and surface properties, such as the surface chemistry, roughness, and area of the nanostructured surface, can be identified16. The experimental workflow for this method is illustrated in Figure 2B. Representative results for method D can be seen in Figure 6. Here, no viable S. aureus was identified on the 1.9A, 1.9 AA, and EPD samples or their paired filter papers. However, exposure to the EPD samples after annealing (A-EPD) reduced bacterial growth to a few cells on the nanostructured surface and the paired filter paper. The sample containing magnesium (Mg) also had no bacterial growth, but viable bacteria were isolated from the paired filter paper. A reduction in the growth of S. aureus was not seen with the titanium and glass samples or their paired filter papers16.
In addition to the use of the methods described above to determine antimicrobial activities, SEM and fluorescence microscopy can be used to characterize the morphological changes that occur in microorganisms after exposure to nanoparticles and nanostructured materials. The representative SEM images showing the post-exposure gram-negative Escherichia coli are presented in Figure 7A, and those showing the post-exposure Gram-positive S. aureus are presented in Figure 7B. Using the SEM imaging technique with a 5,000x magnification, phenotypic changes in E. coli exposed to concentrations of 0.5 mg/mL nMgO or higher could be identified17. Fluorescence microscopy can also be used to characterize morphological changes in microorganisms, but with potentially lower costs and greater accessibility than SEM. Figure 8 shows representative fluorescence images of E. coli exposed to the nanostructured material MgY_O for 1 day, 2 days, and 3 days, as well as reference E. coli. Only one bacterial species, E. coli, was used initially. In the future, we will consider exposing additional bacterial species to the same materials of interest to produce a more comprehensive understanding of bacterial responses to MgY_O exposure. In these results, individual E. coli cells and colonies could be viewed and imaged using thioflavin T staining and a fluorescence microscope for the qualitative analysis of the antibacterial activity of MgY_O15.
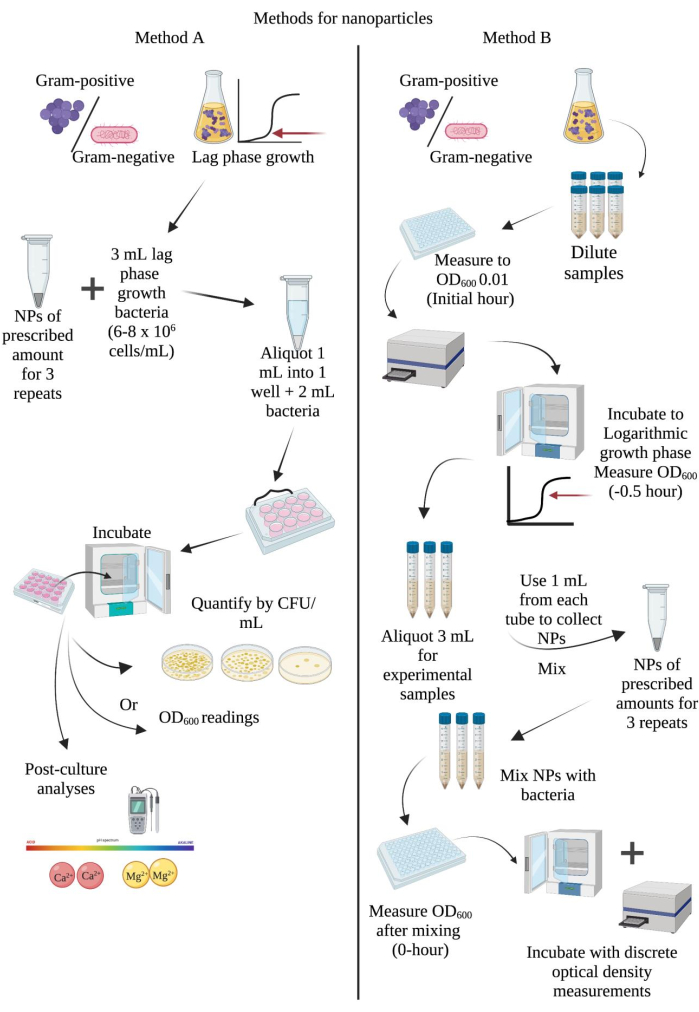
Figure 1: Schematic diagrams to determine nanoparticle MIC or MBC90-99.99 and bacteriostatic or bactericidal activities in post-exposure cell cultures. (A) Direct co-culture method17. (B) Direct exposure method. Abbreviations: CFU = colony-forming units; NPs= nanoparticles; OD600 = optical density at 600 nm. Please click here to view a larger version of this figure.
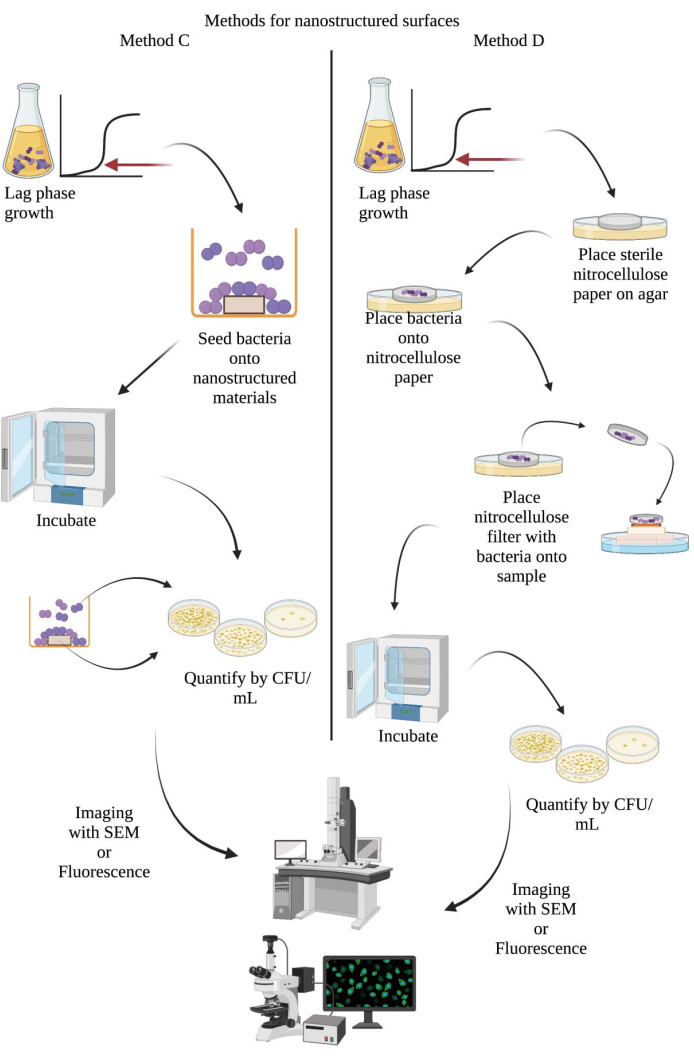
Figure 2: Schematic diagrams to determine bacterial growth with direct and indirect contact and at the cell-nanostructure interface of nanostructured surfaces. (A) Direct culture method14. (B) Focused-contact exposure method16. Abbreviations: CFU = colony-forming units; SEM = scanning electron microscopy. Please click here to view a larger version of this figure.
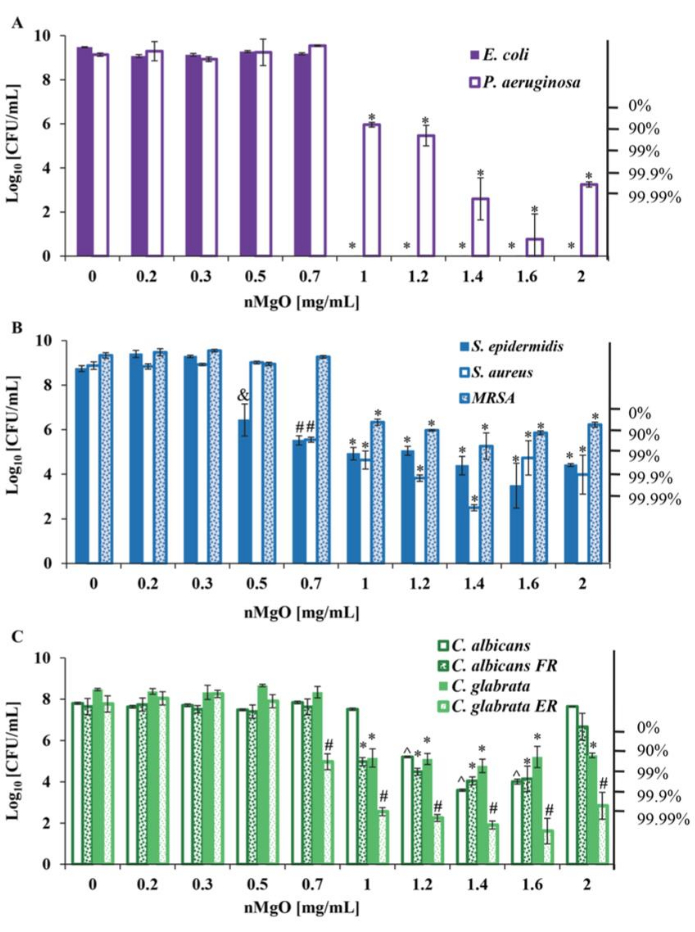
Figure 3: Representation of viable bacteria and yeasts quantified by CFU/mL 24 h post-exposure to 0-2.0 mg/mL nMgO. (A) CFU/mL of gram-negative bacteria, including E. coli and P. aeruginosa. (B) CFU/mL of gram-positive bacteria, including S. epidermidis, S. aureus, and methicillin-resistant S. aureus. (C) CFU/mL of drug-susceptible C. albicans, drug-resistant C. albicans FR, drug-susceptible C. glabrata, and drug-resistant C. glabrata ER. Data are represented as mean ± standard deviation (N = 9). *p ≤ 0.05, significantly lower than the groups at 0-0.7 mg/mL nMgO for the respective bacterium or yeast. ^p ≤ 0.05, significantly lower than the groups at 0-1 mg/mL nMgO for the respective microorganism. #p ≤ 0.05, significantly lower than the groups at 0-0.5 mg/mL nMgO for the respective microorganism. &p ≤ 0.05, significantly lower than the groups at 0-0.3 mg/mL nMgO for the respective microorganism17. This figure is modified from Nguyen et al.17. Abbreviations: FR = fluconazole-resistant; ER = echinocandin-resistant; nMgO = magnesium oxide nanoparticles; CFU = colony-forming units. Please click here to view a larger version of this figure.
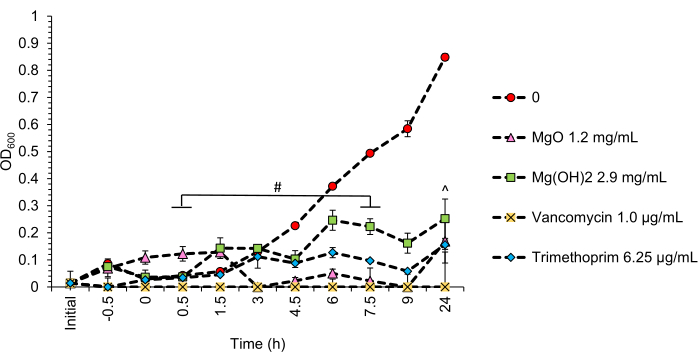
Figure 4: Representation of optical density readings (OD600) taken in real-time for methicillin-resistant S. aureus. MRSA exposure to 1.2 mg/mL nMgO, 2.9 mg/mL nMg(OH)2, 6.25 µg/mL trimethoprim, and 1.0 µg/mL vancomycin for 24 h. p ≤ 0.025: the growth of MRSA exposed to 1.0 µg/mL vancomycin at 0.5 h is significantly lower than the growth of MRSA exposed to 2.9 mg/mL Mg(OH)2 at 7.5 h. ^p ≤ 0.025: the growth of MRSA exposed to 1.0 µg/mL vancomycin at 24 h post-inoculation is significantly lower than the growth of MRSA exposed to 2.9 mg/mL Mg(OH)2 at 24 h. Data are presented as the mean ± the standard error of the mean (SEM). Please click here to view a larger version of this figure.
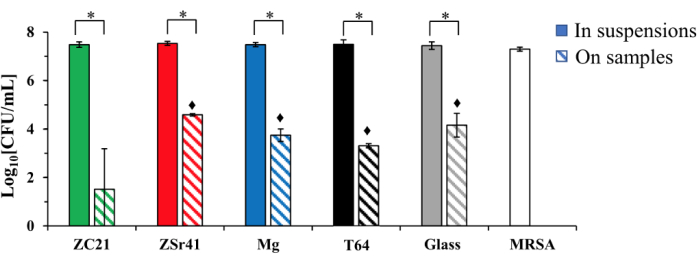
Figure 5: Representation of viable methicillin-resistant S. aureus quantified by CFU/mL at 24 h post-exposure to samples and controls. Bacteria were seeded at an actual density of 7.5 × 10⁵ cells/mL and confirmed by CFU/mL. Data are represented as the mean ± standard deviation, n = 3; *p < 0.05. p < 0.05 when compared with the CFU on ZC21 samples. This figure was modified from Zhang et al.14. Please click here to view a larger version of this figure.
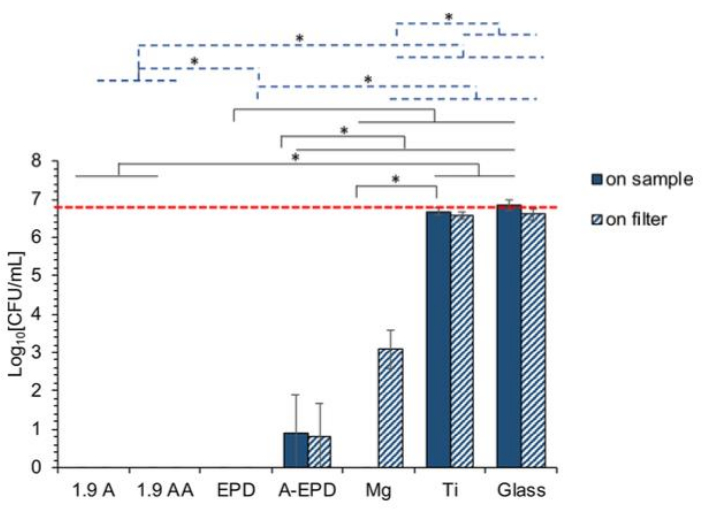
Figure 6: Representative quantification by CFU/mL of the bacterial seeding density 24 h post-exposure to surface-treated Mg samples of 1.9 A, 1.9 AA, EPD, and A-EPD, and Mg and Ti control samples. Bacteria were seeded at an actual density of 6 × 10⁶ CFU/mL, as represented by the red dashed line. Data are represented as the mean ± standard deviation; n = 3. *p < 0.05. The solid black line indicates the statistical analysis results for the bacterial density on the sample surfaces. The blue dashed line indicates the statistical analysis results for the bacterial density on the filters covering the sample surfaces. Abbreviations: CFU = colony-forming units; A-EPD = electrophoretic deposition after annealing; EPD = electrophoretic deposition before annealing; A = anodization before annealing; AA = anodization after annealing. This figure was modified from Lin et al.16. Please click here to view a larger version of this figure.
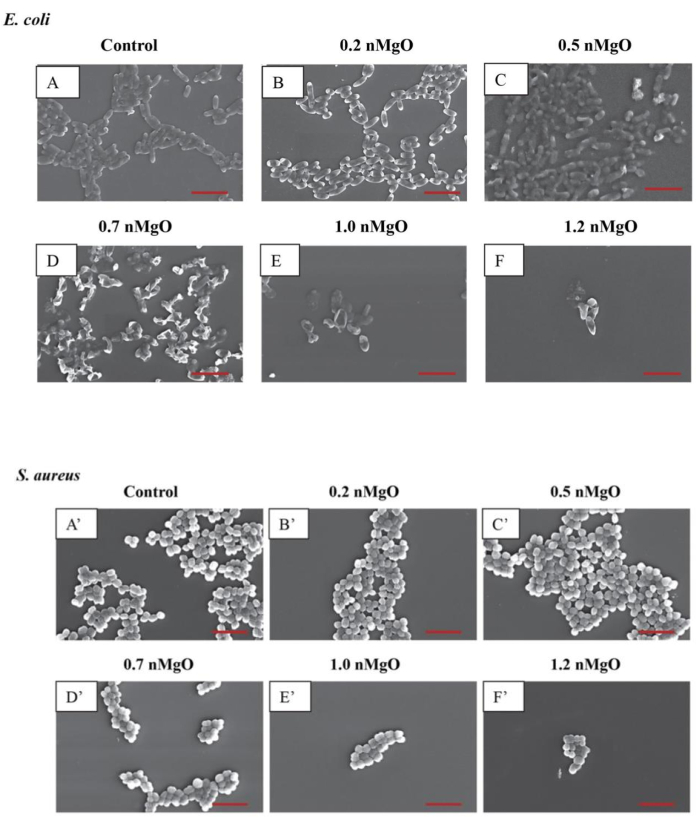
Figure 7: Representative SEM images of gram-negative E. coli and gram-positive S. aureus exposed to 0–1.2 mg/mL nMgO. (A) E. coli showed similar morphology at 1.2 mg/mL to 2.0 mg/mL nMgO. For this reason, one image at 1.2 mg/mL is shown as a representative of E. coli exposed to higher nMgO concentrations. (B) S. aureus also showed similar morphology at 1.2 mg/mL to 2.0 mg/mL nMgO. For this reason, one image at 1.2 mg/mL is shown as a representative of S. aureus exposed to higher nMgO concentrations17. Scale bars = 5 µm. nMgO = magnesium oxide nanoparticles. This figure was modified from Nguyen et al.17. Please click here to view a larger version of this figure.
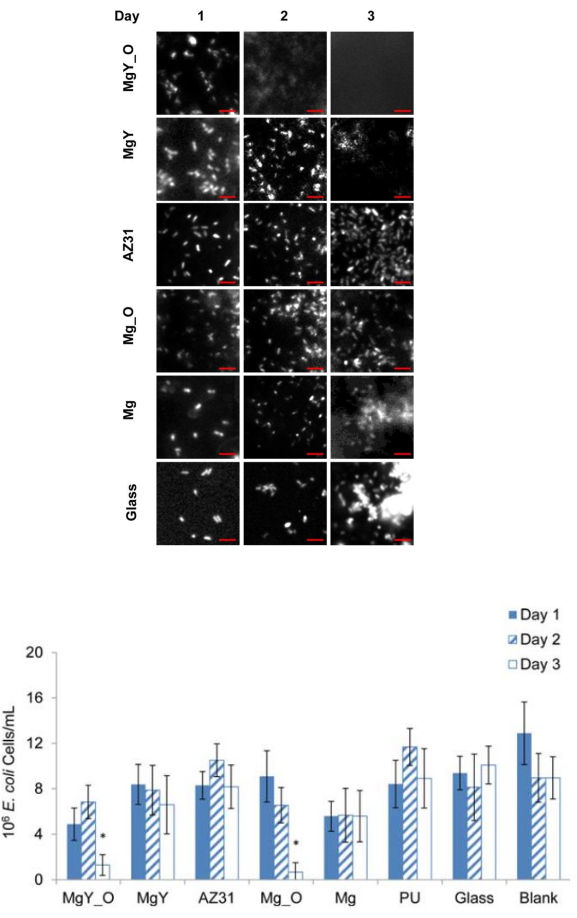
Figure 8: Representative fluorescence images of E. coli adhered onto the substrates with quantification at 1 day, 2 days, and 3 days of incubation. (A) Fluorescence images of E. coli stained with 10 µM thioflavin T. (B) Quantification of E. coli exposed to materials of interest using cells/mL. There was no bacterial adherence to MgY_O after 2 days of incubation, and decreased adherence to MgY after 3 days of incubation. Scale bar = 10 µm. This figure was modified from Lock et al.15. Please click here to view a larger version of this figure.
We have presented four in vitro methods (A-D) to characterize the antibacterial activities of nanoparticles and nanostructured surfaces. While each of these methods quantifies bacterial growth and viability over time in response to nanomaterials, some variation exists in the methods used to measure the initial bacterial seeding density, growth, and viability over time. Three of these methods, the direct co-culture method (A)17, the direct culture method (C)14, and the focused-contact exposure method (D)16, quantify bacterial growth and viability after a period of exposure to nanomaterials by counting the CFUs per unit volume. In comparison, the direct exposure method (B) quantifies bacterial growth via discrete real-time optical density (OD600) measurements. This method can also be applied to the direct co-culture, direct culture, and focused-contact exposure methods if there are time constraints for quantifying CFUs, and/or a real-time bacterial density reading is needed for kinetic studies. If effective antibiotics are not known for the bacterial species to be tested in the direct exposure method, a literature search must be carried out to determine the correct antibiotics and their MIC values to serve as references for the nanomaterial groups. A confirmation of the MIC values can be made by completing a standardization curve, which plots the relationship between the spectrophotometry data and the quantification of colony-forming units at specific time points. This process correlates the number of cells present in culture at specific points with the respective optical density. In addition, bacteria at lag-stage growth are introduced to nanoparticles in the direct co-culture method and nanostructured surfaces in the direct culture and focused-contact exposure methods. In contrast, bacteria at the logarithmic growth stage are introduced to nanoparticles in the direct exposure method. Furthermore, bacterial seeding densities are quantified as cells/mL in the direct co-culture method, the direct culture method, and the focused-contact exposure method, whereas the optical density (OD600) of bacteria is measured to track real-time growth in the direct exposure method.
Although each of these methods is similar in framework, they also present unique characteristics to distinguish the effects of nanoparticles or nanostructured surfaces on bacteria. For example, the direct co-culture method characterizes bacterial responses to increasing pre-measured concentrations of nanoparticles by CFU/mL quantification (Figure 3). This method generates minimum inhibitory and minimum bactericidal concentrations (MIC and MBC) of nanoparticles for microbial species of interest and, if multiple species are examined, the most potent concentration (MPC) of nanoparticles17. The identification of the MIC, MBC90-99.99, and MPC is essential for the application of nanoparticles in downstream applications. For example, these data can be applied to in vivo examinations of nanoparticle antibacterial activity while maintaining cytocompatibility when less-than-lethal concentrations have also been identified. In contrast, the direct exposure method characterizes nanoparticle activity as bacteriostatic or bactericidal in a manner that is similar to the classification of antibiotics, where synergistic or undesirable effects must be identified prior to use in research or clinical settings.
The characterization of antibacterial compounds as bacteriostatic or bactericidal is relevant to clinical use and in vitro and in vivo research38. For this reason, when designing methods to examine these characteristics, any negative effects that may impact the results must be identified. Here, the direct exposure method categorizes nanoparticles as bacteriostatic or bactericidal for specific bacterial species using real-time measurements of optical density at 600 nm (Figure 4). Bacteria in the logarithmic growth phase are mixed with nanoparticles at the MIC level to create bacteria and nanoparticle suspensions. These suspensions are discreetly measured in real time to determine the ongoing effects of nanoparticle exposure on the bacteria. To verify the results obtained, concurrently grown bacteria in suspension with bacteriostatic and bactericidal antibiotics act as a reference to confirm the growth rates of the nanoparticle-exposed bacteria.
The incorporation of nanoparticles into bioengineering, clinical, and environmental sciences may have far-reaching possibilities, but using the antibacterial data of nanoparticles for in vitro and in vivo studies on nanostructured surfaces is challenging to accomplish. For this reason, we presented the direct culture and focused-contact exposure methods to characterize the in vitro antibacterial activities of nanostructured surfaces. The direct culture method examines the antibacterial effects of nanostructured surfaces when bacteria are in direct contact with the materials of interest14. Here, bacteria suspended in rSBF plus 10% FBS are exposed to nanostructured surfaces, followed by the quantification of bacterial growth over time for bacteria in direct contact with the surface and in suspension surrounding the material of interest (indirect contact) using CFU/mL. Previously, experimental outcomes involving magnesium alloy nanostructures (ZC21 and ZSr41 alloys) have indicated that antibacterial activities increase when the bacteria are in direct contact with nanostructured surfaces in comparison with indirect contact, where the bacteria remain in suspension with little to no contact14 (Figure 5). Finally, the focused-contact method characterizes antibacterial activity at the interface of bacteria and a nanostructured surface16. Here, we examined magnesium oxide anodized or electrophoretically deposited onto the surface of a bioresorbable magnesium alloy to determine the potential disruption of bacterial adhesion and biofilm formation over time. The disruption of biofilm formation can be critical for patient healing processes as biofilms tend to evade host immune responses and antibiotic therapies39 and result in infections that are extremely difficult to treat.
Here, we present a method adapted from the Japanese Industrial Standard JIS Z 2801:200016. This method ensures that bacteria are attached to sterile nitrocellulose filter paper followed by exposure to a fixed area of the nanostructured surface. This limits the characterization of the surface effects on antibacterial activity to the testing area only. In the representative results, the anodization before annealing (1.9A), anodization after annealing (1.9AA), and electrophoretic deposition before annealing (EPD) samples showed significant effects on reducing bacterial growth as well as their corresponding filter papers when compared to the magnesium, titanium, and glass control samples. The electrophoretic deposition after annealing (A-EPD) samples were also effective in reducing bacterial growth, but this result was less significant in comparison to the results obtained for the 1.9A, 1.9AA, and EPD samples16 (Figure 6).
In summary, each in vitro method presented here is reasonably easy to master and incorporates inexpensive and readily available materials. These methods can be used to characterize interactions between a wide range of nanomaterials and microbial species that are of interest to researchers. Understanding the similarities and differences among these methods is necessary to design optimal experiments to meet the research objectives. Here, the scientific knowledge gained from these in vitro methods can be applied to downstream medical applications where antibiotics must be limited or represent an unfavorable approach.
The authors have nothing to disclose.
The authors appreciate the financial support from the U.S. National Science Foundation (NSF CBET award 1512764 and NSF PIRE 1545852), the National Institutes of Health (NIH NIDCR 1R03DE028631), the University of California (UC) Regents Faculty Development Fellowship, the Committee on Research Seed Grant (Huinan Liu), and the UC-Riverside Graduate Research Mentorship Program Grant awarded to Patricia Holt-Torres. The authors appreciate the assistance provided by the Central Facility for Advanced Microscopy and Microanalysis (CFAMM) at UC-Riverside for the use of SEM/EDS and Dr. Perry Cheung for the use of XRD. The authors would also like to thank Morgan Elizabeth Nator and Samhitha Tumkur for their assistance with the experiments and data analyses. Any opinions, findings, conclusions, or recommendations expressed in this article are those of the authors and do not necessarily reflect the views of the National Science Foundation or the National Institutes of Health.
1.5 mL microcentrifuge tube | Milipore Sigma | Z336777 | |
80 L NTRL Certified Convection Drying Oven | MTI Corporation | BPG-7082 | https://www.mtixtl.com/BPG-7082.aspx |
(hydroxymethyl) aminomethane buffer pH 8.5; Tris buffer | Sigma-Aldrich | 42457 | |
AnaSpec THIOFLAVIN T ULTRAPURE GRADE | Fisher Scientific | 50-850-291 | |
Electron-multiplying charge-coupled device digital camera | Hamamatsu | C9100-13 | |
Falcon 15 mL conical tubes | Fisher Scientific | 14-959-49B | |
Gluteraldehyde | Sigma-Aldrich | G5882 | |
Hemocytometer | Brightline, Hausser Scientific | 1492 | |
Inductively coupled plasma – optical emission spectrometry (ICP-OES) | PerkinElmer | 8000 | |
Inverse microscope | Nikon | Eclipse Ti-S | |
Luria Bertani Broth | Sigma Life Science | L3022 | |
Luria Bertani Broth + agar | Sigma Life Science | L2897 | |
MacroTube 5.0 | Benchmark Scientific | C1005-T5-ST | |
Magnesium oxide nanoparticles | US Research Nanomaterials, Inc | Stock #: US3310 M | MgO, 99+%, 20 nm |
MS Semi-Micro Balance | Mettler Toledo | MS105D | |
Nitrocellulose paper | Fisherbrand | 09-801A | |
Non-tissue treated 12-well polystyrene plate | Falcon Corning Brand | 351143 | |
Non-tissue treated 48-well polystyrene plate | Falcon Corning Brand | 351178 | |
Non-tissue treated 96-well polystyrene plate | Falcon Corning Brand | 351172 | |
Petri dish 100 mm | VWR | 470210-568 | |
Petri dish, 15 mm | Fisherbrand | FB0875713A | |
pH meter | VWR | SP70P | |
Scanning electron microscopy (SEM) | TESCAN | Vega3 SBH | |
Sonicator | VWR | 97043-936 | |
Table top centrifuge | Fisher Scientific | accuSpin Micro 17 | |
Table top centrifuge | Eppendorf | Centrifuge 5430 | |
Tryptic Soy Agar | MP | 1010617 | |
Tryptic Soy Broth | Sigma-Aldrich | 22092-500G | |
UV-Vis spectrophotometer | Tecan | Infinite 200 PRO | https://lifesciences.tecan.com/plate_readers/infinite_200_pro |
VWR Benchmark Incu-shaker 10L | VWR | N/A | |
X-ray power defraction | Panalytical | N/A | PANalytical Empyrean Series 2 |