Plant cell wall composition varies between tissue types and can include lignin, cellulose, hemicelluloses, and pectin. Various staining techniques have been developed to visualize differences at the cell-type level. This paper is a compilation of commonly used cell wall staining techniques.
Arabidopsis thaliana is a model organism commonly used to understand and manipulate various cellular processes in plants, and it has been used extensively in the study of secondary cell wall formation. Secondary cell wall deposition occurs after the primary cell wall is laid down, a process carried out exclusively by specialized cells such as those forming vessel and fiber tissues. Most secondary cell walls are composed of cellulose (40–50%), hemicellulose (25–30%), and lignin (20–30%). Several mutations affecting secondary cell wall biosynthesis have been isolated, and the corresponding mutants may or may not exhibit obvious biochemical composition changes or visual phenotypes since these mutations could be masked by compensatory responses. Staining procedures have historically been used to show differences on a cellular basis. These methods are exclusively visual means of analysis; nevertheless their role in rapid and critical analysis is of great importance. Congo red and calcofluor white are stains used to detect polysaccharides, whereas Mäule and phloroglucinol are commonly used to determine differences in lignin, and toluidine blue O is used to differentially stain polysaccharides and lignin. The seemingly simple techniques of sectioning, staining, and imaging can be a challenge for beginners. Starting with sample preparation using the A. thaliana model, this study details the protocols of a variety of staining methodologies that can be easily implemented for observation of cell and tissue organization in secondary cell walls of plants.
The plant cell wall holds a plethora of information within its various components: lignin, cellulose, hemicelluloses (xylan, glucuronoxylan, xyloglucan, arabinoxylan, mixed linkage glucan, or glucomannan), and pectin. Histological techniques provide important visual cues in studying differences within the secondary cell walls at organizational and cellular levels. Various histological techniques were developed and can be found in the literature, but these techniques can be challenging and time-consuming for beginners because very detailed protocols with simple visual instructions are seldom if ever available. The goal of this study is to provide simple guidelines for histological staining techniques to obtain high-quality images.
Sectioning the stem tissue is the first step in visualization of cell walls and cell shapes. Although hand-cut sections are inexpensive and take less time to prepare, use of a vibratome offers consistency and yields high-quality images. Using a vibratome allows producing better data quality by generating even sections with the same thickness, which helps to produce sharp images and reduces significantly the risk of producing inaccurate differences between samples that would be simply caused by a bad sample preparation. Using resins to fix fresh specimens can be a challenge for beginners and may still be time-consuming even for experts when an analysis needs to be done quickly. In addition, it becomes impossible to measure any biological activity with the sample when it has been embedded in a resin. One simple technique that employs agarose and a homemade mold is helpful for embedding stem tissues, and it can also be utilized in other applications requiring dissection of soft tissues. Compared to embedding specimens in resin, this method has the advantage of keeping the tissues alive and reducing sample manipulation. Sectioning tissues via a vibratome is highly precise and generates homogenous sections, which, depending on the goal of the study, can then be used with several different staining techniques.
The simplest methods to visualize lignin and other aromatics employ ultraviolet (UV) light. Excitation of aromatic-based molecules by UV light is an old technique, but it is still one of the quickest approaches for visualization of lignin. However, UV visualization actually is not ideal for lignin detection because UV light will excite other aromatics. Lignin is made up primarily of three building blocks, the monolignols (hydroxycinnamyl alcohols: coniferyl alcohol, sinapyl alcohol, and p-coumaryl alcohol)1-3. Phloroglucinol stain can provide clues to the extent of cinnamaldehydes present in the xylem, fiber, and tracheal tissues4. Phloroglucinol is a good indicator of general cinnamaldehydes and can differentiate between cinnamaldehydes and other aromatics. The sinapyl alcohol monomers can be detected and differentiated by the use of Mäule stain. Toluidine blue O is a polychromatic dye and therefore has the ability to stain different elements of the cell wall in different colors5,6. The primary use of toluidine blue O is to detect pectin and lignin5,6. The advantage of using toluidine blue O is that many elements of the cell wall can be visualized in a single step. Both calcofluor white and congo red are easy to work with and can be used to visualize cellulose. Calcofluor white stains cellulose, callose, and other non-substituted or weakly substituted β-glucans6-9, whereas congo red stains directly to β-(1→4)-glucans and particularly to cellulose10,11. The goal of this study is to provide simple guidelines for the use of the aforementioned staining techniques to obtain high-quality images from A. thaliana stems.
1. Stem Embedding
2. Stem Sectioning
3. Microscope and Camera Setting for Imaging
4. Ultraviolet and Bright-field Imaging
5. Phloroglucinol-HCl (Wiesner) Staining12
6. Mäule Staining13,14
7. Congo Red Staining11,15
8. Calcofluor White Staining9
9. Toluidine Blue O Staining16,17
Stem Embedding and Sectioning:
The use of the homemade plastic mold to embed the stems in 7% agarose proved to be fast and easy (Figure 1). The two parts (A and B; Figure 1) of the embedded vial system make it simple to easily release the stem embedded in agarose as the agarose does not stick to the vial parts that are inert, keeping the system clean. The vials can be reused multiple times for years. The convenience of storing the embedded stem also makes the next steps easier. In order to save sometime, similar embedded stems can be grouped (up to 3) on a single sectioning plate for sectioning.
Observation of Aromatics Under UV:
The stem sections were mounted in distilled water on to the glass slides and observed under UV light. The aromatic compounds, including the lignin in the cells, can be visualized by their autofluorescence under UV light. Xylem (Xy) and interfascicular fibers (Fi) showed autofluorescence under UV illumination but not in pith (Pi) and cortex or epidermis (Ep) (Figure 2), because lignin, an aromatic polymer, is deposited during secondary cell-wall biosynthesis. In some instances, when plants accumulate significant amounts of aromatics in their vacuoles (e.g., anthocyanin), fluorescence can be observed in cortical cells (data not shown). Stem cross-sections were analyzed under 5X, 10X, 20X, and 40X magnification (Figure 2 Panels A, B, C, and D–E, respectively) to better visualize cell wall aromatic distribution across the stem.
Observation of Lignin in the Stem Sections Stained with Phloroglucinol and Mäule Stains:
The xylem composed of vessels and fibers and interfascicular fibers were the only elements of the stem that were stained by the lignin stains (phloroglucinol and Mäule) using a wild type stem section sample. Phloroglucinol stain reacts with cinnamaldehyde end-groups of lignin to give a pink or fuchsia color4 (Figure 3). As observed under UV illumination, a fuchsia coloration is observed in xylem and interfascicular fibers but is absent in pith and cortex or epidermis (Figure 3). Stem cross-sections were analyzed under 5X, 10X, 20X, and 40X magnification (Figure 3 Panels A, B, C, and D–E, respectively) to better visualize phloroglucinol stain distribution across the stem and differentiate the major tissues; xylem and interfascicular fibers; pith and cortex; and epidermis. Usually the intensity of the color correlates with the level of lignification in a qualitative manner — except when the analyzed mutant or transgenic is abnormally enriched in cinnamaldehyde-derived units (e.g. cad mutant)14. The Mäule stain is specific in detecting the syringyl lignin units in xylem and interfascicular fibers. Red coloration indicates the presence of syringyl lignin units in the lignin elements (Figure 4)18. However, a brighter red coloration is observed in the fibers when compared to the xylem tissues which suggests that the fibers contain a higher level of S lignin whereas the xylem is more enriched in G units. As observed after phloroglucinol staining, a red coloration is observed in xylem and interfascicular fibers but is absent in pith and cortex or epidermis (Figure 4). It also correlates with the lignin distribution observed under UV (Figure 2) and shows that syringyl units are present in every lignified tissue of this stem sample. Stem cross-sections were analyzed under 5X, 10X, 20X, and 40X magnification (Figure 2 Panels A, B, C, and D–E, respectively) to better visualize Mäule stain distribution across the stem and differentiate the major tissues: xylem and interfascicular fibers, pith and cortex, and epidermis. It is important to note that the amount and distribution of syringyl units between lignified tissues vary with the age of the stem and can be absent in a young stem (data not shown).
Observation of Stem Sections Stained with Calcofluor White and Congo Red Stains:
Calcofluor white stains cellulose, callose, and other nonsubstituted or weakly substituted β-glucans; whereas congo red stains directly to β-(1→4)-glucans and particularly to cellulose. Stem sections stained with calcofluor white were observed under UV light6-9. Congo red-stained sections were observed under blue-light excitation using a filter with a bandpass of 560/40. Both calcofluor white and congo red stained the epidermis, cortex, and pith; this is because all of these tissues contain cellulose as major polysaccharide polymer in their cell walls (Figure 5 and Figure 6, respectively). In contrast to calcofluor white, congo red stained polysaccharides better in the xylem and interfascicular fibers and seems less affected by the presence of lignin (Figure 5 and Figure 6)10,11. Stem cross-sections were analyzed under 5X, 10X, 20X, and 40X magnification (Panels A, B, C, and D-E, respectively of Figures 5 and 6) to better visualize calcofluor white and congo red stain distributions across the stem and the major tissues (xylem and interfascicular fibers, pith and cortex, and epidermis).
Observation of Stem Sections Stained with Toluidine Blue O:
Toluidine blue O is classified as a polychromatic dye because it reacts with different chemical components of cells differently and results in a multi-colored specimen (Figure 7). The colors generated can provide information on the nature of the cell and its walls. Toluidine blue O is a cationic dye that binds to negatively charged groups5. An aqueous solution of this dye is blue, but different colors are generated when the dye binds with different anionic groups in the cell6,9. For example, a pinkish purple color will appear when the dye reacts with carboxylated polysaccharides such as pectic acid; green, greenish blue, or bright blue with poly-aromatic substances such as lignin and tannins; and purplish or greenish blue with nucleic acids. Toluidine blue O of stem cross-sections revealed that xylem and interfascicular fibers are lignified since they show a greenish blue or blue coloration (Figure 7, Panel C), which is in agreement with the UV and Ph-HCl staining observations (Figures 2 and 3). In contrast, the pith and cortex and epidermis tissues show greenish blue or blue coloration because, although they are not lignified, they contain some pectin polymers in their cell walls. Stem cross-sections were analyzed under 5X, 10X, 20X, and 40X magnification (Figure 7 Panels A, B, C, and D–E, respectively) to better visualize Toluidine blue O stain distribution across the stem and to differentiate the major tissues.
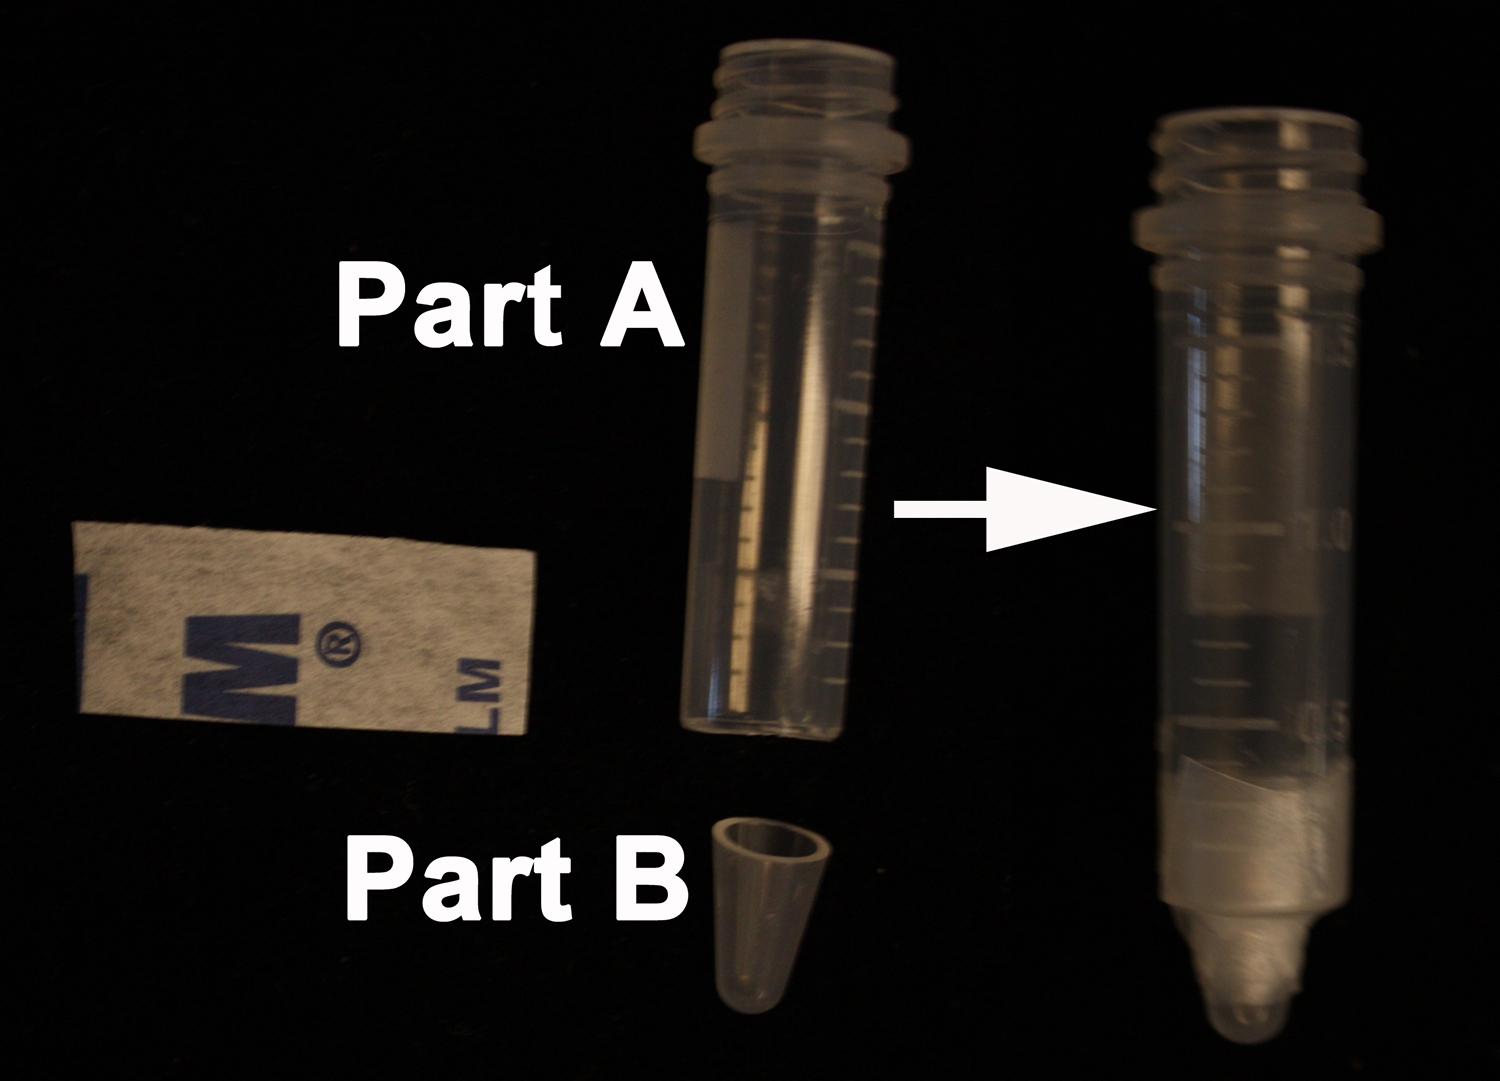
Figure 1. Homemade mold for embedding the stems. On the left side; top of the 2 ml screw-cap microcentrifuge tube (Part A) and the bottom from the 0.6 ml microcentrifuge tube (Part B). On the right side; the Parafilm holding the two parts; A and B to form the final mold.
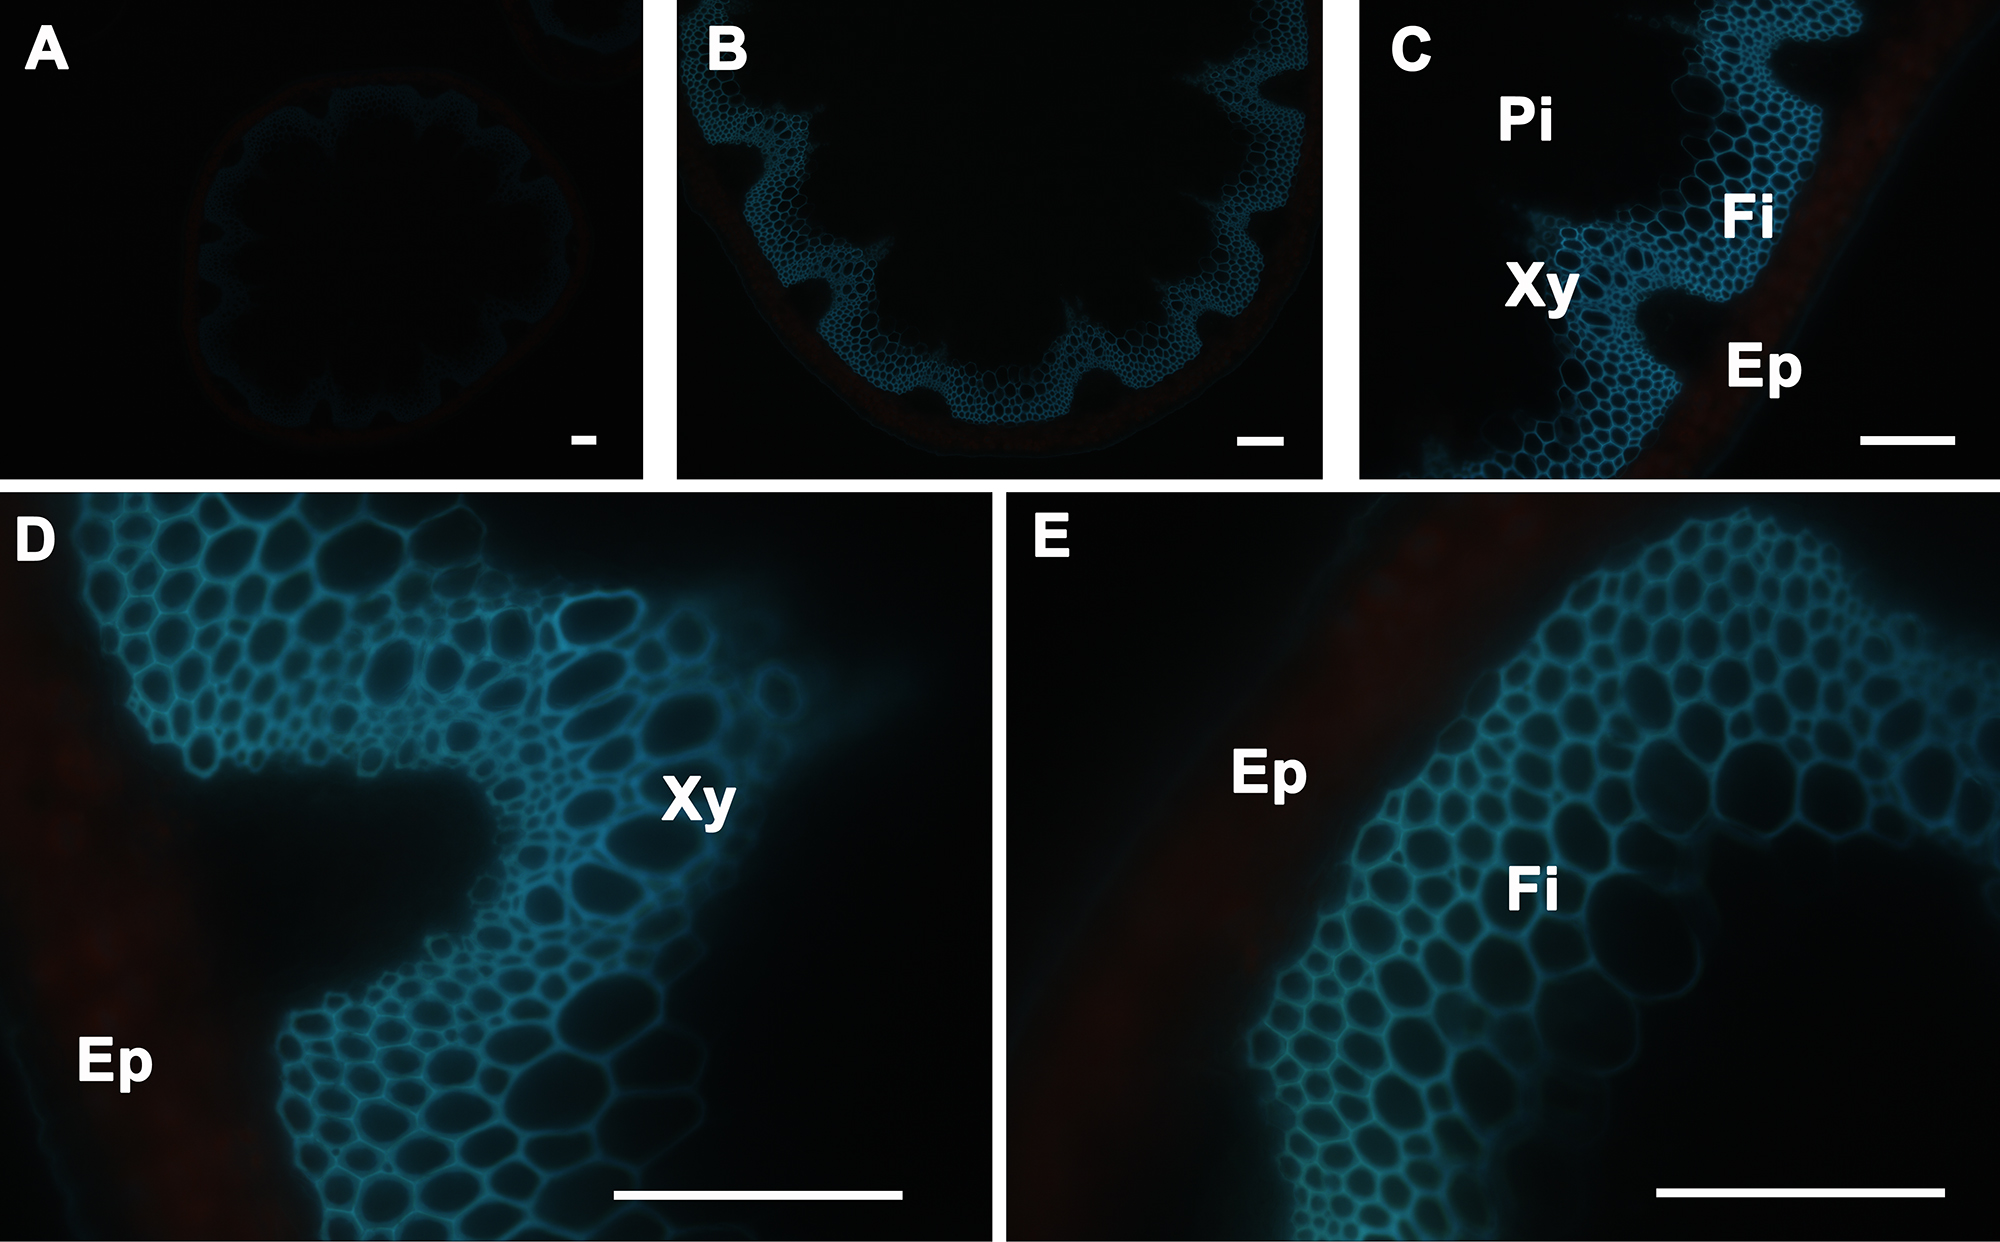
Figure 2. UV Fluorescence of A. thaliana stem cross-sections. Transverse sections of a wild type A. thaliana stem under UV light fluorescence showing the presence of aromatic compounds, including lignin, only in the walls of interfascicular fibers and xylem cells (A–E). The positions of the epidermis and cortex (Ep), interfascicular fibers (Fi), pith (Pi), and xylem (Xy) are indicated. Magnifications: Panel A: 5X; Panel B: 10X; Panel C: 20X; Panels D and E: 40X. Bar = 100 µm.
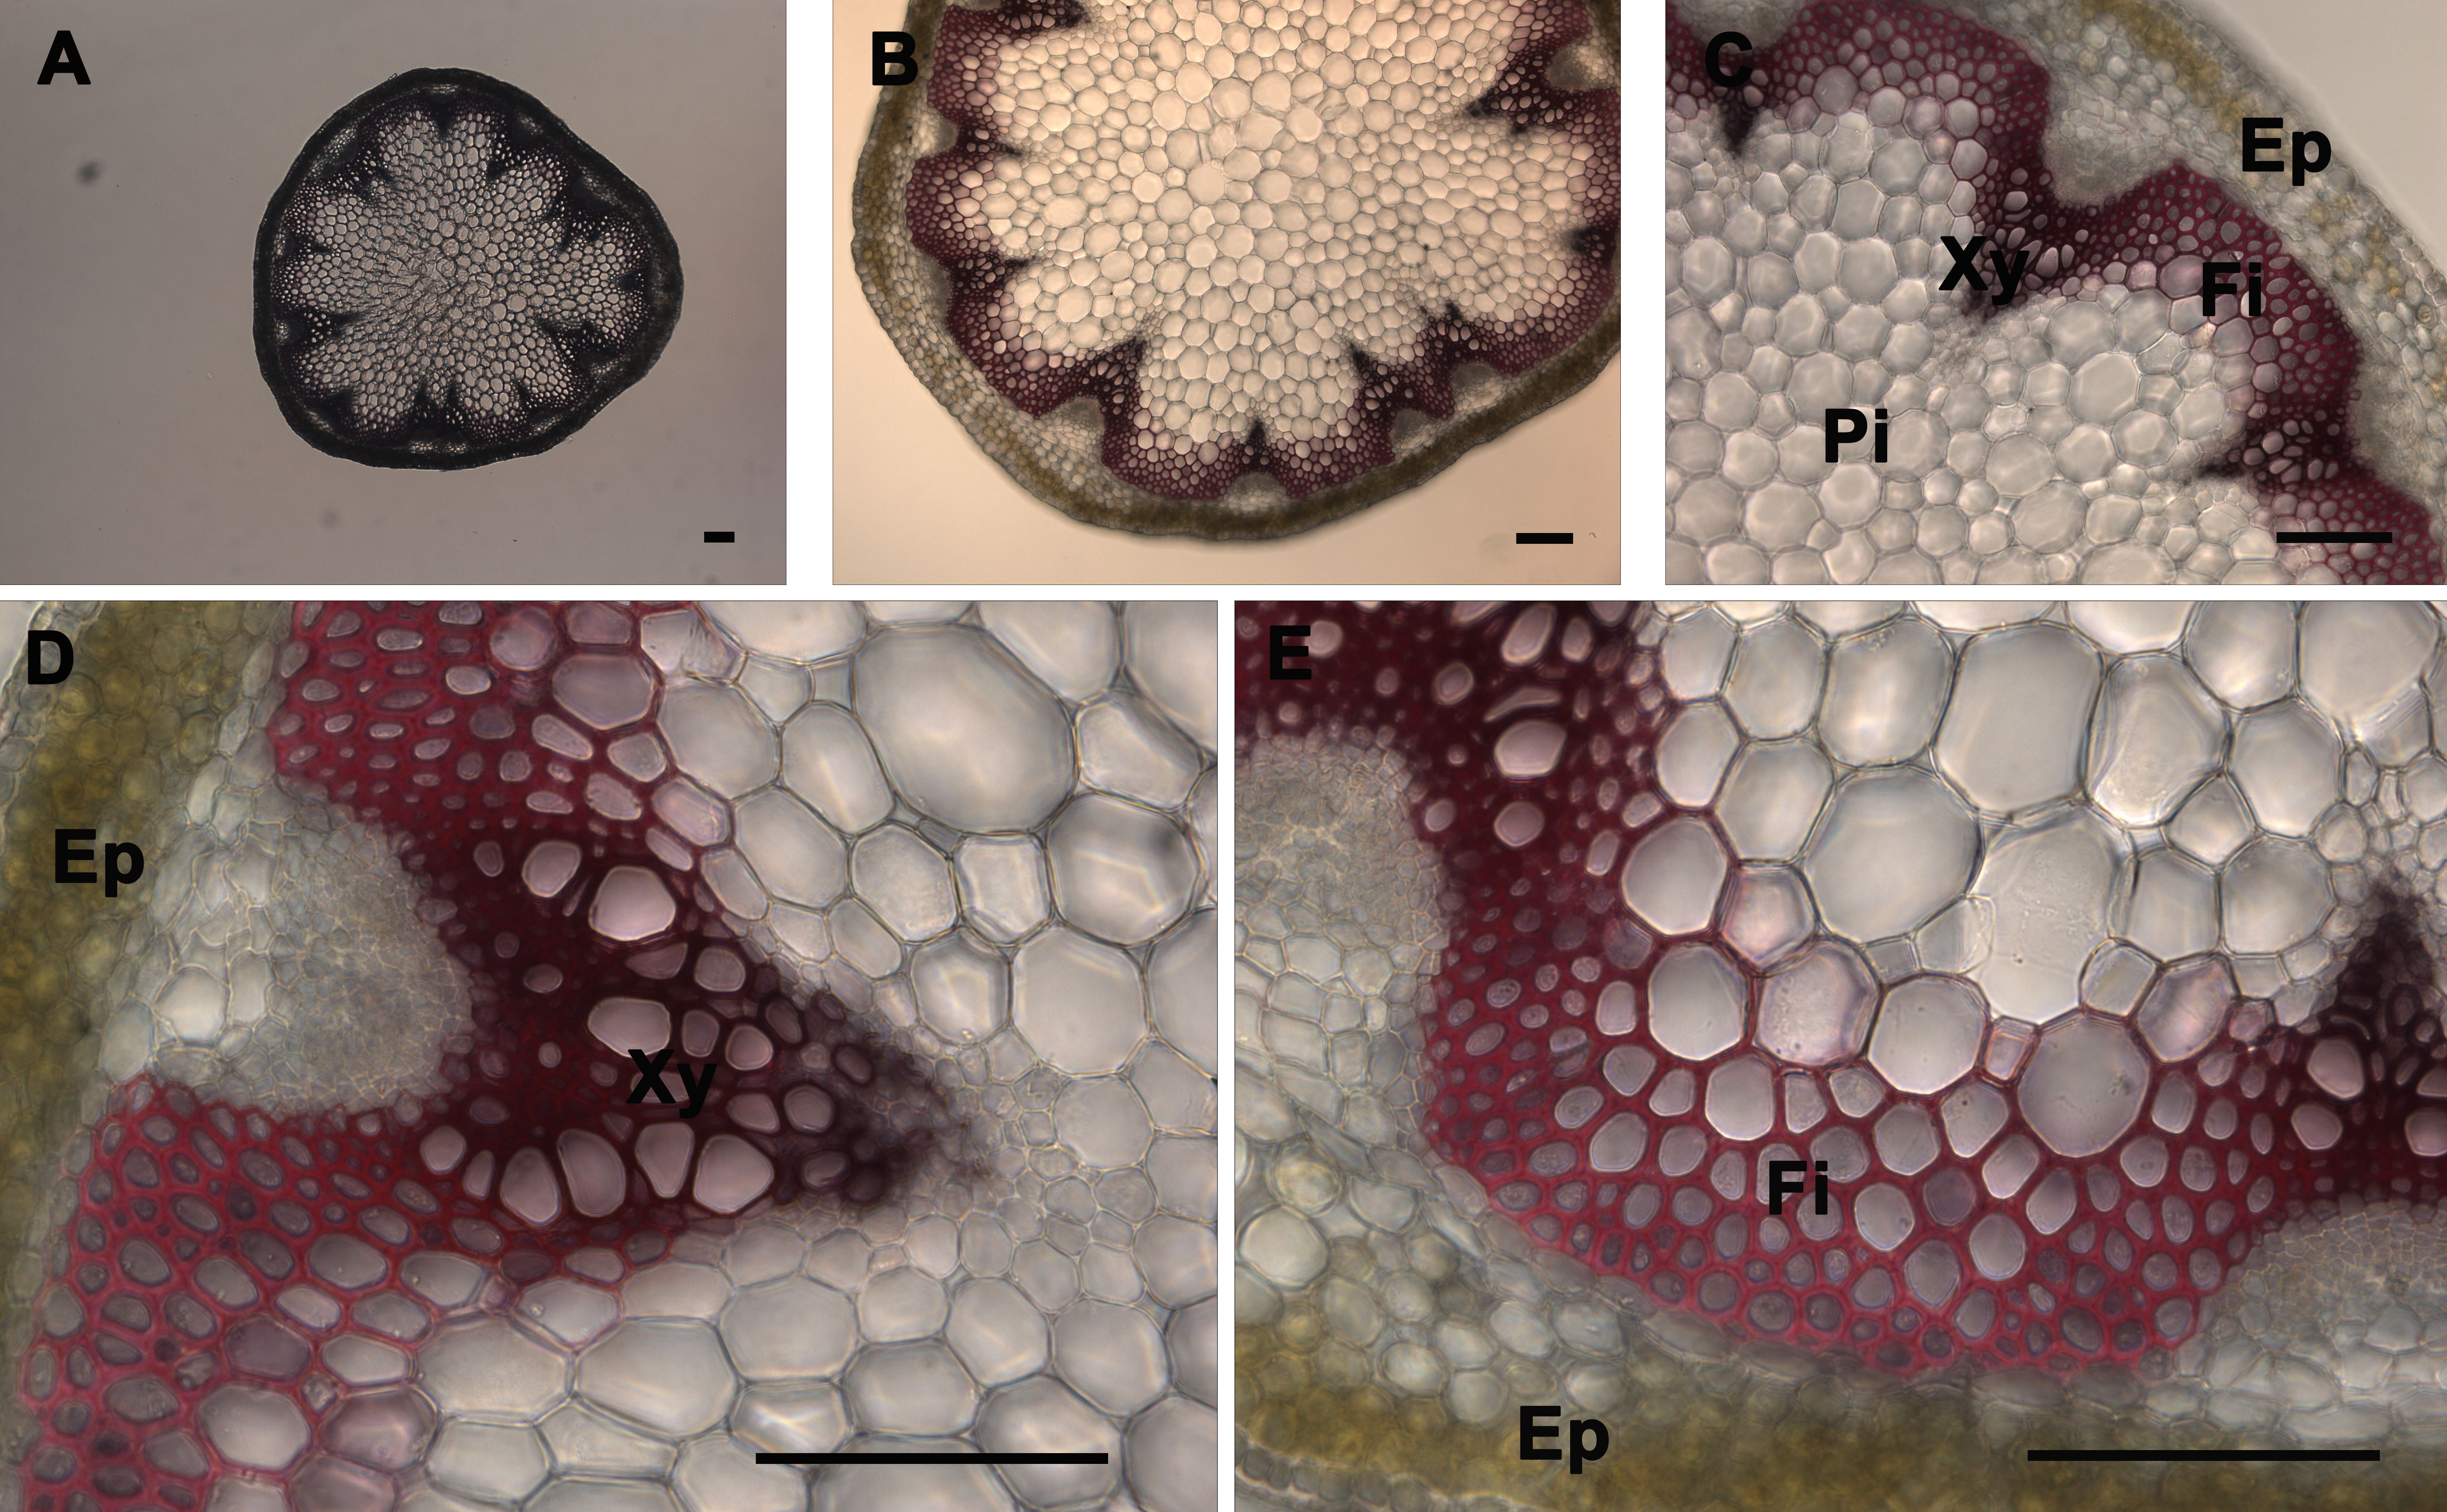
Figure 3. Phloroglucinol-HCl staining of A. thaliana stem cross-sections. Phloroglucinol-HCl staining (pink or fuchsia color) of a wild type A. thaliana stem section showing the normal lignin deposition in the walls of interfascicular fibers and xylem cells (A–E). The positions of the epidermis and cortex (Ep), interfascicular fibers (Fi), pith (Pi), and xylem (Xy) are indicated. Magnifications: Panel A: 5X; Panel B: 10X; Panel C: 20X; Panels D and E: 40X. Bar = 100 µm.
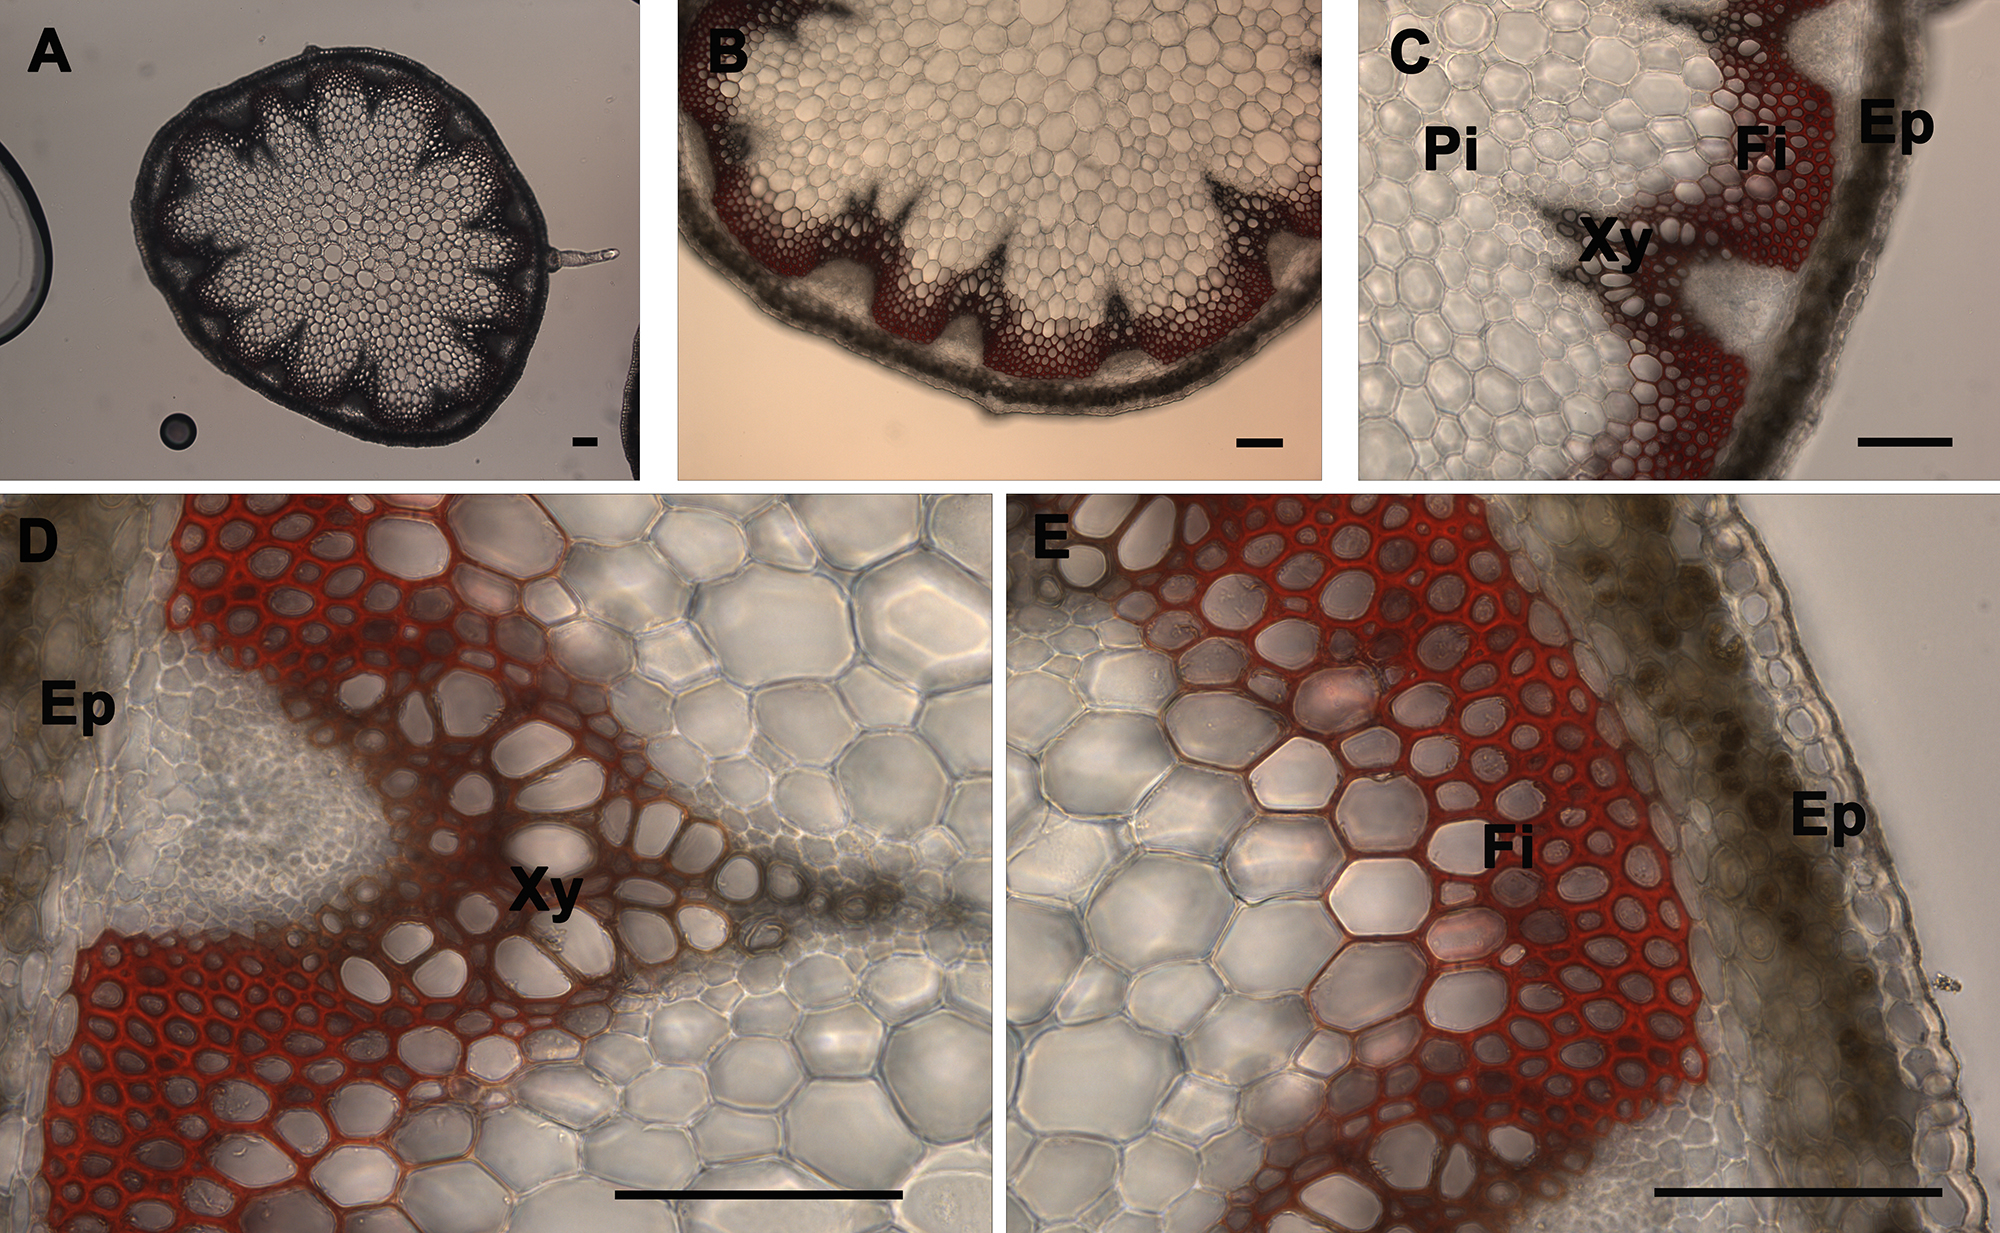
Figure 4. Mäule staining of A. thaliana stem cross-sections. Mäule staining (red color) of a wild type A. thaliana stem section showing the normal lignin deposition in the walls of interfascicular fibers and xylem cells (A–E). The positions of the epidermis and cortex (Ep), interfascicular fibers (Fi), pith (Pi), and xylem (Xy) are indicated. Magnifications: Panel A: 5X; Panel B: 10X; Panel C: 20X; Panels D and E: 40X. Bar = 100 µm.
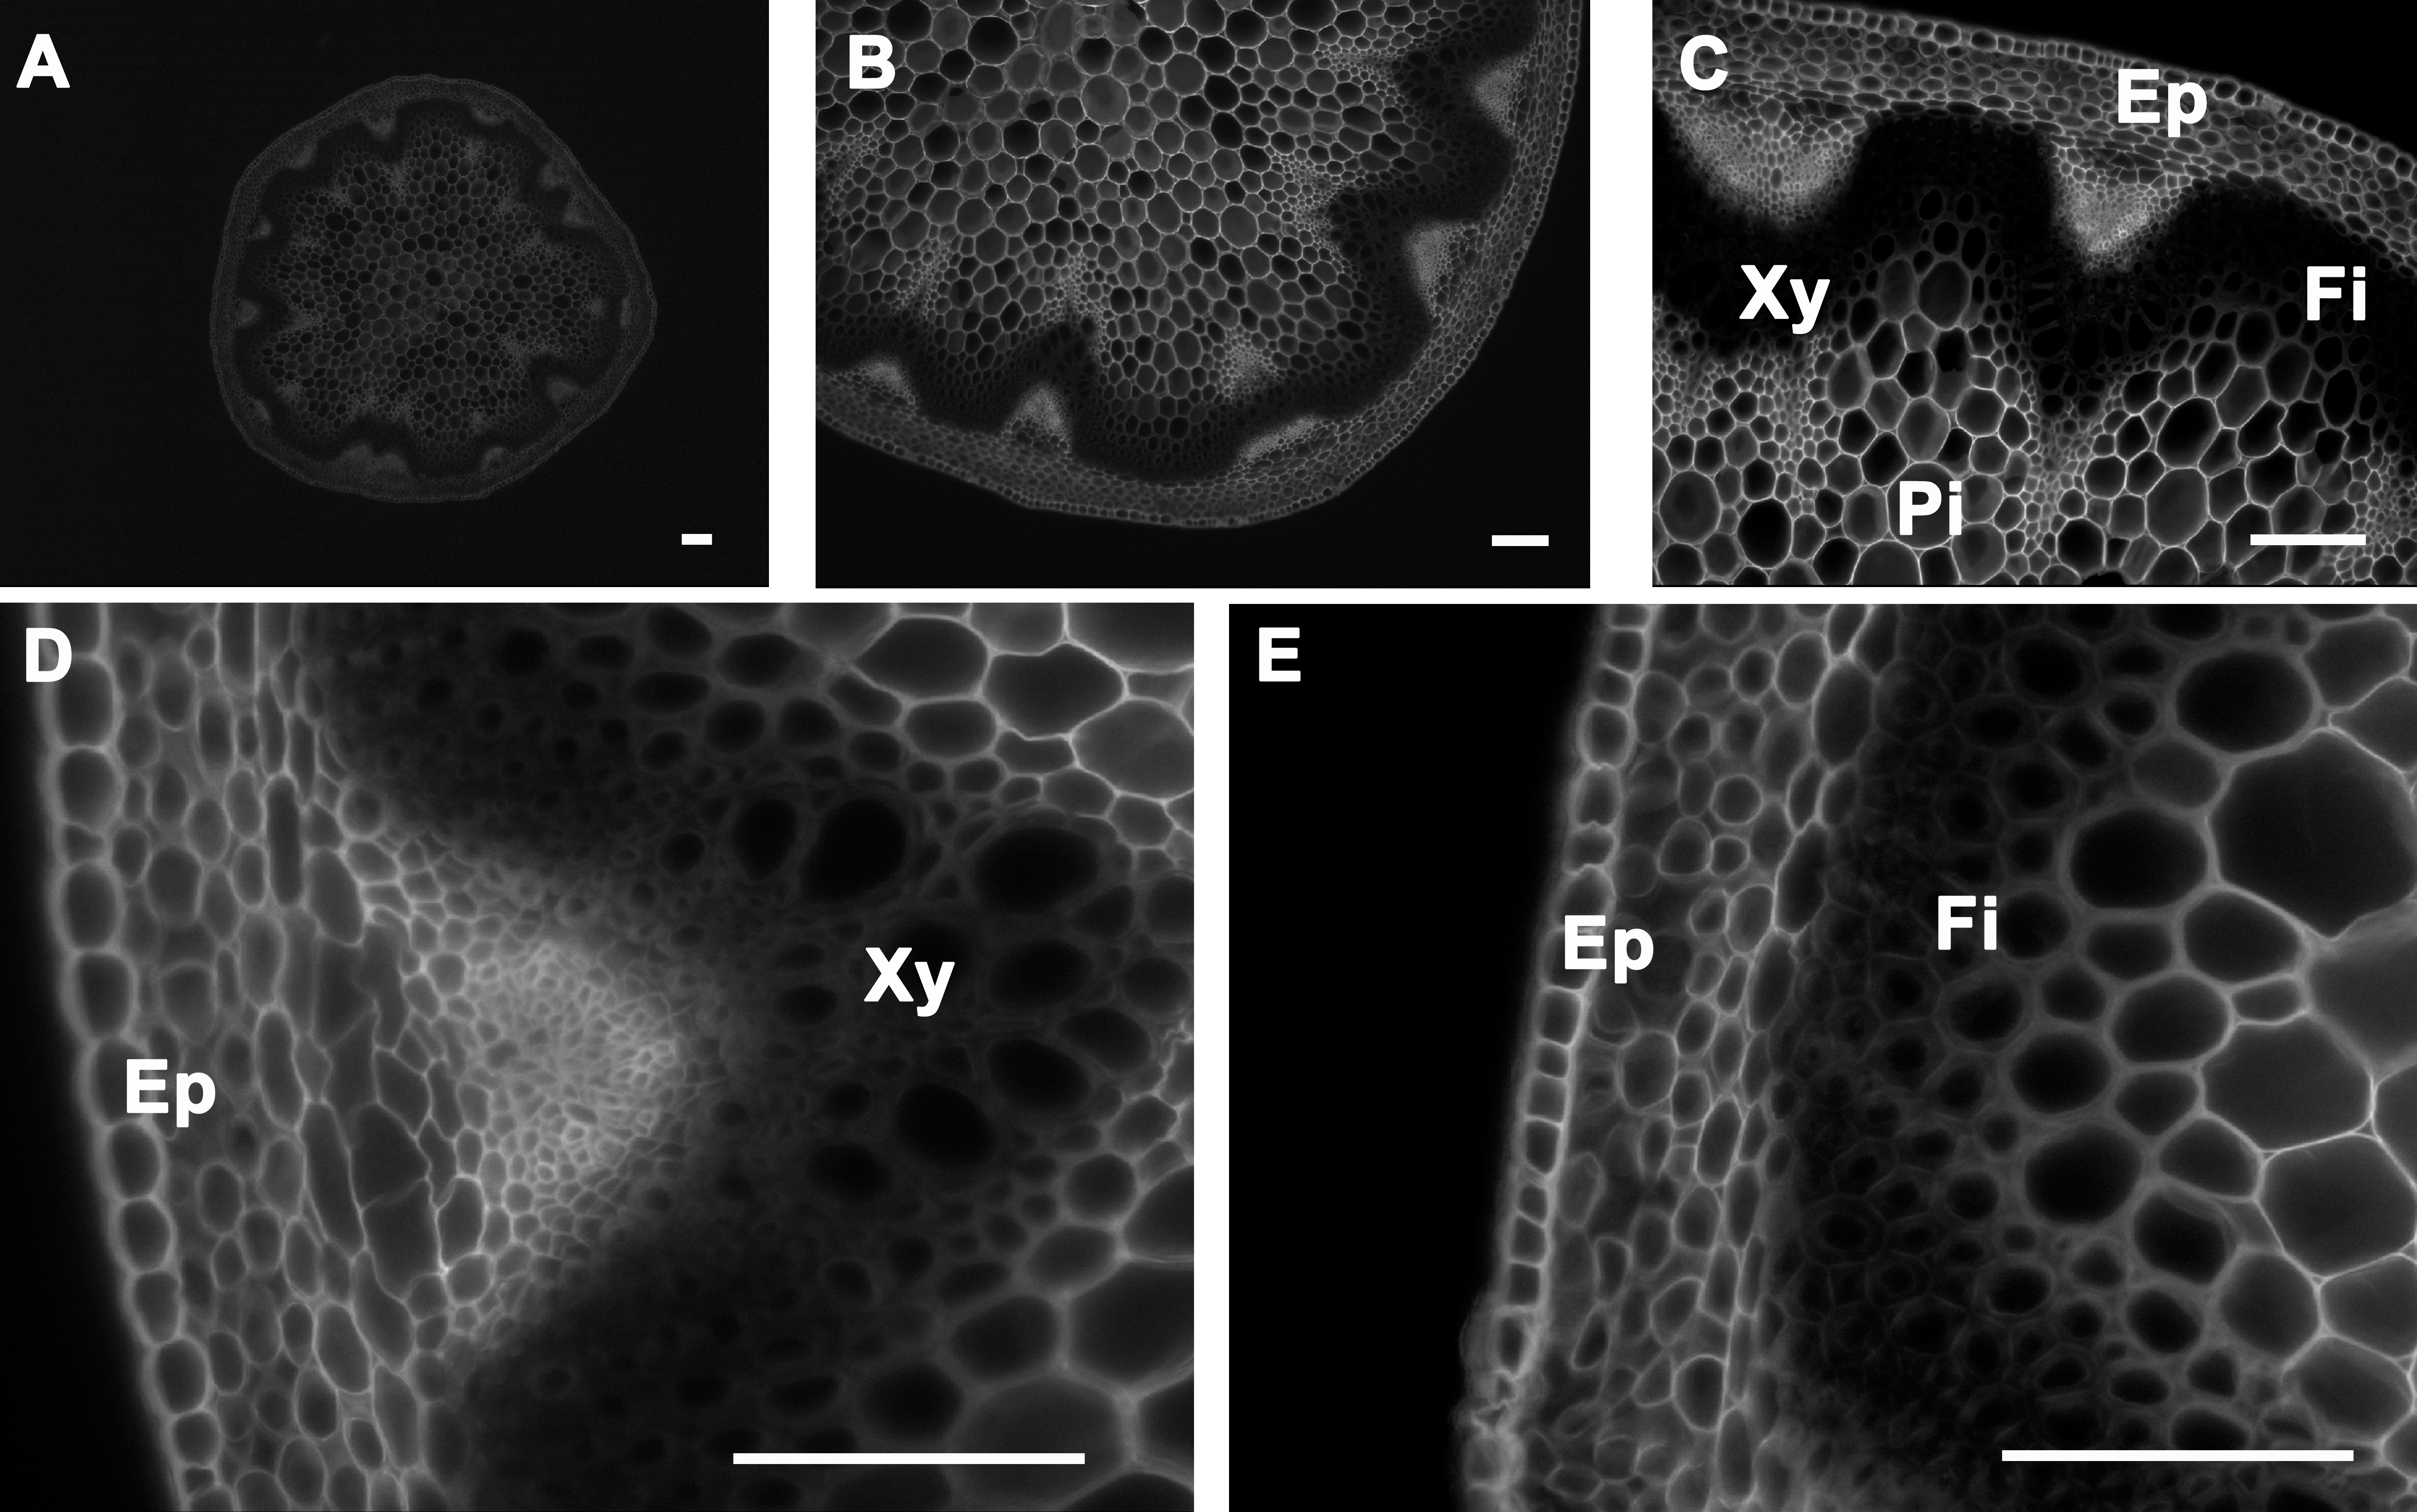
Figure 5. Calcofluor white staining of A. thaliana stem cross-sections. Calcofluor white staining of a wild type A. thaliana stem section showing cellulose deposition in the cell walls of cells of the epidermis, cortex, pith, interfascicular fibers, and xylem (A–E). The positions of the epidermis and cortex (Ep), interfascicular fibers (Fi), pith (Pi), and xylem (Xy) are indicated. Magnifications: Panel A: 5X; Panel B: 10X; Panel C: 20X; Panels D and E: 40X. Bar = 100 µm.
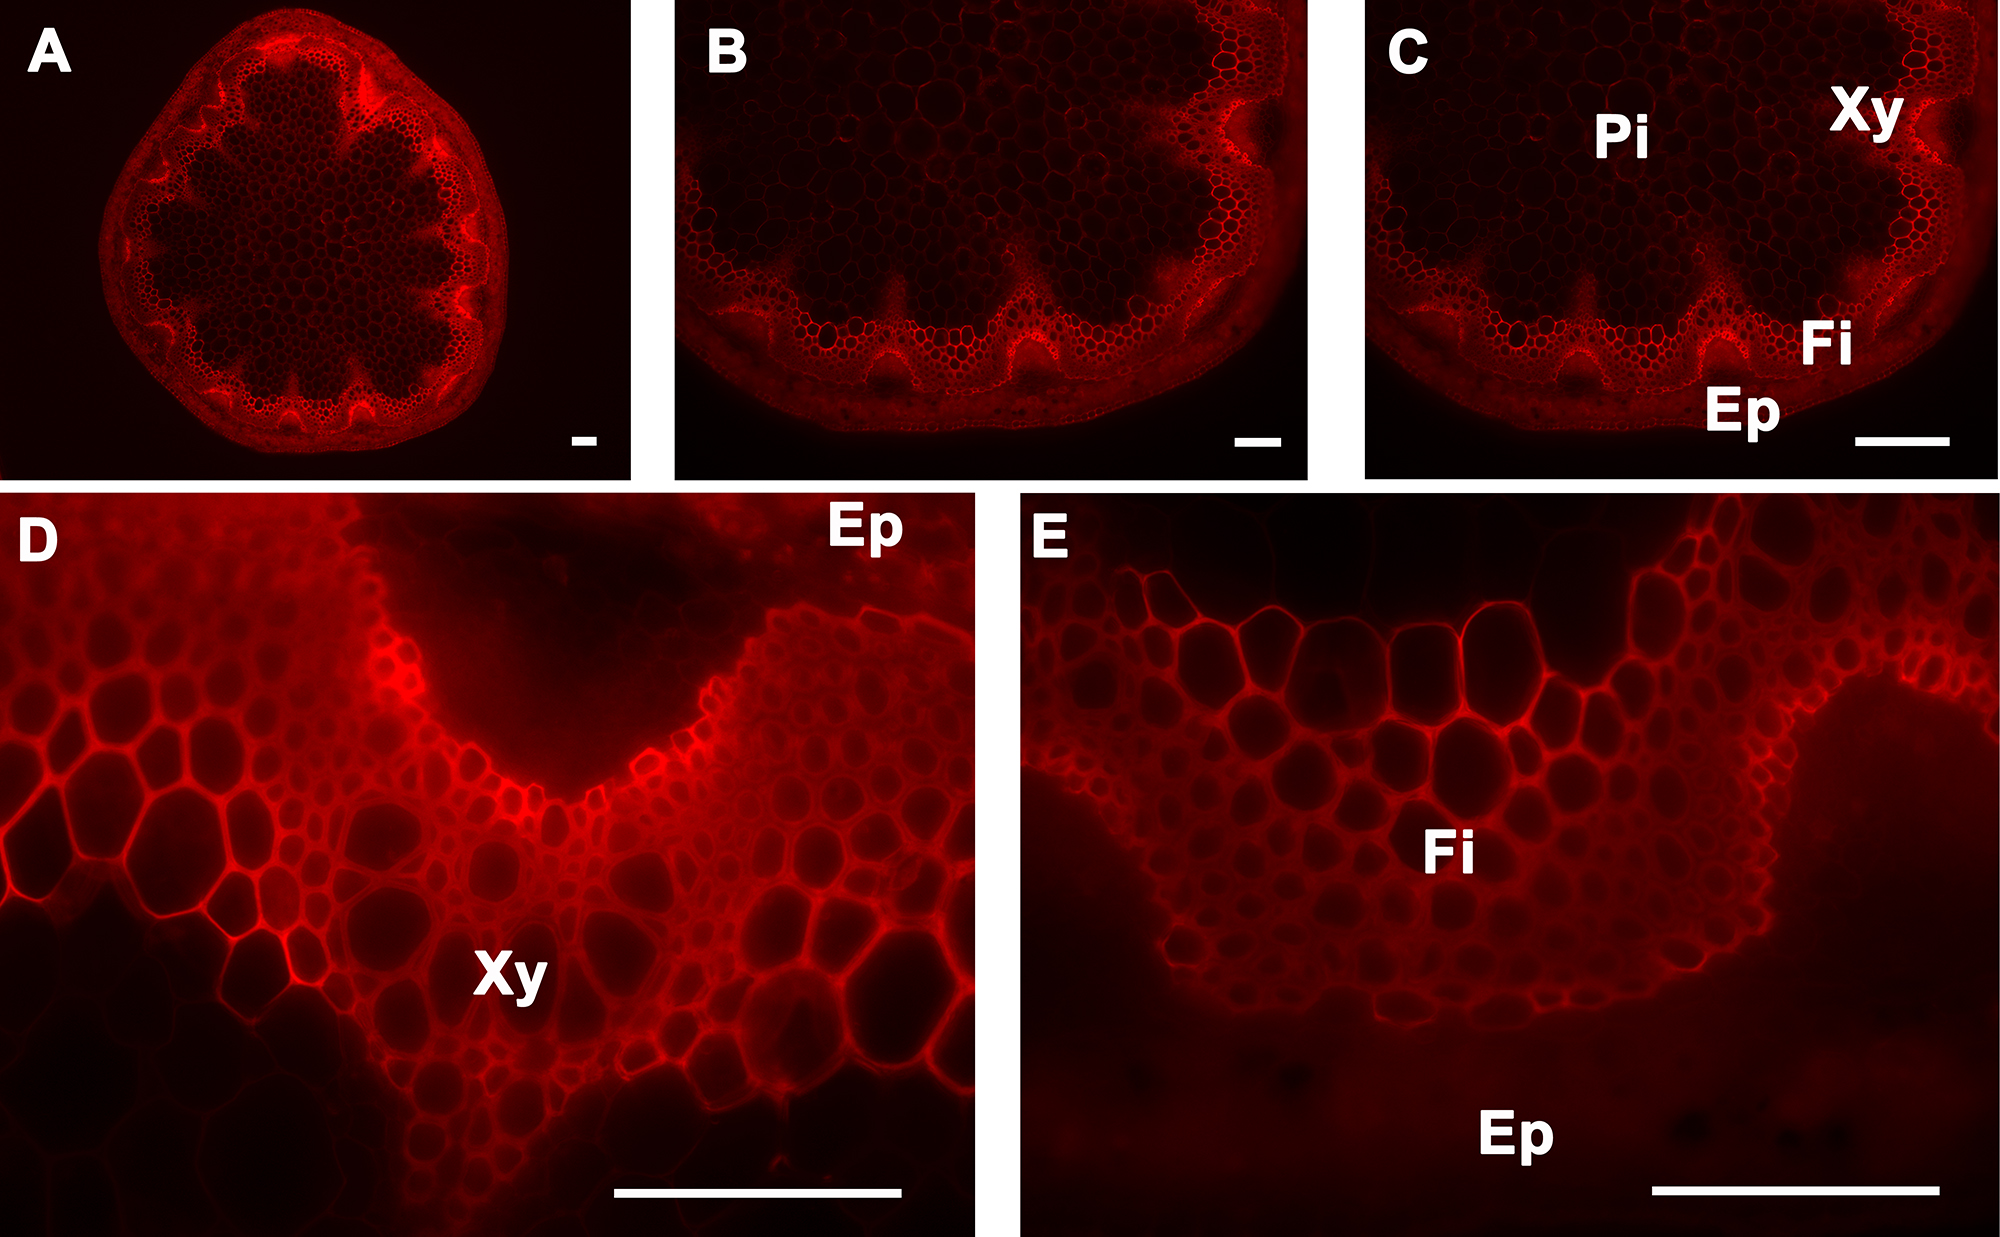
Figure 6. Congo red staining of A. thaliana stem cross-sections. Congo red staining of a wild type A. thaliana stem section showing cellulose deposition in the cell walls of cells of the epidermis, cortex, pith, interfascicular fibers, and xylem (A–E). The positions of the epidermis and cortex (Ep), interfascicular fibers (Fi), pith (Pi), and xylem (Xy) are indicated. Magnifications: Panel A: 5X; Panel B: 10X; Panel C: 20X; Panels D and E: 40X. Bar = 100 µm.
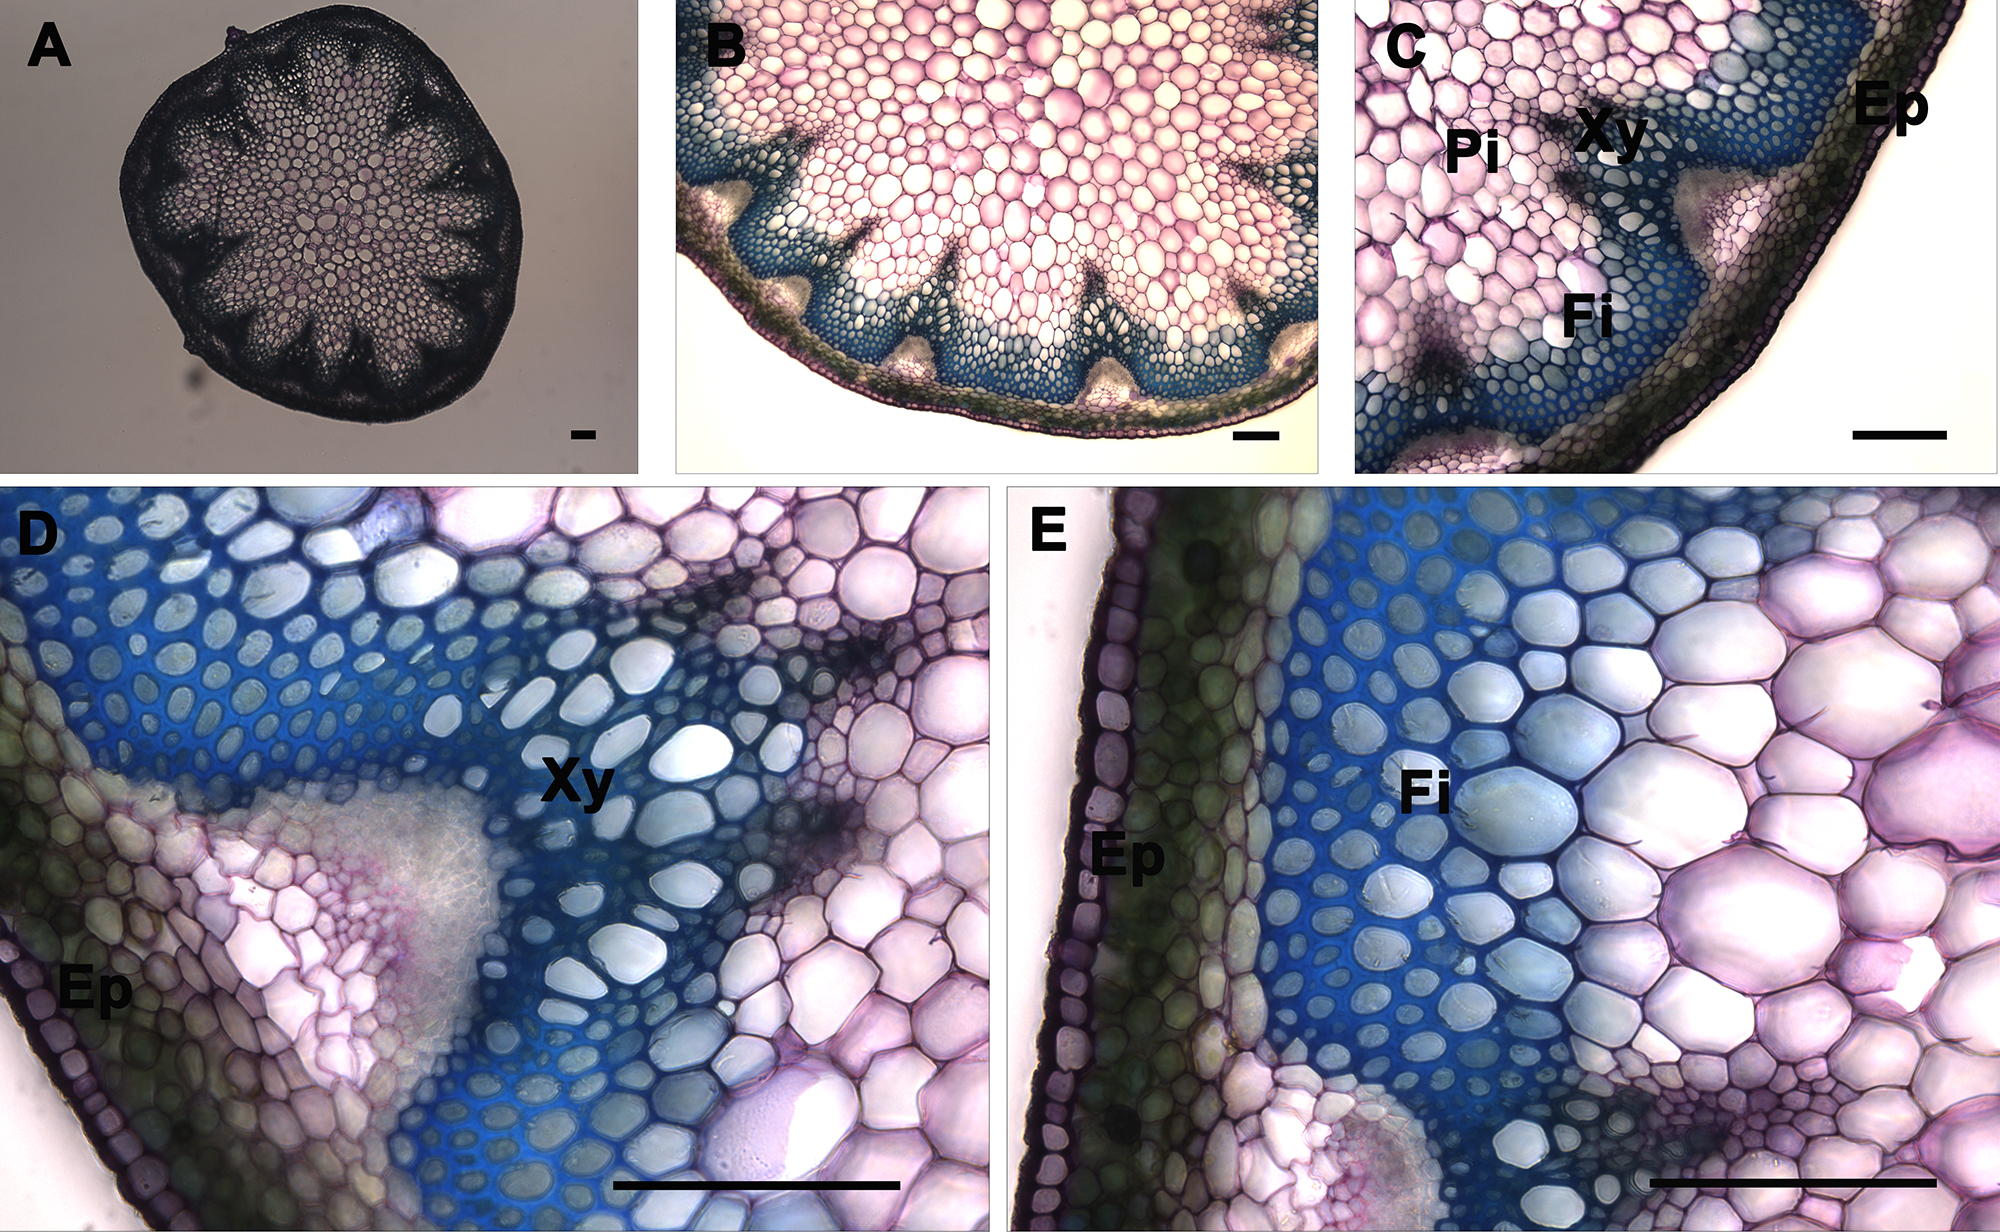
Figure 7. Toluidine blue O staining of A. thaliana stem cross-sections. Toluidine blue O staining of a wild type A. thaliana stem section showing the normal lignin deposition in the walls of interfascicular fibers and xylem cells (A–E). The positions of the epidermis and cortex (Ep), interfascicular fibers (Fi), pith (Pi), and xylem (Xy) are indicated. Magnifications: Panel A: 5X; Panel B: 10X; Panel C: 20X; Panels D and E: 40X. Bar = 100 µm.
Table 1. Microscope and camera settings for imaging. Guidelines for working with fluorescence filters and bright-field imaging. Please click here to view a larger version of this figure.
A. thaliana stem sections are widely used to study the organization of the cells in the secondary cell wall and to qualitatively examine the differences between wild type and transgenic plants. The commonly used techniques for sectioning the specimens are direct hand cutting; or when specimens are embedded in agarose or fixative, sectioning can be done with a vibratome or microtome. In contrast to hand cutting, the last two allow reducing the risk of producing inaccurate differences between samples that would be simply caused by a bad sample preparation caused by thickness differences between samples and uneven surfaces. All of these methods have their pros and cons. We chose embedding in agarose, followed by sectioning using a vibratome, and did so for the following reasons: The ease of embedding and time spent in using agarose eliminates the need for elaborate processing of fresh tissue. Also, our homemade molds are easy and cheap to make, can hold the stem straight, can be used over many years, and can help in easy release of specimens without making a mess. The best way to dissolve high-percentage agarose and get a homogenous solution (full dissolution of 7 g of agarose in 100 ml without forming chunky granules) is to autoclave it or to microwave it at the lowest intensity. It is important to cut the stem tissue fresh, or alternatively to store it in a plate placed on ice containing a filter paper wetted with water to prevent tissue dehydration and deformation. Storing the stem for periods longer than 30 min without high moisture will cause the stem to dry out. The temperature of the agarose right before the stem is embedded should be around 50 °C. It is critical to check for the presence of air bubbles after the agarose has been poured into the vial, because air bubbles cause gaps in the mold and consequently the sectioning will be uneven. Air bubbles can be removed quickly by placing the solution under vacuum prior pouring it. The stem should be placed in the agarose when it is still soft and not warmer than 50 °C. The heat will damage the sample by shriveling the stem and will destroy the cell morphology. If the agarose is too cold the stem will not penetrate through the agarose and embedding will not be possible. After agarose embedding, stem samples can be stored at 4 °C up to one week.
Use of a vibratome instead of hand-sectioning yields precisely cut specimens and better image quality. All safety instructions should be carefully read and followed while using a vibratome. It is important to ensure that the specimen disc is clean and dry to allow the tissue adhesive to hold the specimen strongly in place so it does not fall off during sectioning. The thickness of the specimens is specified to withstand the harsh acid and base treatments during staining procedures. The razor blade used in the vibratome should be completely flat to ensure that the section is cut evenly. Sectioning takes approximately 20 min per sample; in order to save time, similar specimens can be sectioned in groups on a single specimen plate. During sectioning, the sections are transferred from the buffer tray into a small Petri dish to make the sections easier to see on a clear background and to liberate the buffer tray for the next specimen. Sections can be immediately used for downstream staining procedures or stored for later use. Aliquoting the stem sections to 2.0 ml microcentrifuge tubes helps in the priming for staining procedures. Making correct adjustments and settings on the camera and microscope are very critical for achieving high quality images. Adjusting the Kohler illumination is one of the most important steps in the use of the microscope. The adjustments for aperture and light intensity, as described in the methods section, are meant only as a guideline. They may need to be modified depending on the microscope and camera utilized. We used a high-resolution digital camera with a large format interline CCD chip and no mechanical shutter for UV imaging, calcofluor white, and congo red staining; and a high-resolution and high-speed color camera for bright-field images of Mäule, phloroglucinol and toluidine blue O staining. Images were analyzed, processed and assembled using standard imaging software.
Phloroglucinol is the most commonly used stain for lignin determination; it is not a true lignin stain as it stains only cinnamaldehyde end-groups. The phloroglucinol stain, also known as Weisner stain, yields a characteristic cherry pink or fuchsia color in the xylem and interfascicular fibers where these aldehyde groups are present4. The intensity of the pink color varies with the extent of lignification. Although subtle differences are harder to observe, it is easy to spot differences between wild type and mutant stem sections that have variations in their lignin content19. It is also easy to observe differences between younger (towards the stem apex) and older (stem base) tissues, because lignification levels between such tissues vary. Usually in wild type stem, epidermis cortex and pith do not contain cinnamaldehydes (thus do not get colored) unless there is ectopic lignification20. Mäule stain, on the other hand, is specific toward syringyl lignin units and can be used to differentiate different lignin enrichments in S or G units (e.g. fiber versus xylem tissues)14,18. The potassium permanganate and hydrochloric acid act on the syringyl nucleus of the S unit in the lignin to form a methoxycatechol and then to methoxy-o-quinone following reaction with ammonium hydroxide. The Mäule stain is a good indicator for differentiating mutants that lack or are extensively depleted in S units of lignin (e.g. de A. thaliana f5h mutants and general gymnosperm plants), Mäule gives yellow-brown coloration instead of red in both the xylem and the sclerenchyma21. For the same reason, Mäule staining can be used to differentiate angiosperms, which primarily contain S lignin from gymnosperms that typically lack the S unit18. Because strong acid and base are used during phloroglucinol and Mäule staining procedures respectively, some experimental steps need to be performed with caution. Both concentrated HCl and ammonium hydroxide are strong corrosives; they can deteriorate the microscope stage and lens if the slides containing the Ph-HCl and Mäule stained samples are not handled properly. They can also dry up quickly, within 5-10 min, causing specimens to deteriorate, so the imaging has to be done rapidly. Toluidine blue O is a polychromatic stain and stains different components of the cell wall in different colors as it reacts with different chemical components of cell walls differently, producing a multi-colored specimen. The colors generated can provide information on the nature of the cell. Toluidine blue O is also a cationic dye that binds to negatively charged groups5,6. An aqueous solution of this dye is blue, but different colors are generated when the dye binds with different anionic groups in the cell. For example, the colors are a pinkish purple when the dye reacts with carboxylated polysaccharides such as pectin; green, greenish blue, or bright blue with aromatic substances such as lignin and tannins; and purplish or greenish blue with nucleic acids. The staining is easy and can last for two days.
Calcofluor white stains cellulose, callose, and other nonsubstituted or weakly substituted β-glucans6-9, and congo red stains directly to β-(1→4)-glucans and particularly to cellulose8,10,11. Calcofluor white stains brilliantly the epidermis, cortex, and pith but that brilliance is significantly reduced in xylem and interfascicular fibers. There are two possible explanations for the reduced fluorescence of calcofluor white in heavily lignified tissues; one attributes it to the presence of lignin, which would, in turn reduce the ability of calcofluor white to diffuse properly through to the polysaccharides. A second explanation points to a partial quenching of the fluorescence emitted by the calcofluor white excited under UV. In contrast to calcofluor white, congo red staining seems less affected by the presence of lignin. It could be related to the difference in fluorescence properties between calcofluor white and congo red; a better diffusion capability of congo red through the lignified tissues than calcofluor white; or a slight difference in polysaccharide binding properties22. It is important to note that the sections stained with congo red should not be stored too long before imaging, because congo red tends to get washed away in water.
Although histochemical staining is neither quantitative nor absolutely conclusive, it can reveal through visual cues a wealth of information about important traits such as the integrity of tissues or abnormal cell wall deposition and lignification. The staining techniques described above are easy to perform and are applicable for critical elements in a plant cell wall, such as lignin and cellulose. By contrast, immunofluorescence using specific antisera and monoclonal antibodies is required for detection of various components of hemicelluloses and pectin. This report is meant to serve as a primer for beginners in the field of secondary cell wall staining who use A. thaliana as their model system.
The authors have nothing to disclose.
We are thankful to Sabin Russell for editing assistance. This work was part of the DOE Joint BioEnergy Institute (http://www.jbei.org) supported by the U. S. Department of Energy, Office of Science, Office of Biological and Environmental Research, through contract DE-AC02-05CH11231 between Lawrence Berkeley National Laboratory and the U.S. Department of Energy.
Agarose | EMD | MERC2125 | CAS Number: 9012-36-6 |
Phloroglucinol | Sigma | P 3502 | 1,3,5-trihydroxybenzene [CAS Number: 108-73-6] |
Hydrochloric Acid | EMD | HX0603-75 | CAS Number: 7647-01-0 |
Ammonium hydroxide | EMD | AX1303-6 | CAS Number: 1336-21-6 |
Toulidine Blue O | Sigma | T3260 | Blutene chloride, Tolonium Chloride [CAS Number 92-31-9] |
Potassium permanganate | Sigma | 223468 | CAS Number 7722-64-7 |
Ethanol 190 proof | KOPTEC | V1401 | CAS Number: 64-17-5 |
Congo Red | Sigma | C6277 | Disodium 3,3'-[[1,1'-biphenyl]-4,4'-diylbis(azo)]bis(4-aminonaphthalene 1-sulphonate) [CAS Number 573-58-0 ] |
Fluorescent Brightener 28/ Calcofluor White Stain | Sigma | F3543 | 4,4'-Bis[4-[bis(2-hydroxyethyl)amino]-6-anilino-1,3,5-triazin-2-yl]amino]stilbene-2,2'-disulphonic acid [CAS Number 4404-43-7] |
Vibratome | Leica | Leica Vibrating blade microtome VT1000S | http://www.leicabiosystems.com/products/sectioning/vibrating-blade-microtomes/details/product/leica-vt1000-s/ |
Razor | American Safety razor company | Item # 60-0139-0000 | Stainless Steel Double Edge Blade (Personna Super) |
Screw Cap Microcentrifuge Tubes (2ml) | VWR | 16466-044 | |
Microcentrifuge Tubes (0.6ml) | Axygen Scientific | MCT-060-C | |
Mitt | Bel-Art | 380000000 | SCIENCEWARE Hot Hand Protector Mitt |
Tissue adhesive | Ted Pella Inc | 10033 | Store at 4°C or 20°C for 3 months or longer storage |
Microwave | Panasonic | NN-SD762S | PELCO Pro CA 44 Instant tissue adhesive |
Camera with CCD chip with no mechanical shutter | Hamamatsu | C4742-95 | |
High speed color camera | QImaging | MicroPublisher 5.0 RTV | |
Camera software | Molecular Devices | MetaMorph version 7.7.0.0 | |
Imagining anaylsis | Adobe | Photoshop CS4 | |
Micro Cover Glasses, Square, No.1 | VWR | 48366-067 | 22 x 22 mm (7/8 x 7/8")-Cover glasses are corrosion-resistant and uniformly thick and flat. No. 1 thickness is 0.13 to 0.17mm. |
Frosted Micro Slides, 1mm | VWR | 48312-003 | 75 x 25 mm- 1mm |
TX2 Filter cube | Leica | 11513851/11513885 | Filter used for Congo red analysis with a band-pass of 560/40. |
Parafilm M | Alcan packaging | BRNDPM998 |