Part 1: Feeding and Management of flies
- Flies should be grown in bottles containing yeast-free standard media. You will need large numbers of flies, so crosses need to be set up accordingly. Flies should be grown in a 12-hour light:dark cycle at 25ºC.
- Flies should be collected soon after eclosion (1-3 days). Flies can be worked with at this stage using a carbon dioxide diffuser, and should be sorted into test tubes containing autoclaved or yeast-free media. We use males only, stored 10 to a test tube.
- Allow at least a day or two after use of carbon dioxide before running the behavioral experiments. We run flies in our behavioral assay 3-5 days following ECLOSION.
- Assays should always be done within the same 2-3 hour time window each day to avoid circadian rhythm issues.
Part 2: Setting up the tracking system in a controlled environment
- All experiments are done in an environment room which maintains a constant temperature of 25ºC with 70% humidity.
- Suspend a digital video camera over the area to be recorded (camera facing downwards). Since our tracking software is contrast-based, we suspend the camera over a light box. The camera records videos directly onto a Dell computer via a firewire connection. We use a Sharp digital video camera, hooked up to a Dell computer with Windows Moviemaker (Vista version) for video acquisition.
- Air pulses will be administered in this protocol, so a source for air flow must be present in the room. Using rubber tubing, connect the air source to a carbon filter for air filtration.
- Using more rubber tubing, connect the other side of the carbon filter to an Erlenmeyer flask via a hollow rubber stopper, and fill the flask with about a half inch of water. This will humidify the air.
- The flask should also have a sidearm, which will connect to a Y-shaped valve via rubber tubing.
- One branch of the Y-valve should be connected to a flowmeter. The other branch should deliver air to the square locomotion chamber.
Part 3: Delivering flies to the locomotion chamber
- The square locomotion chamber is based on the design from Wolf et al. 20021, with the addition of small drop trays to prevent the flies from flying within the chamber. The chamber should be taken apart, and all components should be thoroughly wiped down with 70% ethanol and dried before use.
- Anesthesia immediately before conducting a behavioral assay can potentially compromise performance. To avoid this, flies are gently knocked into the chamber using a funnel with a small outlet. To make an outlet of the right size, attach a blue pipette tip (for P1000) to the end of a funnel. Use scissors to cut off the very end of the pipette tip to make the opening big enough for a fly to pass through.
- The top of our chamber is a small piece of plexiglass secured by screws around the edges. When the screws are removed, the holes can be used to deliver flies into the chamber. Position the plexiglass top so that the screw hole sits directly over the inner chamber instead of where a screw normally sits. Take a test tube containing the flies and place it upside down over the funnel, which should then be placed into the screw hole.
- Do NOT move the funnel, as this could hurt or damage the flies. Instead, gently bang the whole chamber, funnel and all, until all flies are inside the chamber. This knocking should be done on a mouse pad to absorb the shock of this banging. When flies are inside, remove the funnel, and re-position the plexiglass top over the screw beds. Then re-screw the plexiglass top into place.
Part 4: Running the Locomotor Assay
- Once the flies are properly loaded, let them acclimate in the chamber for 30 minutes. This acclimation period should take place in the controlled environment (25ºC, 70% humidity), and the chamber should be placed on top of the light box (which should be turned on). Turn other room lights off.
- Following the acclimation period, switch the Y-valve in the air flow system such that the air will only flow to the flowmeter. Turn on the air, and ramp the air up to the desired speed (4.0-6.0 L/min). We generally use 5.0-5.5 L/min, but any speed in that range will work.
- Once the desired airspeed is attained, switch the Y-valve so that the air flows to the locomotion chamber. Time this air pulse for 15 seconds, and then abruptly turn the air off. As you turn the air off, switch the camera to record mode. (This part takes practice to do all at once).
- Stop the recording after the desired time and SAVE. We record 30 second trials at 10 frames per second (at least 8 trials per genotype).
Part 5: Analysis of Videos
- We use the Dynamic Image Analysis System (DIAS) software 3.2 for motion tracking2. In order to use this software, we first convert our videos to an AVI file format with Quicktime 7.5.5.
- To track the flies based on contrast, we use the “Autotrace by Threshold” function. We then use the “Make Path from Trace” function to digitize these traces.
- To output the instantaneous speeds of each fly, we use the “Compute Parameters” function to produce a database file (DIAS-specific). Using this function, we also smooth the data using a “5,15,60,15,5” Tukey Smoothing Window.
- Once this information is outputted as a database file, it can be opened in Microsoft Excel. We use a Matlab script to compile the instantaneous speeds within excel and calculate additional parameters necessary for understanding movement dynamics and bout structure.
Representative Results:
Figure 1 shows representative traces from wild type Canton S organisms (Figure 1, left panel) and flies null for the dCASK gene which were generated by crossing two large overlapping deletions (Df(3R)x307 and Df(3R)x313) (Figure 1, right panel). dCASK null flies have previously been shown to have locomotor problems using Buridan’s Paradigm3, and in our paradigm, compared to Canton S, they show greatly decreased locomotion. We always run wild type organisms first to make sure that conditions and behavior are within the normal range on a given day. We have observed deviations from standard responses in less than 5% of testing days. These differences can usually be attributed to problems with parameters of our controlled environment.
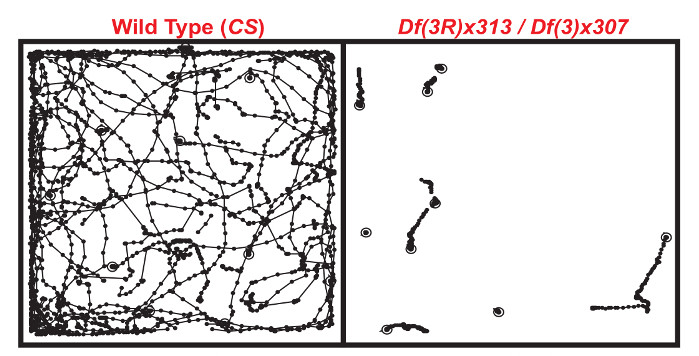
Figure 1. DIAS-generated traces of both Canton S wild type flies (above, left) and Locomotor-deficient dCASK Null flies generated from overlapping deletions (above,right). The traces represent what is seen in the recorded videos. Both pictures contrain traces from 8-10 flies run for 30 seconds in the video tracking assay following an air pulse.
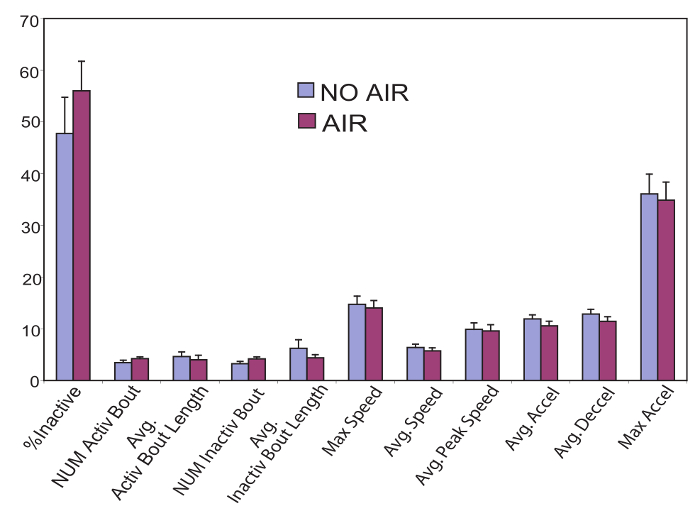
Figure 2. Wild type flies were run in the locomotor assay (above) following an air pulse (purple bars) and without an air pulse (blue). In all parameters calculated by the analysis program, there were no significant differences between the two conditions (determined with two-tailed student t-test). This demonstrates that following an air pulse, flies locomote normally in our setup.
