Sequencing Small Non-coding RNA from Formalin-fixed Tissues and Serum-derived Exosomes from Castration-resistant Prostate Cancer Patients
Summary
Therapy resistance often develops in patients with advanced prostate cancer, and in some cases, cancer progresses to a lethal subtype called neuroendocrine prostate cancer. Assessing the small non-coding RNA-mediated molecular changes that facilitate this transition would allow better disease stratification and identification of causal mechanisms that lead to development of neuroendocrine prostate cancer.
Abstract
Ablation of androgen receptor (AR) signaling by androgen deprivation is the goal of the first line of therapy for prostate cancer that initially results in cancer regression. However, in a significant number of cases, the disease progresses to advanced, castration-resistant prostate cancer (CRPC), which has limited therapeutic options and is often aggressive. Distant metastasis is mostly observed at this stage of the aggressive disease. CRPC is treated by a second generation of AR pathway inhibitors that improve survival initially, followed by the emergence of therapy resistance. Neuroendocrine prostate cancer (NEPC) is a rare variant of prostate cancer (PCa) that often develops as a result of therapy resistance via a transdifferentiation process known as neuroendocrine differentiation (NED), wherein PCa cells undergo a lineage switch from adenocarcinomas and show increased expression of neuroendocrine (NE) lineage markers. In addition to the genomic alterations that drive the progression and transdifferentiation to NEPC, epigenetic factors and microenvironmental cues are considered essential players in driving disease progression. This manuscript provides a detailed protocol to identify the epigenetic drivers (i.e., small non-coding RNAs) that are associated with advanced PCa. Using purified microRNAs from formalin-fixed paraffin-embedded (FFPE) metastatic tissues and corresponding serum-derived extracellular vesicles (EVs), the protocol describes how to prepare libraries with appropriate quality control for sequencing microRNAs from these sample sources. Isolating RNA from both FFPE and EVs is often challenging because most of it is either degraded or is limited in quantity. This protocol will elaborate on different methods to optimize the RNA inputs and cDNA libraries to yield most specific reads and high-quality data upon sequencing.
Introduction
Prostate cancer is driven by androgens acting via AR signaling. Therefore, targeting the AR pathway is the mainstay treatment for the disease1. However, resistance often ensues as a result of targeted therapies and the disease progresses to an advanced metastatic CRPC2. CRPC is treated by second generation of AR therapy that includes enzalutamide and abiraterone2,3 which improves survival initially. However, lethal variants such as NEPC often emerge in 25−30% of treated CRPC cases that have limited treatment options, leading to increased mortality3. NEPC arises via a reversible transdifferentiation process known as NED, wherein PCa cells undergo a lineage switch from adenocarcinomas and show decreased expression of AR and increased expression of NE lineage markers including enolase 2 (ENO2), chromogranin A (CHGA), and synaptophysin (SYP)4. Given that these resistance variants arise as a result of therapeutic interventions, it is essential to decipher pathways that lead to generation of this deadly, hard to treat form of PCa.
The genomics of NEPC was recently deciphered in an exhaustive study done by Beltran et al. whereby copy number alterations, mutations, single nucleotide polymorphisms (SNPs), and DNA methylation from patient-derived metastatic tissues were analyzed5. Despite significant advancement in the understanding of the genomics of this aggressive form of PCa, little is known about the epigenetic factors, including the small non-coding RNAs (microRNAs) that are involved in the transition of CRPC-adenocarcinoma to NEPC. MicroRNAs (miRNAs) are 22 bp long, double-stranded RNAs that act primarily by suppressing gene expression post-transcriptionally by sequence-specific interactions with the 3′-untranslated regions (UTRs) of cognate mRNA targets6. Several oncomiRs and tumor suppressors have now been identified, and their role in regulating disease onset and metastasis has been well studied in different cancers6,7. These small non-coding RNAs often serve as very important targets in controlling disease mortality6,8,9. More recent research has been focused on understanding the paracrine effects of miRNAs in cancer metastasis via their transport in EVs, such as exosomes, that flow in the bloodstream and allow tumor cells to send these secondary messengers to metastatic locations in a nuclease-free environment10,11,12. EVs carry miRNAs from the tumor cells to transfer the transforming effects from the host cells12. Identification of EVs as secondary messengers of tumor cells can therefore be useful in noninvasive detection of disease severity.
The miR-1246 is highly upregulated in EVs from aggressive PCa, and it indicates the disease severity13. These EV-associated miRNAs not only serve as noninvasive biomarkers of the disease, but also play functionally important roles in driving tumorigenesis. Thus, it essential to understand the significance of the miRNA repertoire that is associated with resistant forms of PCa to allow better identification of noninvasive biomarkers as well as their functional significance.
The advent of next generation sequencing has offered the most comprehensive platform to study the details of tumor landscape involving alterations in the genome such as mutations, chromosomal relocations, chromothripsis, and methylation, all of which contribute significantly to the form and nature of cancer14,15,16. Likewise, it is also an essential tool to understand the vast epigenomic changes that occur in a tumor cell and that are often important players in disease severity17. With the aim of understanding the miRNA repertoire associated with the generation of NEPC, small RNA sequencing was performed on FFPE metastatic CRPC tissues and their corresponding serum-derived EVs. RNA derived from either of these two sample sources is (1) low in yield and (2) of bad quality due to the degradation that often happens due to formalin fixation and EV isolation. Furthermore, generating cDNA libraries is a critical, but cumbersome, step of a sequencing run. Thus, methods for isolating these RNAs and using them to generate libraries for small RNA sequencing require optimization to generate accurate and reliable data.
There are several methods to profile miRNA expression in different samples, including RT-PCR, microarrays, and in-situ hybridization (ISH). A protocol using FFPE tissue-derived RNA to evaluate miRNA expression by RT-PCR and ISH was recently published18. More recent technologies offer more exhaustive and comprehensive platforms for profiling miRNA expression in a sample. NanoString nCounter offers a sensitive miRNA detection platform19, but the detection is often limited by the number of miRNAs that are available in the array (~2,000). In such a scenario, a more sensitive and exhaustive platform such as next generation sequencing offers much wider depth of miRNA identification and simultaneous profiling in different samples20. The method has been used to determine the miRNA signatures in urine or plasma from PCa patients21,22,23. In the current article, a protocol is presented to use a next generation sequencing platform to study miRNA profiles associated with aggressive CRPC using FFPE tissues and serum-derived EV RNAs.
Protocol
This study was conducted in accordance with the ethical guidelines of US Common Rule and was approved by the Institutional Committee on Human Research.
1. Microdissection
NOTE: FFPE metastatic CRPC tissues with adenocarcinoma features (CRPC-Adeno) or NE differentiation (CRPC-NE) were obtained from the Prostate Cancer Biorepository Network (PCBN). Ten-micron PCa sections on glass slides were prepared for manual microdissection as discussed previously18. To briefly summarize:
- Deparaffinize the tissue sections by soaking the slides in xylene (2x, 10 min each). Then rehydrate the sections by incubating the slides for 5 min each in graded ethanol (100%, 95%, 90%, 80%, and 70%), followed by a distilled water wash and staining with hematoxylin (30 s soak).
- Following hematoxylin staining, wash the tissue sections with water. Then dehydrate the tissue sections by placing them in graded ethanol (70%, 80% 90%, 95%, 100%) (5 min each) followed by xylene (5 min).
- Analyze the corresponding hematoxylin and eosin (H&E) slides to identify the tumor areas (i.e., adenocarcinomas or NED) and mark these tumor areas and normal adjacent areas with the assistance of a board-certified pathologist. Using these H&E slides as roadmaps, mark the hematoxylin-stained tissues obtained in the above step to distinguish between the tumor and normal areas.
- Dissect the marked tissue slide carefully under the microscope using a scalpel blade.
- Collect the dissected tissue from normal and cancerous areas in separate tubes using electrostatically charged gel loading pipette tips. The charged tip attracts the dissected tissue and allows for maximum tissue recovery after dissection. Once the tissue sticks to the charged tip, cut the tip into an empty 2 mL collection tube.
2. Isolating Serum-derived EVs
NOTE: Frozen patient serum samples collected from patients with metastatic CRPC with adenocarcinoma characteristics (CRPC-adeno) or NE differentiation (CRPC-NE) were procured from PCBN using an approved IRB protocol and stored at -80 °C prior to their use. Serum samples were collected from the same set of patients as those used for microdissected tissues to allow comparison between the corresponding tissues and the serum-derived EVs. A commercially available serum EV isolation reagent was used to collect the EVs.
- Thaw frozen patient serum samples at 4 °C.
- Use 110 μL of thawed serum sample and spin at 2,000 x g for 30 min.
- Collect the supernatant for subsequent EV/exosome isolation and discard the debris pellet. Add 30 μL of serum exosome isolation reagent to the supernatant and incubate at 4 °C for 30 min.
- Spin at 10,000 x g for 10 min. Collect the EV-depleted serum carefully without disturbing the pellet in a separate 1.5 mL tube and store at -80 °C for future analysis, if needed.
- Resuspend the EV pellet in 70 μL of phosphate buffered saline (PBS) prepared in nuclease-free water. Keep an aliquot for the particle tracking analyses system to assess the quality and number of particles. Store the rest of the sample at -80 °C until further analysis.
3. RNA Isolation from Microdissected Prostate Tissues and EVs
NOTE: Total RNA was isolated from microdissected tissues and purified EVs using a commercially available kit (Table of Materials) per the manufacturer's instructions with a few modifications. The following sections briefly describe these procedures with special emphasis on the important steps:
- Isolate the RNA from the microdissected tissues.
- Resuspend the microdissected FFPE tissue in 150 μL of proteinase K buffer. Mix by vortexing and pipette out the residual tissue from the tip. Spin at 11,000 x g for 1 min.
- Add 10 μL of proteinase K to the pellet. Wait for 2 min until the pellet turns white. Pipette up and down a few times.
- Incubate at 56 °C for 16 min. Vortex every 3 min.
- Remove samples and let the heat block reach 80 °C. Incubate the samples on the block for 16 min. Vortex every 3 min.
- Incubate on ice for 3 min.
- Spin at 20,000 x g for 15 min. Transfer the supernatant to a new 2 mL tube.
- Add 16 μL of DNase booster buffer followed by 10 μL of DNase I. Mix by inverting the tube gently and incubate at room temperature (RT) for 15 min.
- Add 320 μL of red blood cell (RBC) lysis buffer. Mix by inverting the tube and then add 1,120 μL of 100% ethanol. Immediately transfer on spin columns stored at 4 °C. Spin at 8,000 x g for 30 s.
- Wash the columns 2x with wash buffer and spin the columns at 20,000 x g for 5 min to remove residual wash buffer.
- Allow the spin column to air dry for 2−3 min, then elute with 19 μL of RNase-free water. Quantitate the purified RNA on a spectrophotometer and normalize the sample to 40 ng/μL.
- RNA isolation from serum-derived EVs.
- Isolate the exosomal RNA using a kit. Add 75 μL of lysis buffer A and 9.3 μL of lysis buffer B to 50 μL of the purified EV suspension.
NOTE: Keep mixing the sample by inverting the tube for about 10 min to allow complete lysis of the EVs. - Add 130 μL of 100% ethanol and immediately mix by inverting the sample. Transfer on a spin column and then spin at 3,300 x g for 1 min.
- Wash the column 2x with the wash buffer. Spin the column at 1,300 x g for 3 min to completely remove the wash buffer.
- Allow the column to air dry for 2 min. Add 18 μL of elution buffer to the column and let it sit for 2 min. Spin at 400 x g for 1 min followed by a second spin at 5,800 x g for 3 min.
- Repeat step 3.2.4 with the eluted buffer included in the kit to increase the yield of the RNA from the sample.
- Quantify the sample on a spectrophotometer and normalize it to 40 ng/μL.
- Isolate the exosomal RNA using a kit. Add 75 μL of lysis buffer A and 9.3 μL of lysis buffer B to 50 μL of the purified EV suspension.
4. Library Preparation for Small RNA Sequencing
NOTE: A small RNA library prep kit (Table of Materials) was used to generate cDNA libraries from the isolated RNA samples. The steps to generate libraries, purify, and quality check them prior to running on a sequencer are crucial to any sequencing protocol as they eventually determine the quality of output data from a run. Therefore, proceed carefully with each step. The guidelines from the manufacturer suggest using a minimum of 50 ng of RNA. Given the poor quality and low amounts of total RNA usually obtained from these two sample sources, this protocol is optimized for RNA concentrations as low as 100 ng. The protocol below is for one sample of a library.
- Generate adapter-ligated cDNA.
- Use 5 μL of a normalized (40 ng/μL) RNA sample. Add 1 μL of 3′ adaptor. Preheat the thermal cycler to 70 °C prior to incubating the samples. Incubate for 2 min. Immediately transfer the samples on ice prior to moving onto the next step.
- In a separate tube, mix 2 μL of ligation buffer, 1 μL of RNase inhibitor, and 1 μL of T4 RNA Ligase 2, a deletion mutant. Mix by pipetting up and down and add 4 μL of this mix to the tube with the RNA/3′ adaptor.
- Transfer to the thermal cycler that has been preheated to 28 °C and incubate for 1 h.
- Add 1 μL of stop solution while keeping the samples on the thermal block. Incubate at 28 °C for another 15 min.
- Remove the tubes and keep on ice immediately after this step.
- In a separate tube, add 1 μL of 5′ adaptor.
- Transfer to a thermal cycler that has been preheated to 70 °C and incubate for 2 min.
- Immediately place the tube on ice to prevent re-annealing of the adaptors.
- Add 1 μL of 10 mM ATP to the tube of denatured 5′ adaptor. Mix by pipetting and add 1 μL of T4 RNA ligase to the mix. Mix by pipetting and add 3 μL of this mix to the tube containing the 3′ adaptor-ligated RNA. Transfer on the thermal cycler that has been preheated to 28 °C and incubate for 1 h.
- Immediately transfer to ice and either proceed further with the samples or store at -20 °C for future use.
- To perform RT-PCR, use 6 μL of each adaptor-ligated RNA and add 1 μL of RNA RT primer to it. Transfer to the thermal cycler that has been preheated to 70 °C. Incubate for 2 min.
- In a separate tube, mix 2 μL of 5x strand buffer, 0.5 μL of 12.5 mM dNTPs, 1 μL of 100 mM DTT, 1 μL of RNase inhibitor, and 1 μL of reverse transcriptase. Add 5.5 μL of this mix to the adaptor-ligated RNA and transfer to the thermal cycler that has been preheated to 50°C. Incubate for 1 h.
- Transfer the adaptor-ligated cDNA immediately to ice.
- In a separate tube, mix 25 μL of PCR mix, 2 μL of RNA PCR primer, 2 μL of RNA PCR primer index, and 8.5 μL of RNase-free water. Add 37.5 μL of this mix to 12.5 μL of adaptor-ligated cDNA. Transfer to the thermal cycler that has been preheated to 98 °C. Program the thermal cycler as suggested in the manufacturer’s protocol with the cycle number modified to 15 instead of 11.
NOTE: Sequences of all the primers used are listed under Table of Materials. - Keep the samples at 4 °C after completion. Proceed with them or store at -80 °C for future use.
- Purify and perform quality control for the ligated cDNA.
NOTE: Amplified cDNA was gel-purified by following the manufacturer’s protocol except for a few modifications to improve the quality and yield of purified cDNA samples as explained below.- Use 6% TBE polyacrylamide gels to purify the amplified cDNA. Dilute the high-resolution ladder (HRL) and custom RNA ladder (CRL) with equal volumes of DNA loading dye.
- Add 10 μL of DNA loading dye to each cDNA sample. Run 30 μL of each sample in two separate lanes adjacent to each other with CRL and HRL in the intermediate space between the two different samples.
- Run the gel in 1x TBE buffer at 145 V for approximately 30−40 min.
NOTE: Keep track of the lower blue front of the loading dye. Stop the electrophoresis when it approaches the bottom of gel. - Transfer the gel in 1x TBE buffer with Ethidium Bromide (EtBr) at 0.5 µg EtBr/1 mL 1x TBE.
CAUTION: EtBr is a known carcinogen and each step from here until the excision from the gel should be performed with extreme caution. - Visualize the gel in a transilluminator and cut the gel precisely between the 145 bp and 160 bp marker.
NOTE: The adaptor dimers run very close to the 145 bp marker. Therefore, cut the gel slightly above the 145 bp marker to avoid contamination with adaptor dimer. - Transfer the gel to DNA breaking tubes kept in 2 mL collecting tubes. Spin at 20,000 x g for 2 min. Add 300 μL of RNase-free water and allow it to rotate gently on a rocker overnight at RT.
- To perform the DNA precipitation, on the following day transfer the contents of the tube to 5 μm filter tubes. Spin at 600 x g for 10 s.
NOTE: Do not let tubes spin longer than 10 s as the gel passes through the filter. - Add 2 μL of glycogen, 30 μL of 3 M NaOAc, 2 μL of 0.1x pellet paint, and 975 μL of 100% ethanol to the eluted DNA. Spin at 17,000 x g at 4°C for 20 min.
- Discard the supernatant and add 75% ethanol to wash the pellet. Spin at 17,000 x g at 4 °C for 5 min. Discard the supernatant and incubate the tubes at 37 °C to completely evaporate the ethanol.
- Resuspend the pellet with 12 μL of 10 mM Tris-HCl pH 8.5.
- Perform a library quality check by diluting the purified cDNA by 10x (1:10) and using 1 μL of diluted cDNA to run on a bio-analyzer.
- Make sure the cDNA product size corresponds to the range of small RNA (136−160 bp) in the electropherogram. Calculate the total molarity for each sample. Normalize each sample to 2 nM using Tris-HCl pH 8.5.
- Denature and sequence the purified cDNA.
- Pool the libraries by mixing equal volumes of each 2 nM sample in a single 200 μL PCR tube. Add 10 μL of freshly prepared 0.2 N NaOH to 10 μL of pooled library.
- Mix immediately by vortexing, and spin at 280 x g for 1 min. Incubate at RT for 5 min.
- Add 10 μL of 200 mM Tris-HCl pH 7 to 20 μL of the denatured library. Mix by vortexing and spin at 280 x g for 1 min.
- Add 970 μL of prechilled hybridization buffer to the library and mix well by vortexing. The library is at a concentration of 20 pM. Keep on ice until it is finally diluted.
NOTE: The final dilution is done right before running on sequencer. - Add 117 μL of the denatured library to 1,183 μL of prechilled hybridization buffer. Mix by inverting the tube and pulse centrifuge. The final concentration of the library is now 1.8 pM.
- Add 1.3 μL of PhiX to the 1.3 mL of final library. To initiate a run on a sequencer, follow the on-screen steps on the software interface, review the run parameters, including read type (single read), read length (number of cycles for each read), library ID, and select Start.
5. Data Analysis
- At the end of the sequencer run, obtain the resulting sequencing data as fastQ files. Use the appropriate software to analyze the resulting sequencing data.
- Open the fastQ toolkit application and press the Launch button.
- Select the files from the list of samples in the software and select where the data will be saved.
- Add a string name that applies to each trimmed sequence. Keep the stringency to 0.9. Input the adapter sequence to trim as “TGGAATTCTCGGGTGCCAAGG” from the 3′ end of each sequenced sample. Expand the Read Filtering tab and select a minimum read length of “5“. Select the Acknowledge box and press the Continue button to start trimming. The trimmed files will be saved in the project folder upon the end of the analysis.
- Open the small RNA v.1.0 application on the software and press the Launch button.
- Select the project where the files will be saved and sent after the analysis.
- Select the Novel miRs and Differential miRs function in the application. Segregate the groups as “Control” and “Test” for differential analysis and add the trimmed files to be analyzed in their respective groups.
- Select the Launch button for initiating the analysis. Following the analyses, download the resulting files.
Representative Results
The library was prepared after RNA isolation and a quality check was performed. Gel purification for the amplified cDNA library prepared from RNA isolated from microdissected tissues and serum-derived EVs is shown in Figure 1 and Figure 2. The product size for adaptor-ligated miRNAs corresponded to about 136−160 bp for each sample. Figure 1A-B are marked to show the range of the gel that should be precisely excised for small RNA library preparation. Figure 2A-B show the gel electrophoresis and electropherograms for the microdissected tissue and serum-derived EVs. Supplementary Figure 1 shows a representative result from the electrophoresis machine and the method to calculate molarity.
Steps to obtain the library metrics prior to running on a sequencer were performed. Figure 3 shows the representative metrics from a small RNA sequencing run demonstrating the expected cluster density, QC score, cluster passing filter percentage, and estimated yield and error rates. Figure 3A and Figure 3C show the tables with all the run parameters and graph for QC score over different cycles. Figure 3B,D are graphical representations of the error rates for PhiX alignment over different cycles. The provided data are from the on-site analysis software.
A commercially available software application (Table of Materials) was used to analyze the sequenced samples from microdissected tissue and serum-derived EVs. The sequenced samples were trimmed off the adaptor sequences using the FASTq toolkit followed by analysis on the “Small RNA v.1.0” application. Figure 3 shows the resulting data upon analysis. Table 1 and Table 2 show total reads from microdissected tissue and serum-derived EVs sequencing run. Figure 3A and Figure 3B show the small RNA length distribution for the two sample sources.
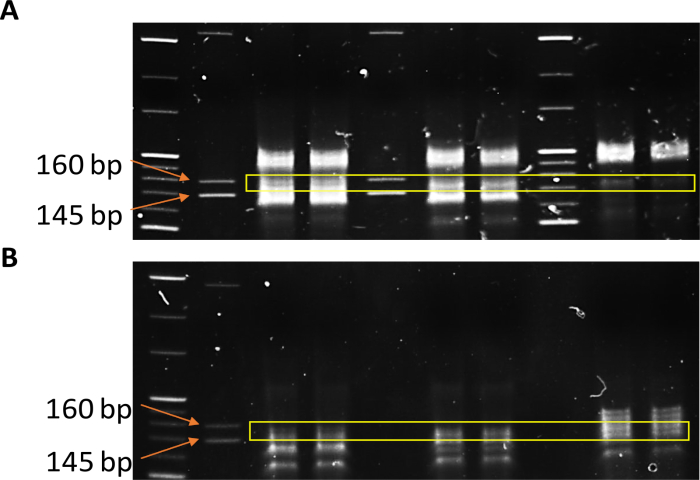
Figure 1: Library preparation for sequencing small non-coding RNA. Polyacrylamide cDNA gel for the amplified libraries from (A) microdissected FFPE tissue RNA and (B) RNA from purified serum-derived EVs. Please click here to view a larger version of this figure.
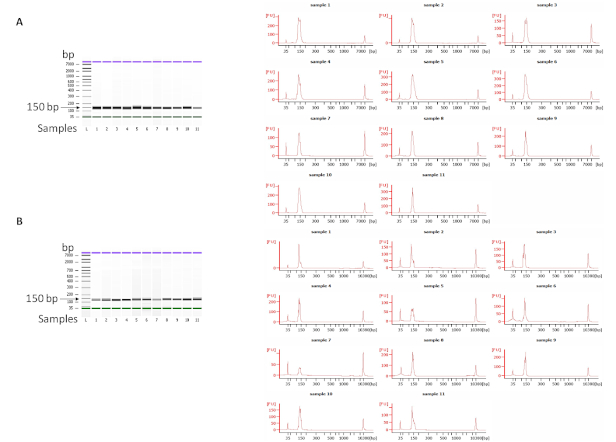
Figure 2: Quality check for sequencing small non-coding RNA. Representative image for gel electrophoresis and electropherogram for purified cDNA library for (A) microdissected FFPE tissue and (B) serum-derived EVs. Please click here to view a larger version of this figure.
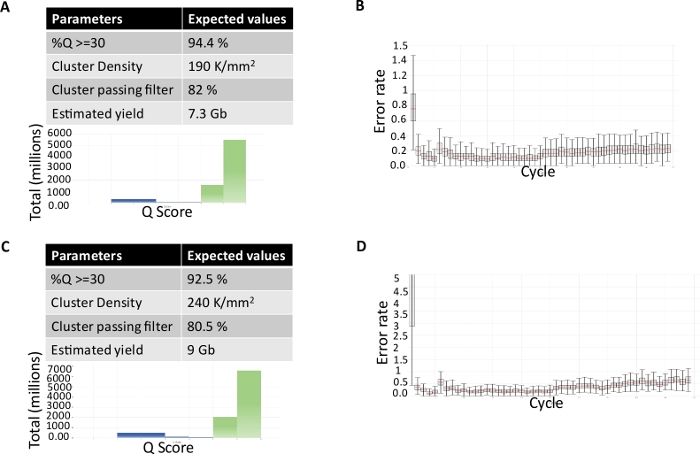
Figure 3: Run metrics for small RNA sequencing run. Tabular and graphical representation of run parameters % Q ≥30, cluster density, cluster passing filter %, estimated yield, and Q Score for sequencing run from (A) microdissected FFPE tissue and (C) serum-derived EVs. Graphical representation of error rates for PhiX alignment over different cycles for sequencing run from (B) microdissected FFPE tissue and (D) serum-derived EVs. Errors bars represent standard deviation for the error rates for each cycle. Please click here to view a larger version of this figure.
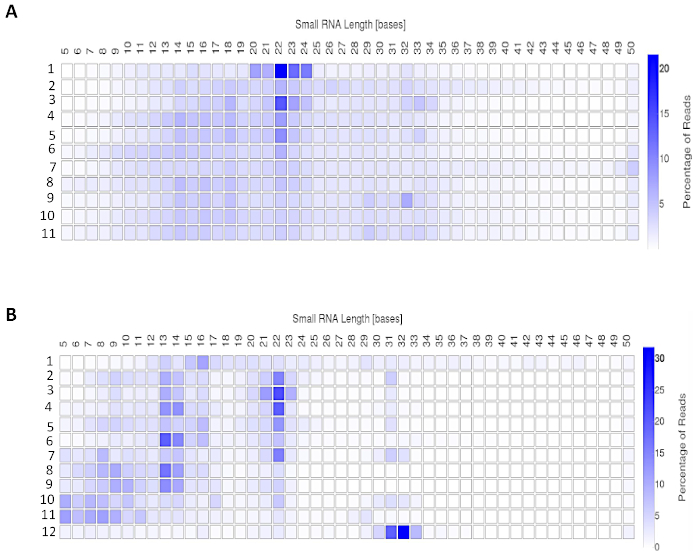
Figure 4: Expected outcomes from a small non-coding RNA sequencing run. Small RNA read lengths for library from (A) Microdissected FFPE tissue and (B) serum-derived EVs. Please click here to view a larger version of this figure.
| Sample | Total sequencing reads |
| 1 | 92,68,658 |
| 2 | 70,00,551 |
| 3 | 1,56,41,204 |
| 4 | 1,50,46,681 |
| 5 | 1,42,82,756 |
| 6 | 1,27,38,970 |
| 7 | 1,57,21,318 |
| 8 | 88,51,578 |
| 9 | 1,32,16,879 |
| 10 | 1,14,66,162 |
| 11 | 1,91,14,932 |
Table 1: Total sequencing reads for a small RNA sequencing run from microdissected FFPE tissue. Percentage of reads corresponding to small RNAs for sequenced FFPE samples that were obtained after analysis.
| Sample | Total sequencing reads |
| 1 | 2,30,88,960 |
| 2 | 1,77,69,806 |
| 3 | 90,37,884 |
| 4 | 87,26,243 |
| 5 | 73,23,571 |
| 6 | 2,89,37,388 |
| 7 | 76,52,149 |
| 8 | 1,30,07,122 |
| 9 | 54,34,386 |
| 10 | 93,05,941 |
| 11 | 94,53,760 |
| 12 | 82,79,773 |
Table 2: Total sequencing reads for a small RNA sequencing run from purified serum-derived EVs. Percentage of reads corresponding to small RNAs for sequenced EV samples obtained after analysis.
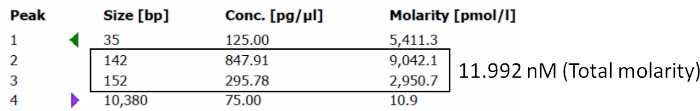
Supplementary Figure 1: Quality check for sequencing small non-coding RNA. Representative results from an electrophoresis machine run showing the total molarity of the indicated sample. Please click here to view a larger version of this figure.
Discussion
In this article, we describe a protocol to isolate RNA from FFPE tissues and serum-derived EVs using kits that were optimized to increase the yield and quality of isolated RNAs. Further, the purified RNAs were used to generate cDNA libraries for small RNA sequencing. Both of the listed steps are essential in determining the quality and depth of the sequencing reads that are the final result from the run24. Therefore, optimizing these crucial steps is critical to a successful sequencing run.
An important step in the isolation of FFPE-derived RNA is the digestion with proteinase K that allows for removal of cross-linked formalin from the tissue. This step has been optimized by incubating the sample at 55 °C and 80 °C for about 16−18 min each. This resulted in an effective increase in the quality of isolated RNA by an increase in the 260/280 ratio. Sequencing reads are often variable for a run that includes multiple samples. Therefore, controlling the amount of RNA inputs at the start of library preparation allows for uniformity of the library. Using normalized RNA helps in leveling a sequencing run uniformly across different samples. The most critical step in the library preparation is the purification of amplified adapter ligated cDNAs. It is very important to carefully excise the gels above the 140 bp marker, because a slight deviation towards the bottom of the marker leads to contamination of the adapter dimers. Lastly, normalizing the cDNA library is the most important step of the sequencing protocol and should be done accurately based on the calculated normality from the electrophoresis machine.
In case of an adapter dimer contamination, one can rerun the purified library on a TBE gel and repurify the desired product. However, the yield of the cDNA library in such an extraction is significantly decreased, which may affect the read length from the sample. For an estimate on the concentration of the purified cDNA library, one can dilute the samples prior to running on the electrophoresis machine based on the product intensity in the TBE gels and prepare different dilutions (i.e., 5x, 10x, or 25x). To further improve the estimation of the purified cDNA libraries, running a qPCR in addition to electrophoresis helps to evaluate template levels and allows more accurate normalization.
Although ultracentrifugation is the gold standard for isolation of EVs from different sources, a lower yield of the particles from such an extraction often limits the use of this method in purifying EVs where the starting material is limited and a significant amount of input RNA is needed for downstream applications. Thus, use of the total exosome isolation reagent provides a much quicker and higher yield method for EV isolation from limited sources like serum and plasma from clinical samples.
In all, this protocol details the methods for generating cDNA libraries in a more time effective manner while taking into consideration the yield and quality of the cDNA libraries to get accurate and comprehensive sequencing reads. Given the potential of exosomes as a source of cancer biomarkers, this method for next generation sequencing (NGS) analyses of exosomal miRNA content will be helpful for research in the field.
Disclosures
The authors have nothing to disclose.
Acknowledgements
This work is supported by the US Army Medical Research Acquisition Activity (USAMRAA) through the Idea Development Award underAward No. W81XWH-18-1-303 and W81XWH-18-2-0013 and additionally by Award no. W81XWH-18-2-0015, W81XWH-18-2-0016, W81XWH-18-2-0017, W81XWH-18-2-0018, and W81XWH-18-2-0019 Prostate Cancer Biorepository Network (PCBN). Funding support to authors’ lab by the National Cancer Institute at the National Institutes of Health (Grant Number RO1CA177984) is also acknowledged. Rajvir Dahiya is a Senior Research Career Scientist at the Department of Veterans Affairs, BX004473 and funded by NIH-UO1CA199694 (RD). Opinions, interpretations, conclusions, and recommendations are those of the author and are not necessarily endorsed by the Department of Defense or U.S. Army. We are thankful to Judy Shigenaga, director of core facility at San Francisco VAMC, for her assistance with the NextSeq 500 sequencer.
Materials
| 3M NaOAc pH 5.5 | USB Corp. | 75897 100 mL | |
| 5 µm filter tubes | IST Engineering Inc. | 5388-50 | |
| 6% TBE polyacrylamide gels | Novex | EC6265BOX | |
| BaseSpace | Illumina | Analysis software | |
| Bio-analyzer | Agilent | ||
| DNA loading dye | Novex | LC6678 | |
| Eppendorf Thermostat plus | Eppendorf 1.5 mL | ||
| EtBr | Pierce | 17898 | |
| Ethyl alcohol 200 proof | Pharmco | 111000200 | |
| Exosomal RNA isolation kit | Norgen | 58000 | |
| Gel breaking tubes | IST Engineering Inc. | 3388-100 | |
| Glycogen molecular biology grade | Thermo Scientifc | R0561 | |
| Hematoxylin Select | Stat lab | SL401 | |
| Microcentrifuge | Fisher Scientific | 13-100-676 | accuSpin Micro 17R |
| miRNeasy FFPE kit | Qiagen | 217504 | |
| Nanodrop | Thermo Scientifc | Nano Drop 1000 | |
| Nanosight NTA | Malvern | LM14 | |
| NextSeq 500 Sequencer | Illumina | ||
| NextSeq 500/550 Mid Output Kit v2 (150 cycles) | Illumina | FC-404-2001 | |
| Pellet paint | Millipore | 70748-3 | |
| Superscript II Reverse Transcriptase | Invitogen | 18064014 | |
| T4 RNA Ligase 2 Deletion Mutant | Lucigen | LR2D11310K | |
| TBE Running buffer (5X) | Novex | LC6675 | |
| Thermal cycler | MJ Research | PTC100 | |
| Total exosome isolation reagent (from serum) | Invitrogen | 4478360 | |
| TrueSeq small RNA library Prep kit-Set A (Indexes 1-12) | Illumina | RS-200-0012 | |
| Xylene | Fisher Scientific | X3P- 1GAL | |
| RNA 3' Primer | GUUCAGAGUUCUACAGUCCGACGAUC | ||
| RNA 5' Primer | TGGAATTCTCGGGTGCCAAGG | ||
| Stop Oligo | GAAUUCCACCACGUUCCCGUGG | ||
| RNA RT Primer | GCCTTGGCACCCGAGAATTCCA | ||
| RNA PCR Primer | AATGATACGGCGACCACCGAGATCTACACGTTCAGAGTTCTACAGTCCGA | ||
| RNA PCR Index Primer | CAAGCAGAAGACGGCATACGAGAT[6 bases]GTGACTGGAGTTCCTTGGCACCCGAGAATTCCA | ||
| – | – | – | 6 bases in adapter |
| RNA PCR Index Primer 1 | CGTGAT | ||
| RNA PCR Index Primer 2 | ACATCG | ||
| RNA PCR Index Primer 3 | GCCTAA | ||
| RNA PCR Index Primer 4 | TGGTCA | ||
| RNA PCR Index Primer 5 | CACTGT | ||
| RNA PCR Index Primer 6 | ATTGGC | ||
| RNA PCR Index Primer 7 | GATCTG | ||
| RNA PCR Index Primer 8 | TCAAGT | ||
| RNA PCR Index Primer 9 | CTGATC | ||
| RNA PCR Index Primer 10 | AAGCTA | ||
| RNA PCR Index Primer 11 | GTAGCC | ||
| RNA PCR Index Primer 12 | TACAAG |
References
- Heinlein, C. A., Chang, C. Androgen receptor in prostate cancer. Endocrine Reviews. 25 (2), 276-308 (2004).
- Tilki, D., Schaeffer, E. M., Evans, C. P. Understanding Mechanisms of Resistance in Metastatic Castration-resistant Prostate Cancer: The Role of the Androgen Receptor. European Urology Focus. 2 (5), 499-505 (2016).
- Vlachostergios, P. J., Puca, L., Beltran, H. Emerging Variants of Castration-Resistant Prostate Cancer. Current Oncology Reports. 19 (5), 32 (2017).
- Aggarwal, R., Zhang, T., Small, E. J., Armstrong, A. J. Neuroendocrine prostate cancer: subtypes, biology, and clinical outcomes. Journal of the National Comprehensive Cancer Network. 12 (5), 719-726 (2014).
- Beltran, H., et al. Divergent clonal evolution of castration-resistant neuroendocrine prostate cancer. Nature Medicine. 22 (3), 298-305 (2016).
- Calin, G. A., Croce, C. M. MicroRNA signatures in human cancers. Nature Reviews Cancer. 6 (11), 857-866 (2006).
- Coppola, V., De Maria, R., Bonci, D. MicroRNAs and prostate cancer. Endocrine-Related Cancer. 17 (1), 1-17 (2010).
- Ambs, S., et al. Genomic profiling of microRNA and messenger RNA reveals deregulated microRNA expression in prostate cancer. Cancer Research. 68 (15), 6162-6170 (2008).
- Lu, J., et al. MicroRNA expression profiles classify human cancers. Nature. 435 (7043), 834-838 (2005).
- Bhagirath, D., Yang, T. L., Dahiya, R., Saini, S. MicroRNAs as Regulators of Prostate Cancer Metastasis. Advances in Experimental Medicine and Biology. 1095, 83-100 (2018).
- Hoshino, A., et al. Tumour exosome integrins determine organotropic metastasis. Nature. 527 (7578), 329-335 (2015).
- Colombo, M., Raposo, G., Thery, C. Biogenesis, secretion, and intercellular interactions of exosomes and other extracellular vesicles. Annual Review of Cell and Developmental Biology. 30, 255-289 (2014).
- Bhagirath, D., et al. microRNA-1246 Is an Exosomal Biomarker for Aggressive Prostate Cancer. Cancer Research. 78 (7), 1833-1844 (2018).
- Witte, J. S. Prostate cancer genomics: towards a new understanding. Nature Reviews Genetics. 10 (2), 77-82 (2009).
- Kim, J. H., et al. Deep sequencing reveals distinct patterns of DNA methylation in prostate cancer. Genome Research. 21 (7), 1028-1041 (2011).
- Robinson, D., et al. Integrative clinical genomics of advanced prostate cancer. Cell. 161 (5), 1215-1228 (2015).
- Kim, J., Yu, J. Interrogating genomic and epigenomic data to understand prostate cancer. Biochimica Et Biophysica Acta. 1825 (2), 186-196 (2012).
- Bucay, N., et al. miRNA Expression Analyses in Prostate Cancer Clinical Tissues. Journal of Visualized Experiments. (103), e53123 (2015).
- Geiss, G. K., et al. Direct multiplexed measurement of gene expression with color-coded probe pairs. Nature Biotechnology. 26 (3), 317-325 (2008).
- Tam, S., de Borja, R., Tsao, M. S., McPherson, J. D. Robust global microRNA expression profiling using next-generation sequencing technologies. Laboratory Investigation. 94 (3), 350-358 (2014).
- Rodriguez, M., et al. Identification of noninvasive miRNAs biomarkers for prostate cancer by deep sequencing analysis of urinary exosomes. Molecular Cancer. 16 (1), 156 (2017).
- Guelfi, G., et al. Next Generation Sequencing of urine exfoliated cells: an approach of prostate cancer microRNAs research. Scientific Reports. 8 (1), 7111 (2018).
- Daniel, R., et al. A Panel of MicroRNAs as Diagnostic Biomarkers for the Identification of Prostate Cancer. International Journal of Molecular Sciences. 18 (6), 1281 (2017).
- Xuan, J., Yu, Y., Qing, T., Guo, L., Shi, L. Next-generation sequencing in the clinic: promises and challenges. Cancer Letters. 340 (2), 284-295 (2013).
