Two glass coverslips are used per experiment. The glass coverslips are cleaned and passivated with PEG polymers. Passivation is essential for preventing the solubilized proteins from adhering to the glass surfaces at the early experimental stages and for minimizing the interaction of the contracting network with the glass walls. Failure to achieve good passivation can lead to inefficient contraction and, in extreme cases, can even inhibit actin network formation.
Figure 1 describes the three main steps of the surface treatment procedure. These steps include the following: (i) surface cleaning and hydrophilization using a Piranha solution, which removes organic contamination from the coverslip surfaces and exposes the OH groups on the glass surface; (ii) surface silanization with (3-Mercaptopropyl)trimethoxysilane, which aims to covalently bind the silane to the glass surface, where each silane molecule ends up with an SH group; (iii) passivation with PEG polymers (mPEG-mal, 5 kDa)-in this step, the maleimide group of the PEG polymer interacts covalently with the SH group on the (3-Mercaptopropyl)trimethoxysilane, resulting in the formation of a PEG monolayer on the glass surface.
For Piranha treatment and silanization, 10-12 glass coverslips #1.5 (22 mm x 22 mm) are placed in a polytetrafluoroethylene holder (Figure 2A), and that holder is transferred to a 400 mL beaker. For the passivation step, two glass coverslips are transferred onto a parafilm-coated Petri dish (Figure 2B). Placing the coverslips on a hydrophobic parafilm layer ensures that the hydrophilic PEG polymer solution remains confined to the glass surface throughout the incubation time. Each coverslip is incubated with 1 mL of 4 mg·mL−1 5 kDa mPEG-mal in 1x PBS for 1 h at 22 °C (Figure 2B). For this PEG polymer molecular weight and concentration, glass passivation leads to the formation of a PEG monolayer, where each PEG-polymer is in a mushroom-like conformation29. At the end of the incubation process, each coverslip is rinsed with 5 mL of DDW and dried with a flow of N2 (gas). If the coverslips are not used immediately, 1 mL of 10 mM Tris should be put on the pegylated surfaces to keep the coverslip surfaces wet. The coverslips are dried with a flow of N2 (gas) just before starting an experiment. It is better to use the coverslips within 2 h.
Macroscopically contractile elastic actomyosin networks are formed by mixing 5 µM G-actin with 16.7 nM myosin, which is added in the form of large aggregates (~150 myosin dimers/aggregates), and 280 nM of the strong crosslinker fascin. The solution includes 1 mM ATP, which is kept constant using an ATP-regenerating system and an anti-bleaching solution (see details in the protocol section). To analyze the flow of the penetrating solvent, fluorescent beads are added to the actomyosin solution.
The experiments are run in a homemade sample holder, which fits the dimensions of a standard microscope stage (Figure 3). A greased parafilm spacer of thickness h (~150 µm) is placed on one of two PEG-passivated coverslips, and that coverslip is placed in the sample holder (Figure 3A). Then, the actomyosin solution is prepared on ice in a microcentrifuge tube by incorporating the various microscopic constituents, adding last the G-actin, myosin aggregates, and then EGTA, which triggers actin polymerization. The solution must be mixed well-this sets the starting time of the experiments (t = 0). Immediately, 1.1 µL of that solution is placed on the coverslip (Figure 3B), the second PEG-passivated coverslip is placed on top of it (Figure 3C), and the holder is screwed to confine the drop in between them (Figure 3D). For this drop volume and spacer type, the drop diameter is about 3,000 µm, but researchers should not rely on these estimated values. The actual drop thickness and diameter should always be measured directly from the microscopy images. For the thickness, a confocal microscope should be used.
The sample holder is placed on the microscope, and the acquisition is started. The microscope should be prepared in advance to reduce the time to starting the acquisition to a minimum. It typically takes 1-2 min to start the sample imaging. The samples are excited at 488 nm and/or 561 nm and imaged using an inverted fluorescent microscope controlled by a dedicated software. The images should be acquired at a rate of 100 ms per frame (or less) in streaming mode with an EMCCD camera. To simultaneously image the actin network and the myosin motor aggregates, or the fluorescent beads in the solution, a dual-emission system should be used. The intensity of the fluorescent lamp should be kept as low as possible to avoid signal saturation at the advanced stages of network contraction.
A 2.5x/0.075 Plan-NEOFLUAR objective is used to characterize the lateral contraction dynamics of the gel and the fluid flow directionality and velocity on the length scale of the gel. These are low-resolution images that are useful for following the changes in gel radius with time, from which the gel radial (lateral) contraction velocity can be deduced. To resolve the structure and porosity of the network, the location of the myosin motor aggregates within the network and the movement of individual fluorescent beads across the gel pores, higher magnification objectives should be used (e.g., a 10x/0.3 Ph1 UPlanFL objective). Higher magnifications can also be used but at the expense of a reduced field of view, which is more significant if the dual-color imaging mode is employed. The (2D) fluorescence microscopy data should be complemented with confocal imaging of the contracting gel in 3D to characterize the contraction dynamics in both the lateral and vertical directions. Confocal microscopy is used to measure the spacing between the two coverslips-this distance defines the initial gel thickness. Additionally, the thickness of the gel should be measured at the end of the experiment when a mechanically stable state is achieved.
Several criteria need to be fulfilled to show that the actomyosin networks behave as a poroelastic material: (i) the network does not remodel, which would infer that it behaves as an elastic material (Figure 4), (ii) the water (solvent) flow across the gel pores is driven by myosin contractility (Figure 5), and (iii) the elastic stress relaxation is characterized by an effective diffusion constant, D ~ κ/γ, which depends on the gel effective elastic modulus, κ, and the effective friction constant, γ, which accounts for the friction between the moving solvent and the gel pores (Figure 6). Below, we discuss each criterion separately and demonstrate how they are fulfilled in the current system.
Aim (i)
Firstly, the gel structure and porosity should be analyzed, and it should be determined whether the network is dynamically remodeling. A schematic representation of the actomyosin network is depicted in Figure 4A. Network formation starts with the spontaneous nucleation and polymerization of the actin filaments, which subsequently bundle (Figure 4B). The network then actively self-organizes into a macroscopically isotropic interconnected network of actin bundles, which dynamically coarsens with time and eventually contracts. Network self-organization and contraction are driven by the myosin aggregates, which predominantly localize at the intersection points of the filament bundles (Figure 4C). The myosin aggregates remain attached to the network through gel contraction, from which it can be concluded that these actomyosin gels behave as elastic active materials (Figure 4C). Furthermore, in these actomyosin gels, contraction is governed by filament sliding, as deduced by comparing the filament bundles' end-to-end distances, lend-to-end, and contour lengths, lcont (Figure 4D,E). This contrasts with the contraction of loose actin bundles crosslinked by α-actinin, which are dominated by actin filament buckling29.
The porosity of the gel is characterized by the size of the gel pores through which the solvent flow moves. For purified actin networks, the mesh size, which defines the distance between crosslinks in the gel (here, the myosin aggregates), provides a good estimate also of the gel pore size. The mesh size can be extracted directly from the (2D) fluorescence images and is evaluated from the geometric mean of the distances between pairs of opposing actin bundles in a gel pore (Figure 4B). Since the network is isotropic up to contraction onset, the mean mesh sizes in the vertical (i.e., across the thickness) and lateral (along the radius) directions are the same, ξ0, = ξ0,ll = ξ0 (= 67 µm). Since the actin bundles remain straight during contraction, the mesh and pore sizes shrink in proportion to the changes in gel thickness and diameter. For the current experimental system, the in-plane (radial) contraction initiates after the vertical contraction practically ends (not shown), such that radial contraction proceeds at a constant gel thickness smaller than the initial thickness by a factor of ~0.3. Consequently, while the mesh size within the contraction plane, ξll (t) = r(t)/R, decreases during radial contraction, where r(t) is the radius of the gel at time t, the mean mesh size in the perpendicular direction is constant, ξ
 = 20μm23. These values of the mesh/pore sizes are used to evaluate the gel elastic modulus, κ, and friction coefficient, γ, as detailed below (Aim [iii], Figure 6).
Aim (ii)
This aim involves demonstrating that an outward solvent flow is generated by myosin contractility. To track the solvent flow, fluorescent beads are added to the actomyosin solution. The beads are passivated to reduce the interaction between the moving beads and the actomyosin network. Overall, 1 μL of beads (Table of Materials) is incubated with 5 µm G-actin for 20 min at room temperature, and excess G-actin is removed by centrifugation (Table of Materials, see the protocol section for details). This step is repeated with 10 mg·mL-1 BSA (Table of Materials). The beads are added to the protein solution at a final dilution of 1:10,000 v/v. Since the aim is to allow the beads to move freely across the gel pore, it is important to adapt the beads' diameters to the gel pore size, such that their size ratio is always <<1. As such, 2,300 nm diameter beads are used to analyze the initial and intermediate stages of contraction (Figure 5A,B) when the average pore size is larger than 15 µm, and 200 nm diameter beads are used when the pore size is smaller (Figure 5D–G). The beads' center-of-mass position is extracted for each time, t, (x(t),y(t))bead, using a standard particle tracking algorithm (Table of Materials), from which the trajectory (Figure 5B) and local bead velocity,  , can be deduced. The beads, and, thus, the penetrating solvent, move on average in the outward radial direction (Figure 5A,B), while the gel contracts inward, as shown from particle image velocimetry (PIV) analysis (see the green arrows in Figure 6A). This radial motion can be further elaborated by extracting the local beads' radial velocity, νr, which is evaluated by projecting the local bead velocity onto the radial direction defined by the unity vector,
  , connecting the gel center (x0, y0) and the bead center-of-mass position at time t:
  where
where 
The data show that as the beads move outward from the gel center, their velocities initially increase, and they then slow down as they approach the gel boundary (Figure 5C). Notably, the bead velocity can be 20 times greater than the gel radial contraction velocity (blue curve in Figure 5C). The filled circles mark the time the beads leave the gel. The beads continue to move after exiting the gel boundary for some time. This movement cannot result from inertial effects, since the Reynold number is <10-4. The radial bead velocity decreases with time concomitant with the decrease in gel contraction; notably, when the gel radial contraction velocity has significantly decreased, the velocity of the beads fluctuates significantly.
To test if these fluctuations result from the porous structure of the actomyosin, the network tracks the motion of the beads at a higher spatial resolution, which is possible when the contraction of the gel has significantly slowed down (Figure 5D–F). The trajectory of the beads is indeed tortuous (Figure 5D,E), with significant fluctuations in the beads' local velocity, which reflects the porous structure of the gel-that is, the local velocity is fastest close to the pore center and slowest in the vicinity of an actin bundle (Figure 5F).
Finally, calculating the gel velocity-solvent velocity correlation function demonstrates that locally the fluid flow is directed opposite to the contracting gel. Using local bright spots in the gel as fiducial markers, their center-of-mass position for each time point, t, (x(t),y(t))gel, can be calculated, and the local gel velocity can be derived:  . Then, for each bead and a nearby point in the gel, the local bead velocity-gel velocity pair correlation is calculated to extract the angle, θ, between the two vectors:
  , where
  and
and  are the local speeds (magnitude) of the bead and the gel, respectively. The data show that independent of the position of the bead within the gel pore, locally, the fluid flow is directed in the opposite direction with respect to the gel (Figure 5G). Overall, the results show that an outward fluid flow is generated by myosin contractility, as expected for a poroelastic active material3,7,23,30.
Aim (iii)
This aim involves demonstrating that stress relaxation is characterized by an effective poroelastic diffusion constant, D, which depends on the network elastic modulus, porosity, and solvent viscosity. First, the lateral (in-plane) velocity of the contracting gel is quantified (Figure 6A). Firstly, the fluorescence images are binarized, and the gel projected area at each time point t, A(t), is extracted. Then, the gel radius is calculated,  (Figure 6B). From this, the radial contraction velocity at time point t,
  , is derived which describes the gel edge velocity (Figure 6C). The edge velocity shows a typical temporal evolution profile characterized by an initial linear phase, in which the edge velocity increases at a constant rate,
  , until a maximal velocity, νmax, is reached at time tmax. The velocity then decays exponentially with a characteristic relaxation time, τ, until a mechanically stable state is reached (Figure 6C). The rmax is the gel radius at the beginning of that relaxation phase.
For a poroelastic material, the relaxation time  , where
  is an effective poroelastic diffusion constant, κ is an effective elastic gel modulus, and γ is an effective friction constant that accounts for the movement of the aqueous solution through the actin gel pores. The elastic modulus has units of energy per unit volume and is inversely proportional to the volume of a unit cell in the gel, determined by the distance between crosslinks or the mesh size, such that
  . The friction coefficient, γ, depends on the pore facet perpendicular to the solvent flow. For in-plane gel contraction, the relevant pore facet is
  , and, consequently, the friction coefficient
  , where η is the solvent viscosity31,32. Overall, we obtain the following relation:
 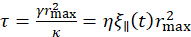 , where the relevant in-plane pore size
  is evaluated at tmax. Altogether, we obtain
  , which infers that the relaxation time should scale linearly with solvent viscosity23.
To test if this relation is obeyed, the experiments are repeated with different amounts of glycerol. The use of glycerol is advantageous as it is not expected to affect the activity of proteins, particularly the myosin motors. Moreover, correlations between the viscosity of water-glycerol solutions and the amount of added glycerol are available in the literature28. These correlations show that an increase in glycerol weight percent from 0% to 34% leads to a proportional increase in water-glycerol solution viscosity from ηω to 2.76ηω, where ηω is the water viscosity at 20 °C. In this glycerol range and for the same initial drop diameter, 2R = 2,800 µm, an increase in viscosity increases the duration of the network polymerization and self-organization phases, though the linear acceleration and maximal radial contraction velocity (νmax) are grossly unchanged. This evidence suggests that both network reorganization (porosity) and myosin activity are unaffected by the solution viscosity23, and the effect of solvent viscosity should be essentially reflected in the time it takes for the elastic stresses to relax. Indeed, the relaxation time shows a linear dependence on the solution viscosity (Figure 6D), which infers that the scaling relation derived above is obeyed, further confirming the poroelastic nature of the system.
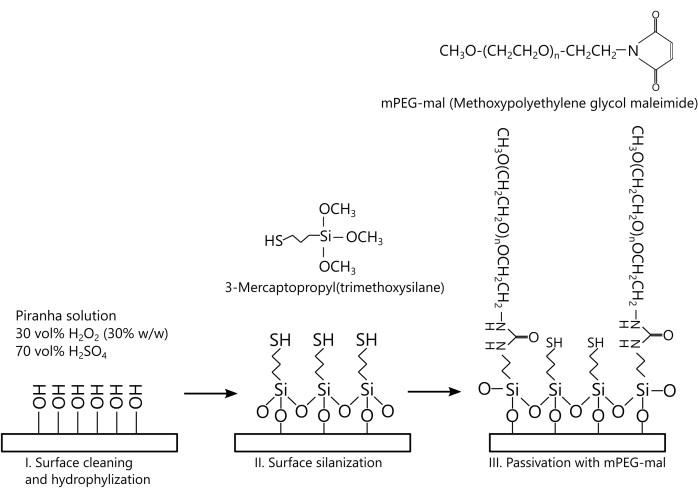
Figure 1: Schematic description of the three main steps of the glass coverslip surface treatment procedure. (i) Glass surface cleaning (Piranha treatment) and hydrophilization, (ii) surface silanization, and (iii) passivation with mPEG-mal. Please click here to view a larger version of this figure.
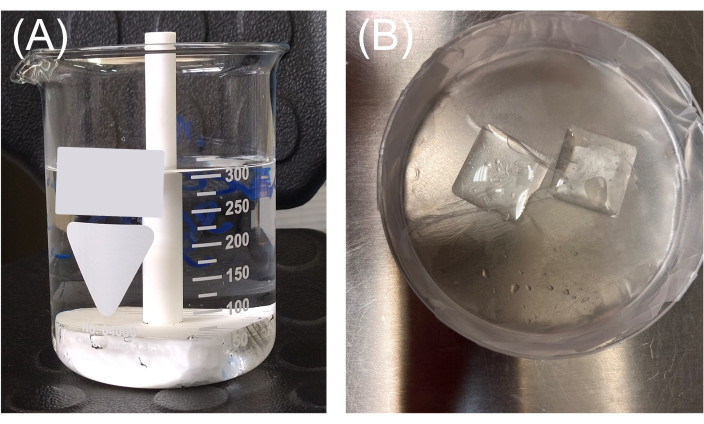
Figure 2: Glass coverslip passivation. (A) Piranha cleaning and silanization are performed in a 400 mL beaker using a homemade polytetrafluoroethylene holder consisting of 12 linear grooves. (B) Surface passivation is performed in a parafilm-coated Petri dish. Each coverslip is incubated with 1 mL of 5 kDa mPEG-mal at 4mg·mL−1 in 1x PBS (Table of Materials) for 1 h at 22 °C. The hydrophobic parafilm layer assures that the hydrophilic PEG polymer solution remains confined to the glass surface throughout the incubation time. Please click here to view a larger version of this figure.
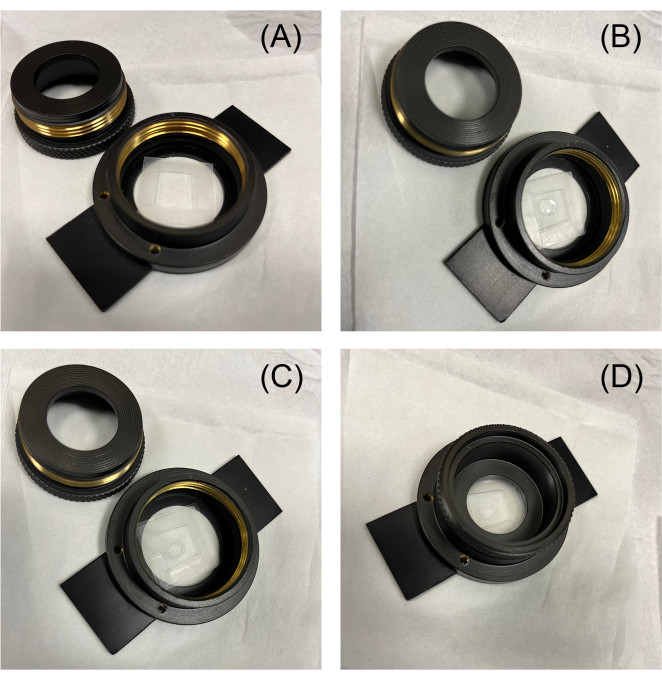
Figure 3: Running an experiment-the homemade sample holder. Experiments are run in a homemade sample holder that fits the dimensions of a standard microscope stage. (A) A greased parafilm spacer of thickness h (~150 µm) is placed on a PEG-passivated coverslip, and that coverslip is placed in the sample holder. (B) The actomyosin solution is prepared on ice in an Eppendorf tube, and 1.1 µL of that solution is placed on the coverslip; then (C) a second PEG-passivated coverslip is placed on top of it, and (D) the sample holder is screwed to confine the drop, which adopts a disc-like shape. Please click here to view a larger version of this figure.
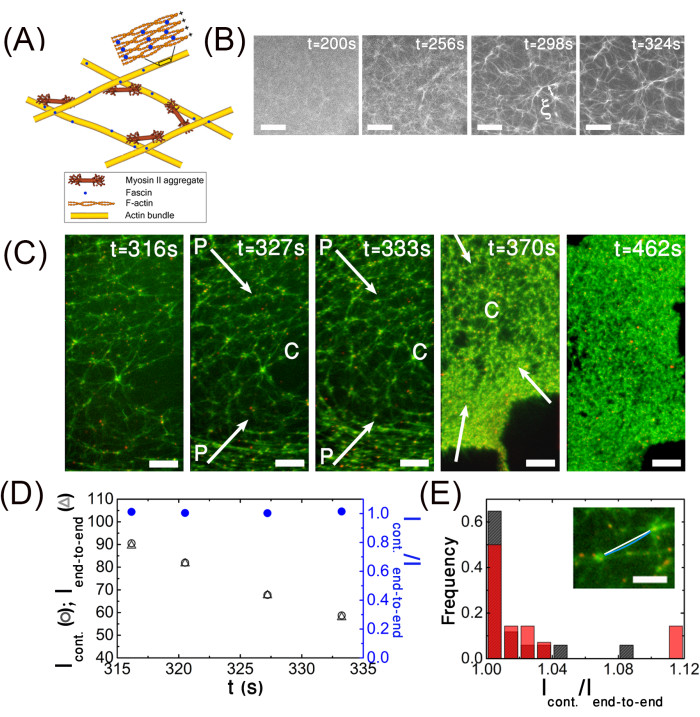
Figure 4: Poroelasticity aim (i). The actomyosin network behaves as an elastic material. (A) Schematic representation of an actomyosin network. (B) Actomyosin network formation. Fluorescence microscopy images demonstrate that the actin filaments spontaneously nucleate and polymerize into an isotropic interconnected network that coarsens with time and eventually contracts macroscopically. The porosity of the network is characterized by the network mesh size, ξ (double arrow). (C–E) Actomyosin network contraction is driven by actin filament bundle sliding. (C) Network contraction initiates at the gel periphery ("P") and propagates inward into the gel bulk. The white arrows show the direction of contraction. The gel center is marked with a "C". The fluorescent images show that the myosin motor aggregates (561 nm, red dots) are embedded in the actin network (488 nm, green) and remain attached to it throughout network contraction. (D) The actin filament bundles remain straight during network contraction. The ratio of the contour length, lcont, and end-to-end distance, lend-to-end, as a function of time. (E) Distribution of the ratio between the contour length and the end-to-end distance at t = 316 s (solid red) and t = 327 s (striped, gray). Inset: contour length (blue) and end-to-end distance (white) of a typical bundle. Conditions: (B,C,E[inset]): Images are acquired on an inverted fluorescent microscope with an EMCCD camera and a 10x/0.3 Ph1 UPlanFL air objective in regular mode (B) and in dual imaging mode after image overlay (C,E[inset]). Scale bars are (B,C) 100 µm and (E[inset]) 50 µm. This figure has been reproduced with permission from Ideses et al.23. Please click here to view a larger version of this figure.
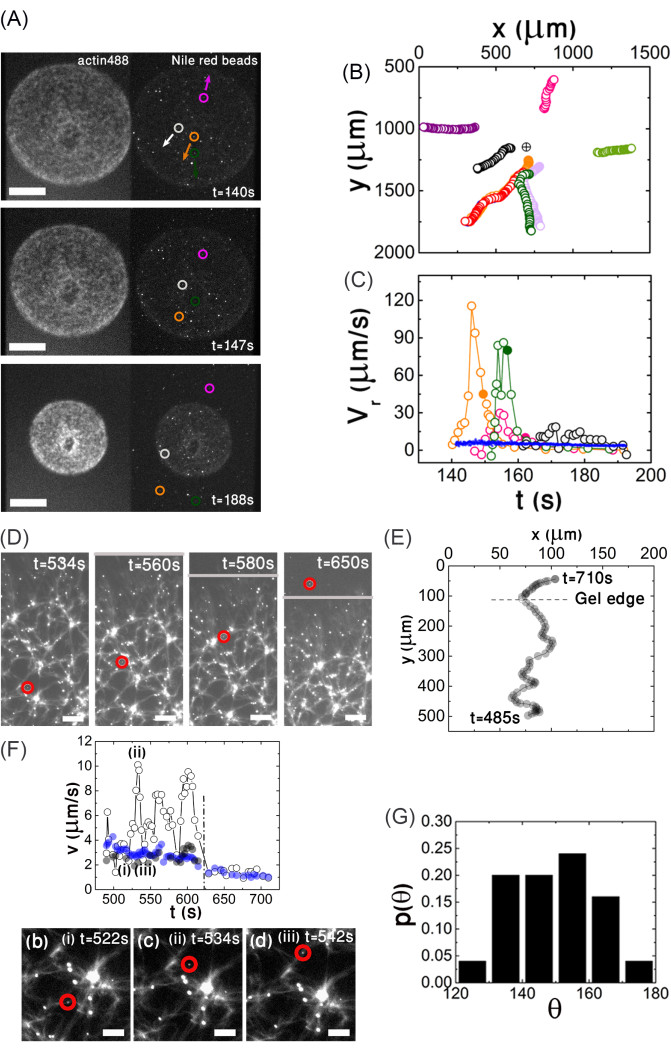
Figure 5: Poroelasticity aim (ii). An outward solvent flow is generated by myosin motor contractility. (A) Imaging the gel at a low magnification at intermediate stages of contraction: simultaneous fluorescence imaging of a contracting actin network (488 nm, left) and 2,300 nm fluorescent beads added to the solution (561 nm, right) as a function of time. The circles mark the positions of four beads. The arrows mark the global direction of the bead motion. (B) The trajectories of nine selected beads are depicted. The arrows mark the global radial direction of the beads' movement. The encircled cross denotes the gel center (x0,y0) (C) Local radial bead velocity νr (open circles) and (radial) gel edge velocity (blue dots) versus time. The filled circles indicate the time a given bead exits the gel boundary. (D–F) Resolving the network porosity and the movement of the solvent across the gel pores at advanced stages of contraction. (D) Epifluorescence images of the contracting gel and 200 nm diameter fluorescent beads added to the solution. Both the actin and beads are excited at 488 nm. The red circles follow the position of a bead with time. The gray line indicates the gel boundary. (E) Trajectory of the bead shown in (D). In the field shown, the gel contracts on average toward to bottom. The coordinates are measured relative to the origin of the camera. (F) The bead's local velocity reflects the porous structure of the gel. Top: Local bead speed (open circles), local gel speed (grey circles), and gel edge speed (blue circles) versus time. Bottom: Snapshots show the position of the bead for selected times. The bead is marked by a red circle. The dashed line marks the time the bead exits the gel. (G) Distribution of angles between the local gel and local bead velocities. Conditions: Images are acquired on an inverted fluorescent microscope with an EMCCD camera and (A) a 2.5x/0.075 Plan-NEOFLUAR objective and (D,F) a 10x/0.3 Ph1 UPlanFL objective. The scale bars are (A) 400 µm, (D) 100 µm, (F) and 50 µm. This figure has been reproduced with permission from Ideses et al.23. Please click here to view a larger version of this figure.
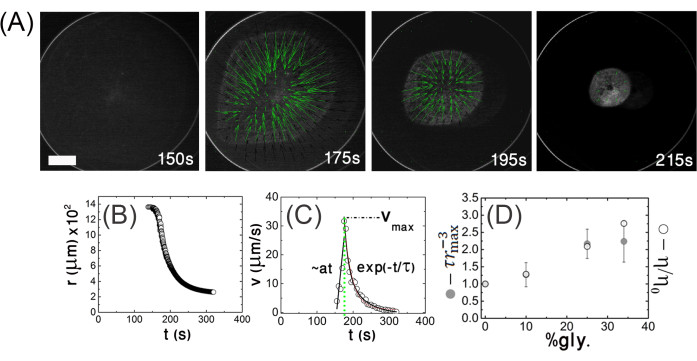
Figure 6: Poroelasticity aim (iii). stress relaxation is characterized by an effective poroelastic diffusion constant. (A) Top view fluorescence images of a contracting actomyosin gel at low magnification from the mixing time up to the steady state. The velocity field (green arrows) is extracted from the PIV analysis. The images are acquired on an inverted fluorescent microscope with an EMCCD camera and a 2.5x/0.075 Plan-NEOFLUAR objective. The excitation wavelength is 488 nm (actin). The scale bar is 500 µm. (B) Gel radius and (C) radial contraction velocity,  (i.e., the gel edge velocity versus time). a denotes the acceleration, vmax denotes the maximal velocity, and τ is a characteristic relaxation time. (D) The actomyosin networks behave as a poroelastic active material.
  and solvent viscosity, η, versus glycerol weight percent (wt%). The quantities are normalized to their values at 0 wt% glycerol. The gel's initial radius is R = 1,400 µm. The error bars are the standard deviations of the experimental values. This figure has been reproduced with permission from Ideses et al.23. Please click here to view a larger version of this figure.
