1. Preparation of 20 to 50% (w/v) Sucrose Gradients
Note: The gradients are made of 4 layers of sucrose (50%, 35% and 2 layers of 20%) in a 13.2 ml ultracentrifuge tube. In our experience, pouring the 20% sucrose in two separate layers greatly improves the quality of polysome preparations.
- Prepare the stock solutions. Ensure that all solutions are RNAse and DNAse free.
- Prepare 10X Salt Solution: 400 mM Tris-HCl pH 8.4, 200 mM KCl and 100 mM MgCl2.
- Prepare 2 M Sucrose Solution: For 200 ml, dissolve 137 g of sucrose in 1X Salt Solution.
- Dilute the Sucrose Solution in Salt Solution, as described in Table 1, to prepare the gradients. The volumes given are for six gradients.
| Final sucrose concentration | Sucrose 2M (ml) | Salt solution 1X (ml) | Final Vol. (ml) |
| 50% | 8.8 | 3.2 | 12 |
| 35% | 12.9 | 12.1 | 25 |
| 20% | 7.4 | 17.6 | 25 |
| 20% | 5.8 | 14.2 | 20 |
Table 1. Dilutions of the Sucrose Solution to prepare six gradients.
- Pour the layers as per Table 2.
| Sucrose layer | 50% | 35% | 20% | 20% |
| Vol. (ml) | 1.85 | 3.65 | 3.65 | 1.35 |
Table 2. Volume of sucrose solution per layer.
- After pouring each layer, keep the tubes in a -40 °C or -80 °C freezer until complete freezing before adding the next sucrose layer. Freezing is usually achieved after 2 hr at -40 °C, but waiting about 6 hr before pouring the next layer is recommended. The last 20% layer can be frozen or added freshly on the day of the experiment.
Note: Freezing each layer before adding the next one prevents from any mixing or disturbance of the layers. Gradients can be kept in a -40 °C or -80 °C freezer for at least six months. - If it has not already been done, add the last 20% layer to the gradients on the day of the experiment. Then, let the gradients thaw out in a cold room or a fridge.
2. Preparation of Cytosolic Extracts
Note: We recommend using two gradients per biological sample. 300 mg is the optimum amount of plant material to prepare two gradients when working with 6 days old Arabidopsis thaliana seedlings. When working with less translationally active tissues, the amount of plant material can be increased up to 600 mg.
- Harvest six day old seedlings grown on ½ Murashige and Skoog8 medium supplemented with 1% sucrose or equivalent media by quick-freezing in liquid nitrogen
- Grind plant material in a precooled mortar and pestle with liquid nitrogen.
- Weigh 300 mg of powdered material in a precooled weighing dish. Perform this step quickly to avoid thawing of the sample.
Note: Keep the frozen samples for no more than one week in a -80 °C freezer. - Add 2.4 ml of precooled polysome buffer (Salt Solution 4X, 5.26 mM EGTA, 0.5% (v/v) Octylphenoxy poly(ethyleneoxy)ethanol, branched, 50 µg.ml-1 cycloheximide, 50 µg.ml1 chloramphenicol) and homogenize by mixing with the pipette tip. Transfer into two 1.5 ml tubes. Work quickly to prevent the samples from warming.
- Centrifuge at 16,000 x g for 15 min at 4 °C in a microcentrifuge to pellet debris.
Note: To prevent RNA degradation, always keep the samples at 4°C, use RNase/DNase free solutions and work in RNase/DNase free conditions. Heparin can be added to the polysome buffer, to a final concentration of 300 µg.ml-1, to enhance RNA protection. However, since heparin can interfere with downstream analysis, it will have to be removed during the RNA precipitation step by performing lithium chloride precipitation instead of ethanol precipitation (cf. note 4.7).
3. Polysome Profiling
- Carefully pipette the supernatant without disturbing the pellet. If plant fragments have been pipetted, repeat step 2.5. Load the supernatant on top of the gradient by gently pipetting onto the sidewall of the tube in a constant stream. Use one gradient for each 1.5 ml tube.
- Transfer to precooled buckets and centrifuge at 175,000 x g for 2 hr 45 min at 4 °C, in an ultracentrifuge (e.g. 32,000 rpm when using a SW41 rotor).
- Set up the gradient collection system as described in Figure 1. The UV cuvette has a 1 mm pathlength.
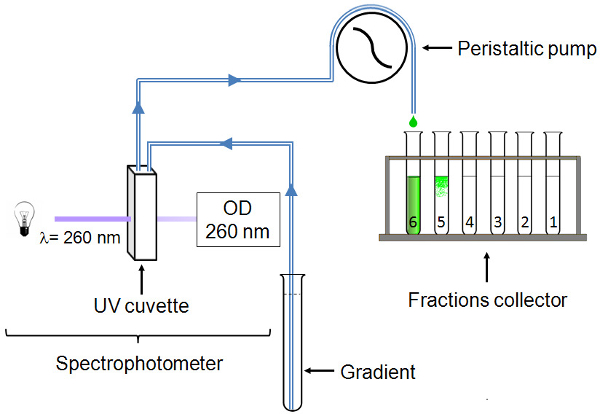
Figure 1. Gradient collection system. The UV cuvette is connected by polyvinyl chloride tubing to a glass capillary tube that descends to the bottom of the gradient. The gradient progresses through the system thanks to a peristaltic pump. OD260 is continuously read and 2 ml fractions are collected. Please click here to view a larger version of this figure.
- Adjust the fraction collector to RT, and set the carousel at a speed that will allow the collection of 2 ml fractions. Use pre-cooled collection tubes.
- Collect the fractions from bottom to top using a glass capillary tube connected by polyvinyl chloride tubing to the gradient collection system. Use a plastic paraffin film to secure the connection between the polyvinyl chloride tubing and the glass capillary tube.
- Read the absorbance at 260 nm from the bottom to the top of the gradient. When the entire gradient is collected, place the collection tubes on ice before RNA extraction.
4. RNA Extraction
- Pool the fractions collected from two gradients, in 50 ml capped centrifuge tubes, as follows:
Polysomes: fractions 1 to 3 (12 ml)
Monosomes: fraction 4 (4 ml)
Supernatant: fractions 5 and 6 (8 ml) - To each fraction, add 1 vol. 8M guanidine hydrochloride, 50 µg acryl carrier and 1.5 vol. isopropanol.
Note: Acryl carrier is linear acrylamide, used as a coprecipitant to improve the recovery of nucleic acids during alcohol precipitation. - Mix by inverting the tubes and precipitate O/N at -20 °C.
- Centrifuge at 175,000 x g for 1 hr at 4 °C, in an ultracentrifuge (32,000 rpm in a SW32 rotor). If the precipitation step is performed in a tube which is not compatible with ultracentrifugation, transfer to a suitable tube.
- Discard supernatant and dissolve the pellet in 200 µl RNAse-free TE buffer (10 mM Tris-HCl pH 7.5 – 1 mM EDTA). Transfer to a fresh 1.5 ml tube.
- Extract RNA by adding 1 vol. water saturated phenol (pH 6.6) and 1 vol. chloroform:isoamyl alcohol (24:1). Mix vigorously. Centrifuge at 15,000 x g for 20 min at 4 °C. Transfer the aqueous phase to a new 1.5 ml tube.
Note: Acid phenol (pH 4.5) can be used in order to minimize DNA contamination. - Precipitate RNA by adding 1/10 vol. 3 M sodium acetate and 3 vol. 100% ethanol. Allow precipitation at -80 °C for 20 min or O/N at -20 °C. Centrifuge at 15,000 x g for 15 min at 4 °C.
Note: If using heparin in the polysome buffer (cf. note 2.5), perform a lithium chloride (LiCl) precipitation instead of ethanol precipitation to properly remove any trace of heparin that could interfere with downstream analysis9. After extraction, add LiCl to a final concentration of 2.5 M. Allow precipitation for 30 min at -20 °C or O/N at 4 °C. Centrifuge at 15,000 x g for 15 min at 4 °C. - Wash the pellet with 500 µl 75% ethanol. Air dry the pellet and dissolve in 30 µl TE buffer. Assess RNA quality by electrophoresis on an RNAse free 1.2% agarose gel (100V, 15 min) or by capillary electrophoresis methods.
5. Data Analysis
- Export raw data to a graphic and data analysis software.
Note: As shown in Figure 2A and B, the raw profiles give qualitative information: the number of polysome peaks that can be seen, the height of the monosome peak, and the presence of a shoulder corresponding to the free ribosome subunits. - Merge profiles to allow comparison of the profiles between samples. Use the screen reader tool to determine the X value of the monosome peak for each sample and align the monosome peaks by removing extra data points at the beginning of the curves. Identify the lowest point of the curve and determine its Y value (using the screen reader tool). Set the lowest point Y value to 0 by using the "set columns value" function.
- Determine the polysomes/monosomes ratio by integrating the area under the curve from raw profiles (Figure 3C). Use the data selector tool to define the border of the area to be integrated. Then use the integrate function (Analysis-Mathematics).
- Normalize the curves to the monosome peak by dividing all data points of a curve by the Y value of the summit of the monosome peak (determined using the screen reader tool). Select the column, then under Analysis-Mathematics, select Normalize and choose the "divided by a specified value" methods. This step allows comparison of the relative level of polysomes (Figure 3D).
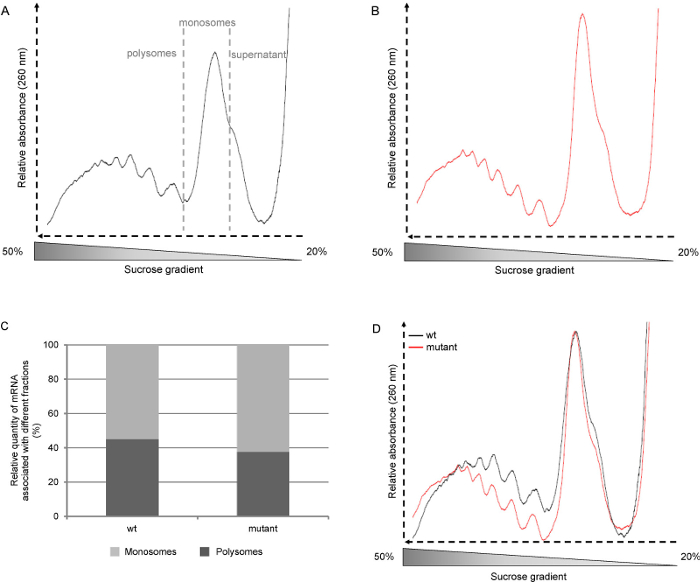
Figure 2. Representative polysome profiles. Arabidopsis thaliana wild-type (wt, ecotype Col-0) and mutant seedlings were grown for six days on ½ Murashige and Skoog medium under long day photoperiods (16 hr light, 8 hr dark). A: raw polysome profiles from wt seedlings. B: raw polysome profiles from mutant seedlings. C: Determination of the percentage of polysomes and monosomes by integration of the area under the curve D:Polysome profiles normalized to the monosome peak. Please click here to view a larger version of this figure.
In the literature, polysome profiles are often shown from the light fraction to the heavy fraction as a result of the way the gradients are collected, i.e. from the top to the bottom. Since in the protocol described here the gradients are collected from the bottom to the top, the profiles we show start with the heavy fraction (the polysomes) and go to the light fraction (free ribosome subunits and RNAs) (Figure 2A). We then collect each gradient in six 2 ml fractions, but smaller fractions can be collected if a more detailed analysis of polysome content has to be carried out.
Merging and normalizing the curves to the monosome peak (Figure 2D) allows the comparison of profiles from different lines or growth conditions. This provides information on the relative amount of polysomes independently of the level of initiation. Another way to analyze the profiles is to calculate the area under the curve, thus, one can determine the relative quantity of mRNA associated with either the monosomes or the polysomes (Figure 2C). This ratio is specific to a plant and growth conditions. However, this approach may not be relevant in the case of poorly translationally active tissues.
We have used this method for A. thaliana whole seedlings, young and old rosettes, as well as for N. benthamiana (Figure 3C), S. lycopersicum (Figure 3E) and O. sativa leaves (Figure 3D). The profile shape depends on the growth conditions, plant age and the tissues analyzed. Here we used A. thaliana six days old seedlings. At this stage, the translational activity is high, and the profile shows well shaped peaks (Figure 2A and B). This is also the case when A. thaliana flowers are used (Figure 3A). When using 4 weeks old A. thaliana rosettes (Figure 3B), the samples mostly contain fully developed adult leaves where cells do not divide. Hence, the overall amount of polysomes and monosomes is lower. The profile shows fewer, but still well shaped polysome peaks. Next to the monosome peak, the shoulder shows the large amount of free 60S ribosomal subunits. With other kind of plants or tissues, the polysome peaks may be barely visible. This is the case when using 30 days old O. sativa leaves (Figure 3D). Even when the amount of mRNAs involved in translation is very low (no polysome peak can be seen on the profile), the presence of the monosome peak indicates that the fractionation was properly done and that mRNAs can be further extracted from the fraction for further analysis. The quality of extracted RNA quality is assessed by agarose gel electrophoresis (Figure 4). The 25S and 18S cytosolic ribosomal RNA should be clearly visible on the gel. Lower bands corresponding to chloroplastic ribosomal RNA should also be visible when RNA are extracted from green tissues 10.
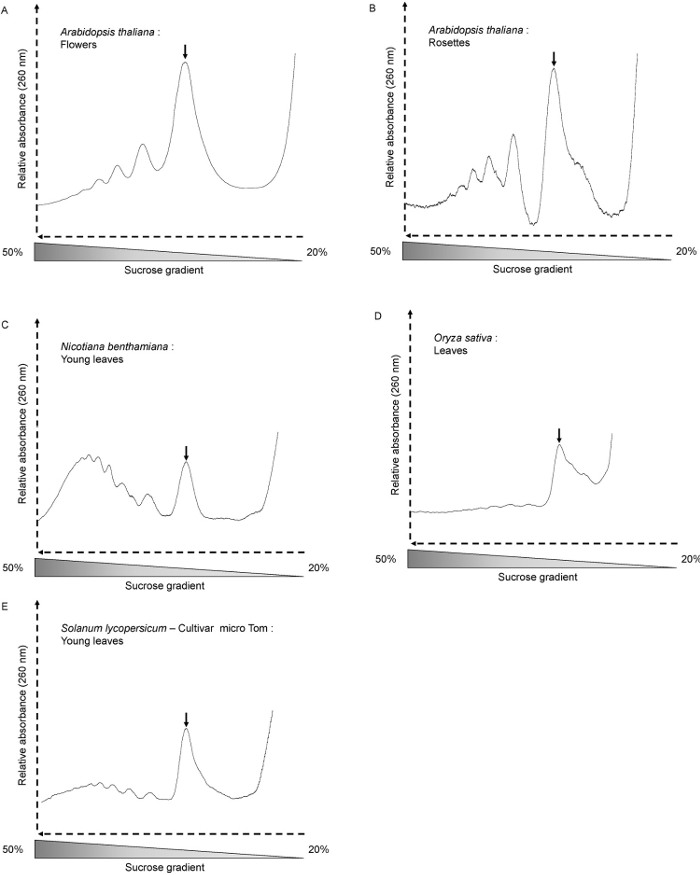
Figure 3. Polysome profiles from different plant material and species. (A) Arabidopsis thaliana flowers (300mg), (B) Arabidopsis thaliana 4 weeks old rosettes (600mg), (C) Nicotiana benthamiana (young leaves of 40 days old short day-grown plants – 300mg), (D) Oryza sativa (leaves of 30 days old plants – 300mg), (E) Solanum lycopersicum (young leaves of 35 days old short day-grown plants – 300mg). The monosome peaks are indicated by arrows. Please click here to view a larger version of this figure.
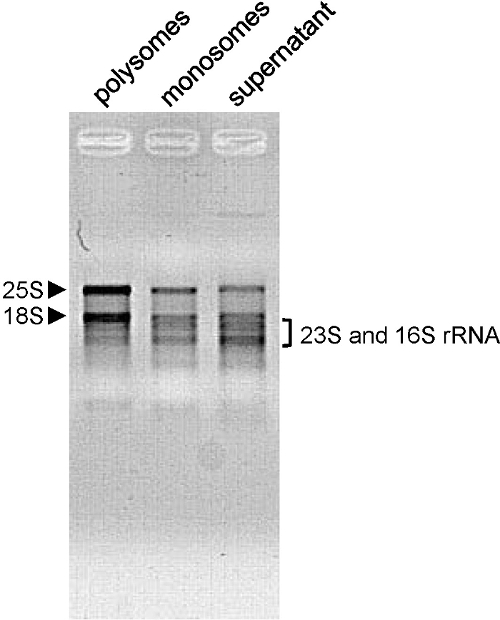
Figure 4. Assessment of RNA quality. RNA (500 ng extracted from shoots of 6 days old Arabidopsis thaliana seedlings) from the indicated fractions were loaded on a 1.2% agarose gel and separated by electrophoresis (100V – 15 min). Cytosolic (25S and 18S) rRNA are indicated by arrowheads and chloroplastic (23S and 16S) rRNA by a bracket. Please click here to view a larger version of this figure.
